Author

admin

Browsing

You don’t want to miss Mish’s 2023 Market Outlook, E-available now!

Despite the debate about the strength or weakness of the US Dollar, it will remain one of the most important currencies in the world for decades, and will continue to cause trouble for some. Still, new monetary paradigms are shifting in the global oil market, and Sovereign foreign currency reserves as two examples.

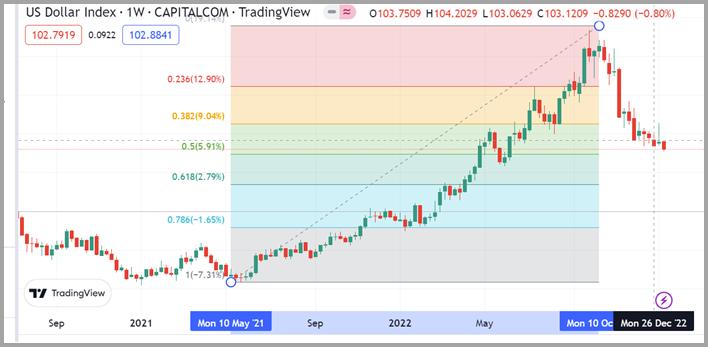
So, where is the USD going? Only time will tell, but in the long term, the dollar will most likely drift lower. Right now, however, it is in a unique area of support and resistance.

The US dollar has weakened almost 50% from the highs earlier this year, so breaking this 50% support area could alter the dollar’s trajectory and if holds, could provide continued support for now. (If you want to learn more about the US Dollar, click here to get a complimentary copy of Mish’s 2023 Market Outlook E-Book in your inbox and read her column for regular updates.)

The chart below shows the US Dollar compared to the Euro. 1.07 is a support level for the Euro. 1.09 also happens to be the 50% retracement from the highs, so, most likely, the Euro will find resistance coinciding with this area, but it might also strengthen. These intersections are generally dependable resistance areas, and the Euro will likely hit 1.09 resistance and turn back down. However, if it rises to 1.11, that might signal a larger paradigm shift in currency trends.

Despite a challenging year for asset markets, the U.S. dollar remains an essential cornerstone of financial transactions worldwide and means of exchange.

If you want to improve your relationship with money and cultivate true abundance in your life, read Mish’s work. Unlocking your potential for profiting from trends could be easier than you think, and remember to keep your eye on key 50% support levels for the dollar’s next move.

Mish’s Market Outlook 2023 is a book you should read now!

Click here if you’d like a complimentary copy of Mish’s 2023 Market Outlook E-Book in your inbox. For more detailed trading information, contact Rob Quinn, our Chief Strategy Consultant, to learn more about Mish’s Premium trading service.

“I grew my money tree and so can you!” – Mish Schneider

Get your copy of Plant Your Money Tree: A Guide to Growing Your Wealth and a special bonus here.

Follow Mish on Twitter @marketminute for stock picks and more. Follow Mish on Instagram (mishschneider) for daily morning videos. To see updated media clips, click here.

Mish in the Media

In this special StockCharts TV presentation, Mish teaches you how to use four simple and reliable key indicators to help you catch big swings in the market.

In this appearance on Business First AM, Mish discusses why she’s picking Nintendo (NTDOY).

Mish sits down with Gav Blaxberg for a W.O.L.F podcast on what she has learned as a trader and teacher.

In this appearance on Business First AM, Mish explains how even the worst trade should not be too bad with proper risk management.

In this appearance on Real Vision, Mish joins Maggie Lake to share her view of the most important macro drivers in the new year, where she’s targeting tradeable opportunities, and why investors will need to keep their heads on a swivel. Recorded on December 7, 2022.

Mish sits down with CNBC Asia to discuss why all Tesla (TSLA), sugar, and gold are all on the radar.

Read Mish’s latest article for CMC Markets, titled “Two Closely-Watched ETFs Could Be Set to Fall Further“.

Mish talks the current confusion in the market in this appearance on Business First AM.

Mish discusses trading the Vaneck Vietnam ETF ($VNM) in this earlier appearance on Business First AM.

ETF Summary

S&P 500 (SPY): 384 support; 392 resistanceRussell 2000 (IWM): 172 pivotal support; 180 resistanceDow (DIA): 330 support; 338 resistance.Nasdaq (QQQ): 265 support; 273 resistance.Regional banks (KRE): 56 support; 62 resistance.Semiconductors (SMH): 211 support; 220 resistance.Transportation (IYT): 220 pivotal support; 230 now resistance.Biotechnology (IBB): 127 pivotal support; 168 overhead resistance. Retail (XRT): 60 pivotal support; 65 now resistance.

Mish Schneider

MarketGauge.com

Director of Trading Research and Education

Wade Dawson

MarketGauge.com

Portfolio Manager

In this year’s first episode of StockCharts TV’s Sector Spotlight, I look at the current state of sector rotation, then walk through all 11 sector charts to make an assessment on their individual (relative) trends and their near-term support and resistance levels. Next, I use all this information to “reverse engineer” support and resistance levels and a price target for SPY.

This video was originally broadcast on January 10, 2023. Click anywhere on the Sector Spotlight logo above to view on our dedicated Sector Spotlight page, or click this link to watch on YouTube. You can also check out the video on the StockCharts TV on-demand website StockChartsTV.com, or on the associated app on mobile platforms like iOS and Android, or TV platforms like Roku, Apple TV, Amazon Fire TV and Chromecast.

Sector Spotlight airs weekly on Tuesdays at 10:30-11:00am ET. Past episodes can be found here.

#StaySafe, -Julius

There are tons of charts to choose from to make a point about how bullish or bearish the market is. However, when you pick broad market charts, there is little to argue a point. Composite exchange charts (all the stocks in a group) reach a broad swath of the economy and help you see a wider view, rather than a narrower selection of the Nasdaq 100 ($NDX), the S&P 500 index ($SPX), the Dow Jones Industrial Average ($INDU), or a specific industry.

NYSE Line Chart

The charts below are from the NYSE. The NYSE Composite index ($NYA) represents the ‘stock exchange’ rather than a select group of the best charts.

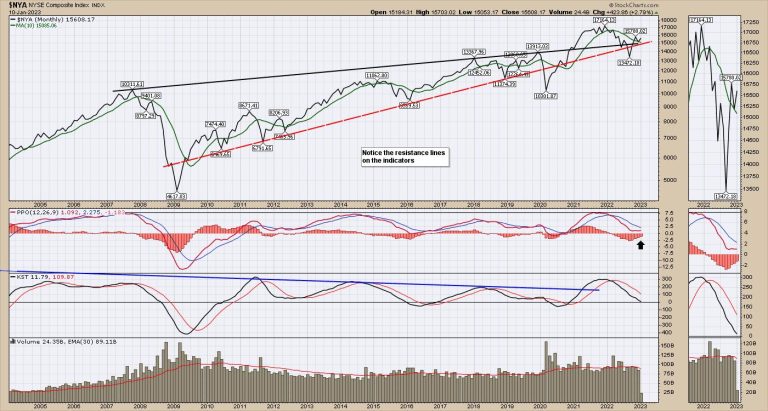
This week, $NYA sits at an important crossroads, one it hasn’t visited in a long time. The junction of the top trend line since the 2007 high, the support trend line since 2010, and the 10-month moving average (MA) are all providing support under this chart after the 2020 frenzy of free government money. The chart exploded higher in 2020 through 2021 and slipped lower for most of 2022. $NYA bottomed in October 2022.

The percent price oscillator (PPO) is trying to turn up, just above zero. If the oscillator turns higher from here, it could be bullish. You don’t want to see the PPO start to fail and drop below zero.

Another interesting clue is that in the 2008–2009 crisis, volume accelerated above the average until the market lows of October 2008 were in. The current volume seems comfortable below the MA, hinting that large investors may not be too worried if the market doesn’t get through this threshold level.

NYSE Bar Chart

When you look at the monthly bar chart rather than a line chart, a few other clues come into play. A bar chart shows the price throughout the month, not just the closing price.

Price sits at the monthly trend line. So far, there have been four months of higher lows. $NYA also seems to be holding above its 10-month MA, which was a resistance level in mid-2022. The PPO is the same as the chart above, and indicates that this is a typical bounce point. The difference is that this bounce is taking place without the Fed’s help.

NYSE Weekly Bar Chart

Moving to the weekly chart (see chart below) and a few more interesting things pop up.

The chart is holding above the 10-week MA (blue line). This was a support level all the way through 2020 and most of 2021. It’s also trending up and has clearly broken any downtrend drawn on the MA. Price on a weekly chart looks much better and has broken a down trend line on the previous highs and has bounced off that line. The PPO is turning up very bullishly, right at zero.

As $NYA continues to rally, this looks more and more like the start of a bull market. I have a variety of charts telling me to be more positive on the outlook. It seems each week in the newsletter to clients, the stock market’s bullish outlook is improving.

I also did a presentation about how we expect to manage the market turbulence in 2023 as we have a couple of interesting crossroads coming at us. That presentation can be found here. Investing Strategies From Osprey Strategic.

Grab a beverage and see if some of the ideas presented can help you preserve capital while enjoying the upside. Have a wonderful 2023!

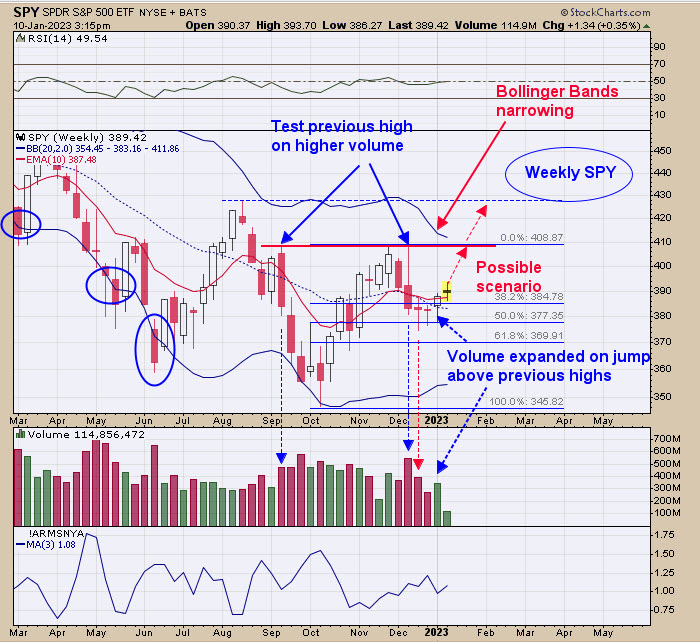
Yesterday, we said, “The week of December 19 tested the week of December 12’s low on at least 10% lighter volume, then closed above the December 12 low generating a bullish signal. If a market can’t take out the previous low on higher volume, it will reverse and attempt to take out the previous high; in the current situation, this would give a target to the week of the December 12 high near 410 on the SPY. The SPY traded sideways for over two weeks going into last Thursday, and the Bollinger Bands narrowed, suggesting a large move is about to begin. The large up move on Friday on increase volume suggests the large move has begun.” Employment numbers come out Thursday and may add energy to the market. I didn’t point this out in my market letter, but January 6 was a full moon and the day SPY broke out of the sideways trading range that began December 19.

The bottom window is the Zweig Breath Thrust noted with blue and red lines. A Zweig Breadth Thrust is when the NYSE Advance/NYSE total reaches below .40, then rallies to above .60 in 10 days. The Zweig Thrust usually shows up at near a bottom in the market and gives credit that a bottom is forming, and helps to confirm an intermediate rally is beginning. There were a few Zweig Thrusts coming off the March 2020 low note on chart. We have two Zweig Thrusts so far in the current market, noted on the chart above.

Tim Ord,

Editor

www.ord-oracle.com. Book release “The Secret Science of Price and Volume” by Timothy Ord, buy at www.Amazon.com.

Signals are provided as general information only and are not investment recommendations. You are responsible for your own investment decisions. Past performance does not guarantee future performance. Opinions are based on historical research and data believed reliable; there is no guarantee results will be profitable. Not responsible for errors or omissions. I may invest in the vehicles mentioned above.

You don’t want to miss Mish’s 2023 Market Outlook, E-available now!

As earnings season kicks off, the market is primed to witness some surprising turns in the coming days, weeks, and months ahead. Powell’s speech today kept investors thinking about future interest rate hikes and what that all will mean.

Gold and silver continue to rise as a hedge against inflationary pressures from an increasingly robust labor market, alongside continued consumer spending. Oil is creeping up slowly. Value stocks outperform growth, while the US Dollar is vulnerable. These data points are monitored continuously, to get a clearer idea of where the market will be in a few months.

We also watched similar events unfold, and brought a favorite indicator for times like this! Financial professionals watch these factors across markets closely.

The CAPE Ratio Explained

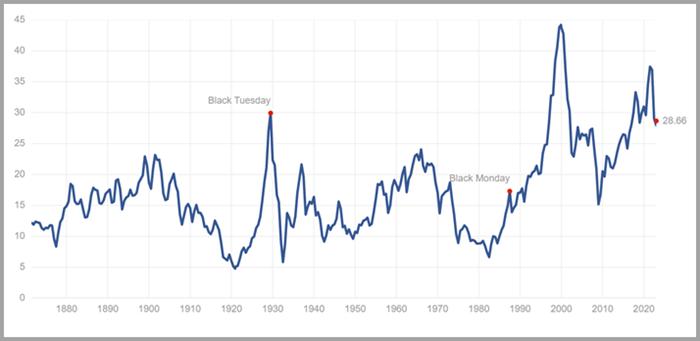
Nobel prize-winning economist Robert Shiller created the cyclically adjusted price-to-earnings (C.A.P.E.) ratio to compile a valuation measure that averages profits over the last ten years, meaning it takes the stock price divided by a 10-year average of earnings. The CAPE Ratio is far from perfect, but it is an interesting measure to judge valuations.

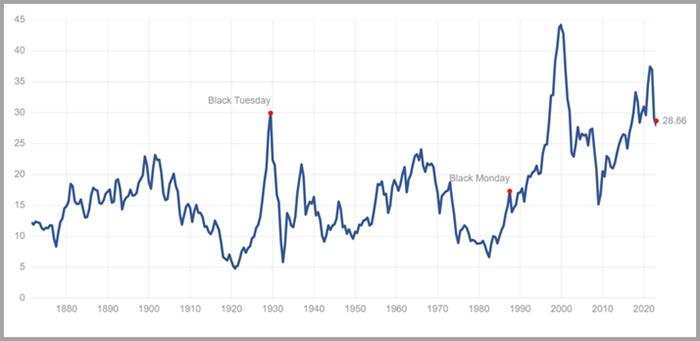
For example, shortly before the dotcom bust in 2000, the Schiller Ratio was at 44. The historical average is 16.7 and, on Tuesday, January 9, 2023, the Shiller Ratio was 28.66 similar in prices to 1929.

The price earnings ratio is based on average inflation-adjusted earnings from the previous 10 years, known as the Cyclically Adjusted PE Ratio or (CAPE Ratio). It’s a simple yet powerful measuring stick that helps identify and analyze trends in the business cycle, equipping those seeking financial gain better insight into potentially inflated market conditions.

Click here if you’d like a complimentary copy of Mish’s 2023 Market Outlook E-Book in your inbox.

For more detailed trading information, contact Rob Quinn, our Chief Strategy Consultant, to learn more about Mish’s Premium trading service.

“I grew my money tree and so can you!” – Mish Schneider

Get your copy of Plant Your Money Tree: A Guide to Growing Your Wealth and a special bonus here.

Follow Mish on Twitter @marketminute for stock picks and more. Follow Mish on Instagram (mishschneider) for daily morning videos. To see updated media clips, click here.

Mish in the Media

In this appearance on Business First AM, Mish discusses the worldwide inflation worries.

In this special StockCharts TV presentation, Mish teaches you how to use four simple and reliable key indicators to help you catch big swings in the market.

In this appearance on Business First AM, Mish discusses why she’s picking Nintendo (NTDOY).

Mish sits down with Gav Blaxberg for a W.O.L.F podcast on what she has learned as a trader and teacher.

In this appearance on Business First AM, Mish explains how even the worst trade should not be too bad with proper risk management.

In this appearance on Real Vision, Mish joins Maggie Lake to share her view of the most important macro drivers in the new year, where she’s targeting tradeable opportunities, and why investors will need to keep their heads on a swivel. Recorded on December 7, 2022.

Mish sits down with CNBC Asia to discuss why all Tesla (TSLA), sugar, and gold are all on the radar.

Read Mish’s latest article for CMC Markets, titled “Two Closely-Watched ETFs Could Be Set to Fall Further“.

Mish talks the current confusion in the market in this appearance on Business First AM.

Mish discusses trading the Vaneck Vietnam ETF ($VNM) in this earlier appearance on Business First AM.

ETF Summary

S&P 500 (SPY): 385 support, 395 resistanceRussell 2000 (IWM): 177 pivotal support, 184 resistanceDow (DIA): 333 support, 340 resistanceNasdaq (QQQ): 268 support, 276 resistance.Regional banks (KRE): 56 support, 62 resistance.Semiconductors (SMH): 216 support, 223 resistance.Transportation (IYT): 220 pivotal support, 230 now resistance.Biotechnology (IBB): 127 pivotal support, 168 overhead resistance. Retail (XRT): 60 pivotal support, 66 now resistance.

Mish Schneider

MarketGauge.com

Director of Trading Research and Education

Wade Dawson

MarketGauge.com

Portfolio Manager
In this week’s edition of Trading Simplified, Dave talks about real trading techniques for real traders, using real trades. He begins with a new mystery chart, explaining his Double Top Knockout Setup. He then continues his “Next 100” trades, noting updates to his open positions, discussing how you must learn to live with your methodology, and showing how discretion can improve performance — though it does come with a cost. Finally, he shows you where we are with his 10% TFM System and how the 30-week EMA, combined with Landry Light, can keep you on the right side of the market longer-term.

This video was originally broadcast on January 11, 2023. Click anywhere on the Trading Simplified logo above to watch on our dedicated show page, or at this link to watch on YouTube. You can also watch this and past episodes on the StockCharts on-demand video service StockChartsTV.com — registration is free!

New episodes of Trading Simplified air on Wednesdays at 12:00pm ET on StockCharts TV. You can view all recorded episodes of the show at this link. Go to davelandry.com/stockcharts to access the slides for this episode and more. Dave can be contacted at davelandry.com/contact for any comments and questions.

If you’ve been too focused on how much the high-flying tech stocks have brought down the value of your portfolio, you may not have noticed that value stocks that have been sidelined are showing signs of a turnaround. This isn’t unusual; in an economically uncertain environment, value stocks tend to do better than their growth counterparts. Not a guarantee, but something to think about as 2023 unfolds.

What Is a Value Stock?

Some people believe that a value stock is one that has fallen in value and is priced at a discount. In other words, if the price of a growth stock has fallen significantly, and you buy it at a bargain, it’s considered a value investment. That’s an extreme way of looking at it. Another, more realistic, perspective is to think of a value stock as one that’s trading at a low price relative to its fundamentals. In short, a value stock’s price may be lower than its book value, or its price/earnings ratio may be lower than that of its competitors.

Value stocks also have dividend and yield potential. And in times of uncertainty, the yield and dividends could give your portfolio some padding. Buff Dormeier, CMT, Chief Technical Analyst at Kingsview Partners, has seen this play out via market factors. “This past year, the value factor had a 32% relative outperformance over the capital-weighted indexes, whereas the growth style underperformed by -17% in 2022,” said Dormeier.

The Benefits of Investing in Value Stocks

Value stocks tend to have lower drawdowns during market declines. The chart below displays an overlay of the iShares Russell Value ETF (IWD) and the iShares Russell Growth ETF (IWF). IWD (yellow line) has been moving up and down in line with IWF (blue line). However, since October 2022, the gap between the two has widened, with value stocks significantly outperforming growth stocks. Does that mean it’s a good time to add value stocks to your portfolio?

CHART 1: PERFORMANCE OF GROWTH VS. VALUE. On this one-year daily chart, you can see that iShares Russell 1000 Value exchange-traded fund (IWD) has moved in line with and outperformed the iShares Russell 1000 Growth ETF (IWF) for most of 2022. Since October, IWD’s outperformance started becoming more significant.Chart source: StockCharts.com. For illustrative purposes only.

Given that value stocks are relatively stronger than growth stocks, it’s only natural to think that the move could be close to exhaustion. “I believe we’re still in the early innings of this movement,” added Dormeier. “This makes a ton of sense in an inflationary environment because, with high inflation, earnings are worth less in the future, on a discounted cash flow basis. So, owning cash cow companies provides an immediate payoff, especially when earnings are returned to shareholders via dividend payments.”

The present value of a growth stock is based on future cash flows. And when interest rates are high, the future cash flows are discounted at that higher interest rate. That makes growth stocks worth less and value stocks a more attractive investment.

How Long Should You Hold a Value Stock?

Value stocks tend to be cyclical, so, if you invest in them, it’s important to be engaged with the market and ready to swap them out when the time is right. You don’t want to be stuck holding them, because it may be a very long time before they go back up.

One way to figure out how long you should hold a value stock is to look at a chart of relative performance of IWD and IWF (see chart 2). The 20-day moving average (blue line) shows the trend is still in favor of value stocks, although they are pulling back a bit. It’ll be interesting to see if it bounces back up after hitting the moving average.

Note: To add the charts to your ChartLists, just click on the chart. It’ll take you to the StockCharts platform where you’ll have the option to add it to your ChartLists.

CHART 2: VALUE STOCKS ARE STILL FAVORABLE. Keep an eye on this chart to see if there’s a bounce off the 20-day moving average. This can be a good indication of how long you should hold a value stock.Chart source: StockCharts.com. For illustrative purposes only.

Which Stocks Are “Value” Stocks?

It’s best to do your due diligence using fundamental data, but here’s a cheat sheet.

Bank stocks tend to top the list of value stocks. They kick off earnings season on January 13, so add a bunch of them to your ChartLists—Bank of America (BAC), Citigroup (C), J.P. Morgan Chase (JPM), Wells Fargo (WFC), and Goldman Sachs (GS).Homebuilder stocks are also worth considering. Some of the stocks in this category include Pulte Group (PHM), Lennar Corp. (LEN), DR Horton (DHI), and KB Home (KBH). It may also be worth adding the S&P 500 Homebuilding Subindustry Index ($SPHB) to your ChartLists.Communications network stocks are another favorite among value investors. They are known for their dividends. Stocks that fall in this subsector include Verizon Communications (VZ), AT&T (T), and Comcast Corp. (CMCSA).Semiconductor stocks are also gaining some traction of late. Micron Technology (MU), Broadcom Inc. (AVGO), and Qualcomm, Inc. (QCOM) are just a few to consider.

One of the biggest factors driving macroeconomic uncertainty is inflation. Recent comments from Fed Chairman Jerome Powell seem to have put investors at ease indicating, that inflation may be cooling, but one piece of data doesn’t make a trend. So keep an eye on the Fed’s interest rate decisions; if it sounds like it’ll take a while before inflation reaches the 2% objective, value stocks may be enjoying their ride.

How To Find Stocks With Dividends and Yields

Scroll down to Symbol Summary under Member Tools in Your Dashboard or from Charts & Tools.Enter symbol in the symbol box.Under Summary, you’ll see annual dividend and yield displayed.

The Bottom Line

Even though value stocks are outperforming growth stocks, that doesn’t necessarily mean that they generate positive returns. But because value stocks tend to have lower drawdowns during stock market declines, your losses are likely to be less than from growth stock investments. And the dividends help. So, keep an eye on macroeconomic indicators, technical indicators, and charts of value vs. growth stocks. When you see a shift in sentiment, it may be time to change your strategy.

“Long-term, growth still leads value, but, during inflationary times when interest rates are high and money supply is tight, value investments are relatively more attractive,” concluded Dormeier.

The takeaway: Losing a little is better than losing a lot.

Jayanthi Gopalakrishnan

Director, Site Content

StockCharts.com


Disclaimer: This blog is for educational purposes only and should not be construed as financial advice. The ideas and strategies should never be used without first assessing your own personal and financial situation, or without consulting a financial professional.

You don’t want to miss Mish’s 2023 Market Outlook, E-available now!

Ahead of Thursday’s CPI inflation print, the stock market rose on Wednesday, extending previous gains for the week. The stakes for the Fed-critical report are high, since most investors expect a lower CPI Print. 

Apple, Microsoft, Alphabet, Amazon, and Tesla all had gains on Wednesday, potentially signaling a modest recovery in tech in the works, or they could all plunge tomorrow. As we ring in the Year of the Rabbit, investors have high hopes for what this new year can bring to their portfolios.

I recommend reading Mish’s 2023 Outlook – a must-read resource that forecasts macroeconomic trends, markets, and commodities and is an enjoyable read!

With the Federal Reserve’s expectations set that inflation will return to its target rate of 2% in 18-24 months, media coverage has recently been focused on this narrative, which is far from reality. There is no consensus on how much the US will grow, nor on how deep a recession might be felt. Energy prices have relaxed for now, which is positive. Shelter is 30% of CPI and trending higher. The prevailing narrative in the media today is that “inflation has peaked,” maybe, but it will not be 2% again for many years.

The shelter component is 30% of the total CPI calculation. Wages are going up. Food is soaring. Inflation will remain way above the Fed rate of 2%, and we will see if the CPI Print is softer tomorrow. It is positive if trending lower, but lower does not equal 2%.

With the end of 2022 and the turn of the New Year, investors must consider what lies ahead of tomorrow and beyond. As we enter 2023 the Year of the (Water) Rabbit – according to the Chinese zodiac calendar – many stakeholders will need insight to profit in 2023.

Click here if you’d like a complimentary copy of Mish’s 2023 Market Outlook E-Book in your inbox. For more detailed trading information, contact Rob Quinn, our Chief Strategy Consultant, to learn more about Mish’s Premium trading service.

“I grew my money tree and so can you!” – Mish Schneider

Get your copy of Plant Your Money Tree: A Guide to Growing Your Wealth and a special bonus here.

Follow Mish on Twitter @marketminute for stock picks and more. Follow Mish on Instagram (mishschneider) for daily morning videos. To see updated media clips, click here.

Mish in the Media

Mish and John discuss how equities and commodities can rally together, up to a point, in this appearance on Bloomberg BNN.

Mish and the team discuss her outlook and why inflation will persist, with a focus on gold, in this appearance on Benzinga.

While the weekly charts still say bear market rally, Mish and and host Dave Keller discuss the promise of the daily charts on the Tuesday, January 10 edition of The Final Bar (full video here).

In this appearance on Business First AM, Mish discusses the worldwide inflation worries.

In this special StockCharts TV presentation, Mish teaches you how to use four simple and reliable key indicators to help you catch big swings in the market.

In this appearance on Business First AM, Mish discusses why she’s picking Nintendo (NTDOY).

Mish sits down with Gav Blaxberg for a W.O.L.F podcast on what she has learned as a trader and teacher.

In this appearance on Business First AM, Mish explains how even the worst trade should not be too bad with proper risk management.

In this appearance on Real Vision, Mish joins Maggie Lake to share her view of the most important macro drivers in the new year, where she’s targeting tradeable opportunities, and why investors will need to keep their heads on a swivel. Recorded on December 7, 2022.

Mish sits down with CNBC Asia to discuss why all Tesla (TSLA), sugar, and gold are all on the radar.

Read Mish’s latest article for CMC Markets, titled “Two Closely-Watched ETFs Could Be Set to Fall Further“.

ETF Summary

S&P 500 (SPY): 389 support, 401 resistance.Russell 2000 (IWM): 179 support, 184 resistance.Dow (DIA): 336 support, 344 resistance.Nasdaq (QQQ): 274 support, 280 resistance.Regional Banks (KRE): 56 support, 62 resistance.Semiconductors (SMH): 216 support, 224 resistance.Transportation (IYT) 220 pivotal support, 230 now resistance.Biotechnology (IBB) 127 is pivotal support, 138 overhead resistance. Retail (XRT): 68 now resistance.

Mish Schneider

MarketGauge.com

Director of Trading Research and Education

Wade Dawson

MarketGauge.com

Portfolio Manager

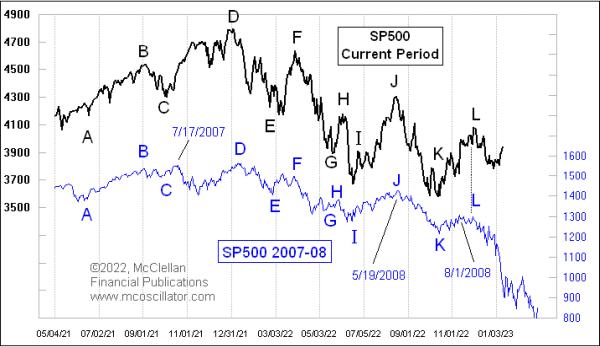
Price pattern analogues are fun to find and track, as long as one understands that the correlation is never going to be absolutely perfect. And the additional point that must be understood is that every pattern analogue breaks correlation eventually — they most often do so at a point in time when you are most counting on them to keep working.

This week’s chart shows a pretty thorough breaking of correlation with a prior pattern, in this case the bear market of 2007-09. It has been working nicely throughout 2022. The letters in the chart are just a means of identifying points of similarity between the two price plots. The correlation of the two patterns was a little bit weaker in the beginning, at the left end of the chart, but got tighter as 2022 wore on.

If the stock market in 2023 was going to continue following this pattern analogue, then we should be seeing a sharp decline right now, the echo of the stock market’s drop in September 2008 occasioned by the collapse of Lehman Brothers. Instead, the stock market is showing nice strength in January 2023, setting up hopes for the “January Barometer” to indicate a bullish year. That omen of stock market behavior has some statistical problems, as I detailed here back in 2019.

But people can still believe in something which the statistics do not support, and that can create market excitement for a while. Whatever the source of the new strength, and whatever its long term meaning might be, the strength we are seeing now in January 2023 is a definite break from the 2008 pattern, and so we can file this one away as a pattern analogue that was fun while it lasted, but which has broken its correlation and should not be expected to work any more going forward.

As a final note, one of the ways that an analogue can start to break correlation is that we may see the patterns invert, still matching the timing of the dance steps of the prior pattern, but doing so inversely. It may be that we are seeing that now. But any pattern which is fickle enough to invert its correlation is also fickle enough to disinvert without notice, so one should not count on that performance in this case.