Archive

2024

Browsing

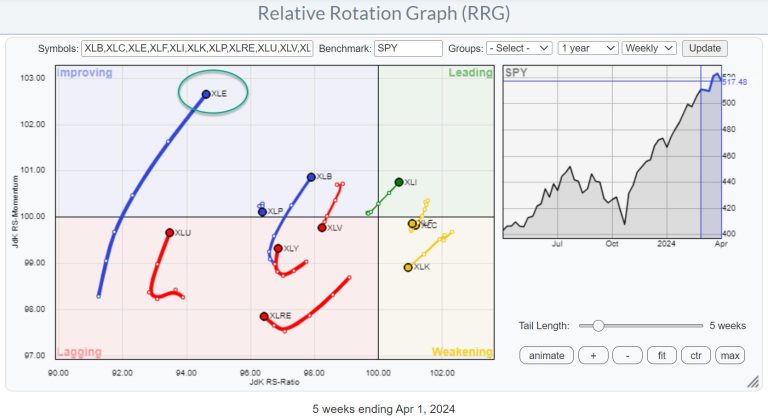
Strong Rotation on the Weekly RRG

For a few weeks now, the improvement in the energy sector (XLE) is becoming increasingly visible in the lengthening of the XLE tail on the Relative Rotation Graph. The recent rotation from lagging into improving on the weekly RRG is now starting to pick up steam and also move higher on the RS-Ratio scale, indicating a further improvement of relative strength.

Daily Rotation is Confirming Strength

This improvement is further emphasized on the daily RRG, where we find the XLE tail well inside the leading quadrant with a recent “hook” back up, following a dip in relative momentum.

Clockwise vs. Counter-Clockwise

As a side note, this is a good example where a tail “seems” to be making a counter-clockwise rotation. But in reality, under the hood, on a smaller time frame, you can see there is a clockwise rotation visible.

In this case, the pivot on the daily tail was on 4/1 (no joke). When I zoom in on 4/1 and the surrounding days using an hourly RRG, a clear clockwise rotation shows up.

Price Breaking Major Resistance

The energy sector was also mentioned in my previous article as one of the sectors that was close to breaking a major overhead resistance level.

This is now happening. With the excess supply of around $94 now out of the way, new upside potential was unlocked. This will certainly help further improve the relative strength of this sector.

Industries

From the Sector Summary page, we can dive deeper into the energy sector by opening up an RRG that shows the rotations for the various industries inside the sector. Just click on the small RRG icon at the end of the line.

Initially, this RRG will use the $SPX index as the benchmark. The overall strength of the sector is clearly visible in all groups (except Coal), moving inside the improving quadrant at a positive RRG-Heading.

However, things change when we switch the benchmark to XLE, which allows us to see the rotation of these groups within their own universe. We already know that the sector is doing well, but which industries should we focus our attention on?

Exploration & Production Stands Out

This changes the picture tremendously and immediately shows that there is really ONE group that is leading the Energy sector, and that is Exploration and Production.

The price chart for this group speaks volumes. The upward break already happened a few weeks ago, and now relative strength is really picking up the pace, with both RRG lines turning higher above the 100 level and pushing the tail further into the leading quadrant on the RRG.

Zooming in on Individual Stocks

Loading the predefined RRG for members of the Energy sector and then hiding tails/stocks that are not in exploration and production gives the RRG above. Going over the individual price charts reveals that the stocks inside the leading quadrant, the cluster in green, have already made a significant move higher in price terms. They have been leading the initial rally for this group.

When looking for better risk/reward opportunities, the tails a little more to the left and even inside the lagging quadrant probably offer better probabilities. Remember, the sector and the group are already doing well, so these stocks are well inside the improving or leading quadrant and traveling at a strong heading when you use $SPX as the benchmark.

One of these stocks is OXY. Its tail has just moved into the improving quadrant; though still a short tail, it’s moving in the right direction. The upward break in the price chart this week will certainly help a further improvement in relative strength and likely make this one of the new leaders in this industry.

#StayAlert and have a great weekend, –Julius

One day doesn’t make a trend—that’s one lesson we learned from this week’s stock market action.

The March non-farm payrolls data revealed that the US economy added 303,000 jobs, which is higher than the estimated 200,000. Additionally, the unemployment rate dropped to 3.8%, down from 3.9%. After yesterday’s massive selloff—mainly due to comments from Fed officials suggesting interest rate cuts may not happen this year—you’d think today’s strong jobs report would have made investors jittery. It would extend the narrative that interest rates will remain on hold for longer.

But that’s not what happened. Investors celebrated the strong jobs report, with equities and Treasury yields rising. The broader indexes closed higher, and the VIX pulled back to 16.13, which was a little high but not too alarming. Although the indexes were down for the week, seeing the broader markets close higher was encouraging after the selling pressure we saw on Thursday.

It’s possible the stock market was blowing off some steam. Nothing goes up in a straight line, and investors should expect an extended market to pull back. Yesterday’s pullback, although massive, was only about a 1% decline. Given that economic data is healthy, investors have no reason to worry. This week, we had good manufacturing and jobs data, so there’s no reason for any panic.

Several stocks made all-time highs, as can be seen by the extensive list of stocks that made the StockCharts New All-Time Highs scan. Some notable names filtered in the scan are Meta Platforms (META), ConocoPhillips (COP), and Exxon Mobil (XOM). Several companies in the Energy sector were filtered in this scan. 

Energy stocks have been on a tear. The Energy Select Sector SPDR ETF (XLE) reached a new high again, and its steep ascent is still in play. And it’s not just oil prices that are going up—the SPDR Gold Shares ETF (GLD) and iShares Gold Trust ETF (IAU) also hit new all-time highs. Commodities continue to show strength, as seen in the Invesco DB Commodity Index Tracking Fund (DBC).

CHART 1. COMMODITY PRICES CONTINUE TO RISE, ESPECIALLY OIL AND GOLD. Oil prices have climbed higher in a short time. Gold and other commodity prices are also rising.Chart source: StockChartsACP.com. For educational purposes.

But it wasn’t a great day for all stocks. One stock that got hit hard today was Tesla, Inc. (TSLA). It was one of the most active stocks in the S&P 500, closing lower by 3.59%. The stock is trading below its 200-day simple moving average with a declining relative strength index (RSI), which is getting close to oversold territory. Looking at the weekly chart of TSLA below, the stock is at a support level, but there’s room for it to drop much further before seeing any signs of reversal.

CHART 2. TSLA STOCK COULD BREAK SUPPORT. TSLA’s stock price could fall to its next support level at around $102.Chart source: StockCharts.com. For educational purposes.

It’s encouraging to see a recovery at the end of the trading week, but what would be even better would be to see a broad-based rally. We may get that as earnings week kicks off. A rotation into Industrials, Financials, and Materials would positively impact the stock market. So watch the StockCharts Sector Summary panel to identify when the rotation begins.

Earnings Showdown

Earnings season kicks off at the end of the week of April 8, starting with the big banks. That means the focus will be on corporate earnings in the next few weeks. According to FactSet, Q1 year-over-year earnings growth rate for the S&P 500 is expected to be 3.6%. If companies report higher-than-expected earnings and revenues, the market will probably continue trending higher.

As long as companies generate positive cash flow and show higher profit margins, investors have no reason to sell their investments.

Important inflation data will also be released next week. The March CPI and PPI will be reported on Wednesday and Thursday. So fasten your seatbelts! Next week could see some choppy trading activity. But don’t let a little choppiness make you change your investment strategies, unless there’s catastrophic news beyond anyone’s control. 

End-of-Week Wrap-Up

S&P 500 closes up 1.11% at 5,204.34, Dow Jones Industrial Average up 0.80% at 38,904; Nasdaq Composite up 1.24% at 16,248.52$VIX down 1.96% at 16.03Best performing sector for the week: EnergyWorst performing sector for the week: Health CareTop 5 Large Cap SCTR stocks: MicroStrategy Inc. (MSTR); Super Micro Computer, Inc. (SMCI); Coinbase Global Inc. (COIN); Vistra Energy Corp. (VST); Vertiv Holdings (VRT) 

On the Radar Next Week

March Consumer Price Index (CPI)March Producer Price Index (PPI) More Fed speeches Earnings from Citigroup (C), JP Morgan Chase (JPM), Wells Fargo (WFC), Delta Airlines (DAC)

Disclaimer: This blog is for educational purposes only and should not be construed as financial advice. The ideas and strategies should never be used without first assessing your own personal and financial situation, or without consulting a financial professional.

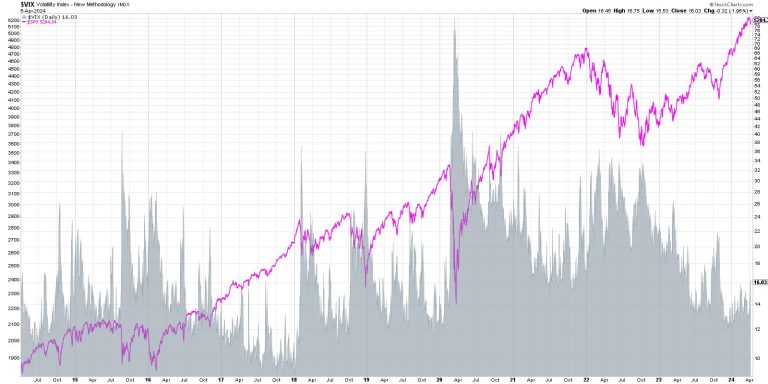
The VIX ended the week just above 16, bringing it to its highest level in 2024. What does this tell us about investor sentiment, and how does this compare to previous market cycles?

Let’s take a quick tour of market history through the lens of the VIX, focusing on which levels have tended to be good signals of market reversals, and then relate that back to our current setup with a VIX around 16 as we move further into the 2nd quarter of 2024.

We’re starting with a ten-year chart of the S&P 500 index (shown in pink) and comparing that to the VIX (shaded in gray). You’ll probably be drawn to the spikes in the VIX in 2020, 2019, and 2015, each of which represented significant drawdowns for the S&P 500.

Why does the VIX tend to push higher when the SPX drops lower? This goes back to one of my favorite market maxims, “The market goes up the escalator and down the elevator.” Basically, bull markets are marked by slow-and-steady accumulation on the way up, as investors add positions over time. But when investors get nervous, fearing a drop in stock prices, they tend to panic and sell very quickly. Indeed, there is often a feedback loop where selling drives prices lower, which then begets further selling, which drives down prices even further.

The VIX is often called the “fear gauge” because of this inverse relationship to stock prices, but I prefer the term “uncertainty gauge” as a better reflection of what the series is actually designed to measure.

Let’s look at the inverse relationship in more detail.

Here we’re showing the VIX in the top panel, the S&P 500 in the middle, and then the 20-day rolling correlation between the two data series. Notice how there is often a strong inverse relationship between the two? While there have occasionally been spikes in the correlation to around the zero level (basically, no relationship between the two data series), the correlation has usually remained in the -0.7 to -1.0 range.

When I’m considering two series with an inverse relationship, it can be helpful to invert one of the data series.

Now we’re showing the VIX upside down in the top panel, which makes it easier to recognize how drops in the S&P 500 usually coincide with spikes in the VIX. So have we seen enough of a rise in the VIX to raise a red flag on this bull market? Not quite, in my opinion. But I do have some key levels I’ll be watching through Q2.

In a low-volatility environment like the one we’ve seen in the last eight months, similar to 2019 and 2017, the VIX spends a great deal of time below the 15 level (green-shaded area). Thus, a VIX below 15 represents a low-volatility bull market phase. When the VIX pushes above 15 but remains below 20 (blue-shaded area), this suggests that the long-term trend is still positive, but we are likely entering a pullback phase within that bullish trend. When we see a VIX push above 20 but not above 28.5 (yellow-shaded area), that would mean we are now in a high-volatility environment. The S&P 500 is probably in a clear pullback by now, and investors will be questioning whether it’s the beginning of a much deeper bearish phase. 

The last time we broke above 20 was heading into the October 2023 market low. I was fairly bearish at the time, because the VIX pushing above 20 usually means we’re just getting started with a market decline. The strength of price action off the October low, along with bullish rotations in breadth and momentum indicators, told us that the VIX above 20 was a false alarm.

Now, if the VIX pushes above the 28.5 level (red-shaded area), then the S&P 500 has essentially entered a confirmed bearish phase. This is a level I learned about from Tim Hayes at Ned Davis Research, based on research they had conducted on a deep history of the VIX. The last two times we saw a rotation above that key 28.5 level? November 2021 just before the 2022 market top, and February 2020 at the beginning of the COVID era. A VIX above 28.5 is actually fairly uncommon, and I’ve learned to treat extremes in the VIX as a major red flag and a good reason to rotate to risk-off positions.

A quick review of market history tells us that a VIX around 16 indicates a likely pullback scenario within a bullish phase. However, it also tells me to be prepared for a higher VIX, which would mean higher levels of uncertainty. As we’ve seen with these charts, higher uncertainty usually means a higher risk that the market takes the elevator down to much lower levels!

RR#6,

Dave

P.S. Ready to upgrade your investment process? Check out my free behavioral investing course!

David Keller, CMT

Chief Market Strategist

StockCharts.com

Disclaimer: This blog is for educational purposes only and should not be construed as financial advice. The ideas and strategies should never be used without first assessing your own personal and financial situation, or without consulting a financial professional.

The author does not have a position in mentioned securities at the time of publication. Any opinions expressed herein are solely those of the author and do not in any way represent the views or opinions of any other person or entity.

In this edition of StockCharts TV‘s The Final Bar, Dave answers questions from The Final Bar Mailbag. Today he talks about how to use the ADX indicator, how growth vs. value may have formed a double top pattern, how to use VWAP for intraday and historical analysis, and what a sell signal from MACD should look like!

This video originally premiered on April 5, 2024. Watch on our dedicated Final Bar page on StockCharts TV!

New episodes of The Final Bar premiere every weekday afternoon. You can view all previously recorded episodes at this link.

In this episode of StockCharts TV‘s The MEM Edge, Mary Ellen shares what to be on the lookout for to tell if it’s safe to put new money to work. She also shares the weakness in select sectors and which areas she suggests to underweight. Last up, the art of buying stocks that have pulled back is discussed.

This video originally premiered April 5, 2024. Click here or on the above image to watch on our dedicated MEM Edge page on StockCharts TV.

New episodes of The MEM Edge premiere weekly on Fridays. You can view all previously recorded episodes at this link.

If you’re looking for stocks to invest in, be sure to check out the MEM Edge Report! This report gives you detailed information on the top sectors, industries and stocks so you can make informed investment decisions.

NEW YORK – That ground-shaking moment at Yankee Stadium wasn’t caused by Juan Soto being introduced or Aaron Judge launching a long home run.

It was caused by a 4.8 magnitude earthquake that rolled in during Yankees’ batting practice as they prepared for Friday’s home opener against the Toronto Blue Jays.

None of the Yankees’ pregame activities were interrupted Friday morning. Several of the team’s on-field personnel either didn’t feel the ground shake or regarded the 10:23 a.m. event as a minor curiosity.

“I grew up in these things,’’ said Yankees manager Aaron Boone, who attended the University of Southern California and lived in SoCal when his father, Bob, played for the Angels.

At first, “I thought it was the sound system, actually,’’ said Boone, who was standing near the batting cage. “Then, I’m like, ‘No that wasn’t the sound system.’ I felt that. Just vibration under my feet.

MLB SALARIES: Baseball’s top 25 highest-paid players in 2024

‘I’m used to it.’’

As a student at USC, Boone experienced the devastating 1994 Northridge earthquake.

“(It) was not like today’s earthquake. It was the real deal,’’ said Boone.

Fans had yet to be admitted into the ballpark when the ground-shaking event occurred.

Yankees bench coach Luis Rojas said he “felt something’’ and was “glad to hear that I’m not going crazy,’’ when others mentioned feeling the ground shake.

“I was standing at second base, waiting for the guys to come out in the outfield to do some work,’’ said Rojas, when he felt the ground vibrate.

He then shared a look with Yankees catcher Jose Trevino, in a “did you feel that?’’ moment.

But others on the field didn’t feel anything unusual.

“First time I’m hearing about it,’’ said infielder Oswaldo Cabrera, who was taking grounders at third base at the time.

“I thought you (asked) if I’m always shaking,’’ Cabrera said with a laugh.

This post appeared first on USA TODAY

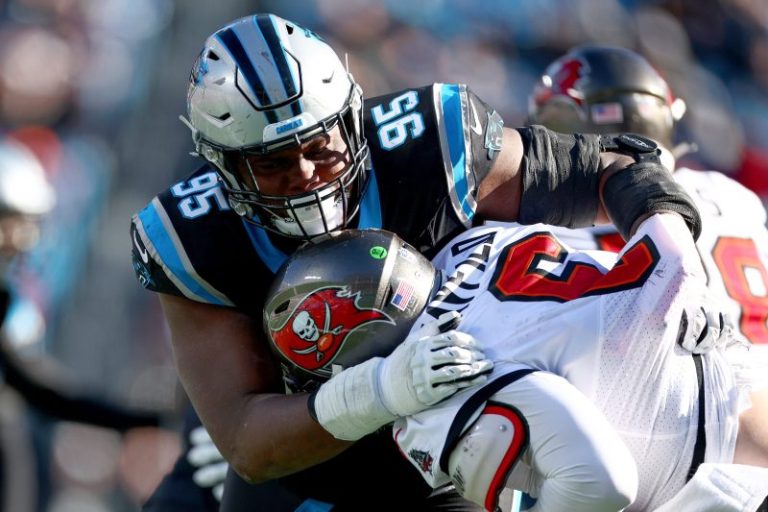
Derrick Brown is the latest defensive tackle to receive a hefty pay raise.

The Carolina Panthers are signing Brown to a four-year extension, the team announced.

Brown’s contract is worth $96 million and includes $63.1 million guaranteed, a person familiar with the situation told USA TODAY Sports. The person spoke on condition of anonymity because they aren’t authorized to discuss terms of the agreement.

Brown is coming off a career-best season in which he produced career highs in tackles (103) and QB hits (15). His 103 tackles in 2023 marked an NFL record for defensive linemen. His performance last season earned him his first trip to the Pro Bowl, as he was key to the Panthers’ fourth-ranked total defense.

The 6-foot-5, 320-pound defensive tackle has 245 tackles, 28 tackles for loss and 8 sacks in four seasons. He has 63 starts and has started in every game for the Panthers for the past two years.

All things Panthers: Latest Carolina Panthers news, schedule, roster, stats, injury updates and more.

The Panthers selected Brown with the No. 7 overall pick in the 2020 NFL draft. The Auburn product has 190 defensive stops since entering the league in 2020, the seventh most among all defensive tackles over that span, per Next Gen Stats.

Defensive tackles Chris Jones (Kansas City Chiefs), Christian Wilkins (Las Vegas Raiders), Justin Madubuike (Baltimore Ravens) and Brown have all earned contracts of over $90 million in overall value this offseason.

This post appeared first on USA TODAY

Viewers are in for a treat Friday night when arguably the two best players in women’s college basketball – Caitlin Clark and Paige Bueckers – go head-to-head in the Final Four with a berth in 2024 NCAA Tournament championship game on the line.

Clark and the No. 1 seed Iowa Hawkeyes square off against Bueckers and the No. 3 seed UConn Huskies at 9:30 p.m. ET on ESPN in the second of two national semifinal games. No. 1 overall seed South Carolina takes on No. 3 seed North Carolina State at 7 p.m. ET (ESPN) in the first semifinal.

Clark and Bueckers were on the women’s basketball radar long before they hit their college campuses in Iowa City and Storrs, Connecticut, respectively. Both guards were among the top 5 recruits in 2019 and both immediately lived up to the hype in their freshman seasons. Bueckers earned national player of the year honors from multiple outlets, including Naismith and the Associated Press, following the 2020-21 season, while Clark shared WBCA national freshman of the year honors with her.

Bueckers ascent got temporarily derailed in what would have been her sophomore and junior seasons. During her sophomore campaign, she injured her knee in December and missed two months of the 2021-22 season before returning to lead UConn back to the Final Four. But a few months later, Bueckers tore the ACL in her left knee, causing her to miss the entire 2022–23 season and receive a medical redshirt.

Clark’s star, meanwhile, continued to rise. She was the consensus national player of the year by every outlet as a junior in 2022-23 and is well on her way to repeating the feat this year. Clark, who has broken more records than one can count this season – including the NCAA Div. I all-time scoring record – was named the Wade Trophy winner, Naismith Award winner and AP national player of the year for 2023-24 this week.

FOLLOW THE MADNESS: NCAA basketball bracket, scores, schedules, teams and more.

Clark will almost certainly be the No. 1 overall pick by the Indiana Fever in the WNBA draft on April 15, while Bueckers will return to UConn next season as the early favorite for 2024-25 national player of the year honors.

But how do the superstar guards stack up on the court? And what do the stats say? USA TODAY dove into the numbers of their freshman seasons in 2020-21, their current seasons, their play so far in the 2024 NCAA Tournament and their one head-to-head meeting.

Caitlin Clark vs. Paige Bueckers in 2020-21

Bueckers and Clark each put up eye-popping numbers in the first seasons of college basketball, immediately becoming the go-to players on their teams. But their scoring doesn’t tell the whole story.

Caitlin Clark vs. Paige Bueckers in 2023-24

With Clark coming off a sweep of the major awards and Bueckers back in form after missing the entire 2022-23 season, both stars continued light up the stat sheets.

Caitlin Clark vs. Paige Bueckers in 2024 NCAA Tournament

Clark and Bueckers will face off Friday night in the 2024 Final Four in Cleveland. Here are each of their stats through four NCAA tournament games this year.

Caitlin Clark vs. Paige Bueckers in 2021 Sweet 16

Friday night will not be the first time the superstar guards have squared off in the NCAA Tournament. In their freshman seasons, they battled in the Sweet 16 with Bueckers and UConn defeating Clark and Iowa 92-72.

Clark had 21 points and five assists in that game while Bueckers nearly recorded a triple-double, finishing with 18 points, nine rebounds and eight assists.

Clark made 7 of 21 field goals, 4 of 12 three-pointers and went 3-for-4 at the free throw line. She also added three rebounds, two steals and one block but turned the ball over five times. Bueckers made 7 of 18 field goals, 2 of 6 three-pointers and went 2-for-2 at the free throw line.

This post appeared first on USA TODAY

Bronny James, the 19-year-old son of NBA star LeBron James who played basketball for Southern California in his freshman season in 2023-24, will put his name in the NBA Draft and enter the NCAA transfer portal while maintaining his college eligibility.

“I’ve had a year with some ups and downs but all added to growth for me as a man, student and athlete,” Bronny wrote in an Instagram post. “Thank you to USC for an amazing Freshman year, and as always thankful for my family, friends, doctors, athletic trainers and fans for their support.”

He averaged 4.8 points, 2.8 rebounds and 2.1 assists and shot 36.6% from the field and 26.7% on 3-pointers in 25 games. James sustained a life-threatening sudden cardiac arrest in July while working out on the USC campus. He was diagnosed with a congenital heart defect and cleared to return to full basketball activities in late November.

Head coach Andy Enfield just left the Trojans for the same job at SMU, and Southern California hired Arkansas’ Eric Musselman as his replacement.

Earlier this week, LeBron James said, “Bronny’s his own man, and he has some tough decisions to make. When he’s ready to make those decisions he’ll let us all know, but as his family we’re going to support whatever he does.”

FOLLOW THE MADNESS: NCAA basketball bracket, scores, schedules, teams and more.

What is Bronny James’ NBA Draft projection?

Today, James is not a projected first-round pick in most NBA mock drafts. Before his sudden cardiac arrest, James’ improvement over his senior season of high school had him moving up mock draft boards and into the first round.

If he keeps his name in the draft, he will get a look from teams in the second round but it’s also possible he does not get selected, giving him the option of signing with the team of his choice as an undrafted free agent.

Where could Bronny James play college basketball next season?

Several schools recruited James when he was in high school, including Southern California, Memphis and Ohio State, all of which offered him a scholarship, according to 24/7.

LeBron James is a huge Ohio State fan and the family has attended several Buckeye football games, and when Ohio State removed the interim tag and made Jake Diebler the full-time head coach, LeBron posted on social media, “CONGRATS DIEBS!!!!” Diebler was involved in recruiting Bronny.

Also, LeBron’s close friend, Dru Joyce III just became the head coach at Duquesne. Joyce and James played high school basketball together, and James made the announcement last week that Joyce moved from associated head coach to head coach for the Dukes.

“As the unquestioned source I am confirming that Dru Joyce is the new HC at Duquesne University and is meeting with the team right now!’ James posted on X. ‘So damn happy and proud of you my brother!’

Oregon also recruited James.

When is the deadline to withdraw from the NBA Draft?

Players who want to keep their college eligibility must withdraw their name from the draft list by May 29, per NCAA rules.

This post appeared first on USA TODAY

FORT LAUDERDALE, Fla. — When will Lionel Messi play again? The wait is over, Messi fans.

With a social media post on Friday afternoon, Inter Miami confirmed Messi will return to action in Saturday’s home game against Colorado.

‘He’s back,’ Inter Miami posted with a photo of Messi on their social media accounts.

Messi has been day to day with a right hamstring injury, which has kept him out of action since March 13. He has missed four straight games, and five overall during the MLS season.

Friday’s announcement is unique for Inter Miami, promoting Messi will play in a match a day before, when he’s been recovering from injury. The club has typically steered clear from such announcements, outside of coaches’ comments updating his injury status or ruling him unavailable to play since Messi joined Inter Miami last summer. Usually, Messi’s availability has been left unannounced until starting lineups are released about an hour before games.

It’s unclear how much Messi will play against Colorado, but the match is an ideal opportunity for Messi to gauge his comeback attempt, especially with the stakes rising for Wednesday’s second leg in the Concacaf Champions Cup quarterfinal on the road against LIGA MX powerhouse Monterrey. Inter Miami trails Monterrey 2-1 in aggregate score.

“He’s getting better every day … We’re going day by day. We’re going to see how he feels today, and we’re going to make a decision,” Inter Miami coach Javier Morales told reporters before Friday’s practice, in which Messi participated.

“We’re going to do the best for him, that’s the most important thing.”

How to watch Inter Miami vs. Colorado live stream?

Inter Miami and Colorado kick off at 7:30 p.m. inside chase Stadium in Fort Lauderdale, Fla. The match can be live streamed via MLS Season Pass on Apple TV.

TICKETS: Experience Inter Miami in person at home vs. the Colorado Rapids

SHOP: Get the latest Messi and Inter Miami gear from the MLS Store

Monterrey reports Inter Miami dustup to Concacaf

Messi’s return could also be sparked by the fallout from Inter Miami’s 2-1 loss to Monterrey in the first leg of their quarterfinal matchup.

Messi and other members of Inter Miami caused a stir by confronting Monterrey coach Fernando Ortiz for his pregame comments, regarding favoritism for Messi and Inter Miami. Inter Miami has not commented on the matter, while Monterrey reported the confrontation to Concacaf after the game.

Inter Miami had six yellow cards during the match, including two to David Ruiz, who was ejected in the 66th minute, forcing Miami to finish the match with 10 players on the field. Monterrey – which finished with just three yellow cards – scored twice after Ruiz’s ejection.

“The truth is that the most important thing happened on the field, which is a Cup match. We know what those games represent, they are played with intensity, they are lived with a lot of pulsations, but the truth is that the most important thing happened inside the field,” Morales said.

“We play against a great rival. Unfortunately, when we were left with 10 players we could not maintain the result. But now, we have to go to Monterrey and try to do it in the best way to be able to move forward.”

Luis Suárez earns MLS player of the month for February and March

With five goals and three assists in eight MLS games, Luis Suárez on Friday has been named the MLS player of the month for February and March to start the season.

Suárez becomes the first player in Inter Miami history to be named MLS Player of the Month.

Will Luis Suárez, Jordi Alba and Sergio Busquets play against Colorado?

Along with Messi being in doubt, Inter Miami’s other former Barcelona stars could see limited action in Saturday’s match to prepare for the next Monterrey game.

“When you play Saturday, Wednesday, Saturday, Wednesday, and especially with players like them, it is a constant conversation to see how they feel and well, then together make a decision,” Morales said. “But the truth is that they are physically fine, so we’ll see.”

What is Inter Miami’s upcoming schedule? 

Expect Inter Miami to prioritize their Champions Cup matches, with Messi likely limited for MLS regular season matches in the next two weeks. 

∎Saturday: Inter Miami vs. Colorado Rapids, 7:30 p.m. ET

∎Wednesday: Inter Miami at Monterrey in Champions Cup, 10:30 p.m. ET

∎April 13: Inter Miami at Sporting Kansas City at Aarowhead Stadium, 8:30 p.m. ET 

∎April 20: Inter Miami vs. Nashville, 7:30 p.m. ET 

∎April 27: Inter Miami at New England, 7:30 p.m. ET

This post appeared first on USA TODAY