Archive

2024

Browsing

Sometimes, it helps to look at a stock like NVDA to get a pulse of the market.

NVDA’s stock price is up over 85% in 2024. It’s a leader in the AI ecosystem and the most talked-about stock. So what does the future hold for NVDA in terms of its stock price and the company at large? How much will competition from Alphabet, Inc. (GOOGL) and other AI chipmakers impact the stock’s price?

A Deep Dive Into NVDA’s Stock Price

Some investors may have feared rising competition for NVDA from competitors such as Alphabet (GOOGL), Intel (INTC), and other AI chipmakers. This led some investors to rush to sell the stock. As a result, NVDA’s stock price entered correction territory, which attracted investors to buy the dip.

Let’s examine the NVDA’s stock price chart closely to identify potential entry points or ways to invest.

If you look at a five-year weekly chart of NVDA stock below, it’s clear that the stock price has been rising from June 2019 until November 2021. For the most part, NVDA’s stock price remained above its 20-week simple moving average (SMA). When NVDA broke below this SMA, it found support at its 50-week SMA. Yet when the stock price broke below the 50-week SMA on April 11, 2022, the stock price corrected. It was in correction territory for about six months.

CHART 1. WEEKLY CHART OF NVDA STOCK. With a high StockCharts Technical Rank (SCTR) ranking and relative strength vs. the S&P 500, NVDA is a strong stock. It’s trending up and went through a minor correction.Chart source: StockChartsACP. For educational purposes.

After NVDA stock broke above the downward-sloping trending (dashed blue lines) in November 2022, it moved sideways for a couple of months. After the stock price broke above the 50-week SMA on January 23, 2023, the uptrend resumed, and the stock continued higher, notching new all-time highs.

Looking at NVDA’s stock price now, it’s far from its 20-week SMA. The stock has a StockCharts Technical Rank (SCTR) score of 98.2 (upper panel), which suggests that NVDA is still strong. NVDA’s relative strength compared to the S&P 500 ($SPX) is above 950% (lower chart panel). There’s no sign of weakness in NVDA.

Turning to the daily chart, NVDA stock hit a resistance level on March 25, 2024 (the previous high of March 8, 2024) and has moved lower since then. The stock price was trading within a downward-sloping channel (dashed black lines) and below its 20-day SMA. But it has broken above the downward sloping trending channel and is just above its 20-day SMA. The stock price bounced off the support of the retracement from its March high (lower horizontal line). Its next resistance is the high of March 25, 2024. If the stock price breaks above this resistance level, NVDA’s stock price could continue a bullish rally of hitting new all-time highs.

CHART 2. DAILY CHART OF NVDA STOCK. After hitting resistance, NVDA pulled back, with the price declining within a narrow downward-sloping price channel. The stock has now broken out of the channel and is trading slightly above its 20-day SMA.Chart source: StockChartsACP. For educational purposes.

NVDA’s stock price is strong even when the broader market may show slight signs of corrective behavior. So, despite hotter-than-expected CPI data and the possibility of fewer than three interest rate cuts in 2024, investors are still optimistic about the stock market.

Getting a Piece of NVDA

Looking at the underlying strength of the macroeconomic environment and assuming earnings season goes well, the stock market may continue its bullish trajectory. The stock could move sideways for a while before resuming its bullish trend. It all depends on investor sentiment. 

Another scenario that could play out is that NVDA could go through a correction similar to the one that started in April 2023. That would mean NVDA’s stock price would have to break below its 20-week SMA, now at around $686—a long way from where the stock is trading. It would take a lot for the stock to drop that low.

Since anything can happen in the stock market, it’s best to be prepared for any scenario. Either way, a pullback would be an excellent opportunity to buy the stock. NVDA’s stock price is around $900 per share, which could be costly, especially if you want to buy a substantial number of shares.

A couple of exchange-traded funds (ETFs) with significant NVDA exposure are the VanEck Semiconductor ETF (SMH) and the Grizzle Growth ETF (DARP). Another way to invest is in mutual funds with substantial exposure to NVDA. Fidelity Growth Company (FDGRX), Dunham Focused Large Cap Growth (DNFGX), and Baron Fifth Avenue Growth Retail (BFTHX) are a few to consider.

Think of what exposure to a stock like NVDA would do to your portfolio!

Disclaimer: This blog is for educational purposes only and should not be construed as financial advice. The ideas and strategies should never be used without first assessing your own personal and financial situation, or without consulting a financial professional.

A Sector Rotation Summary

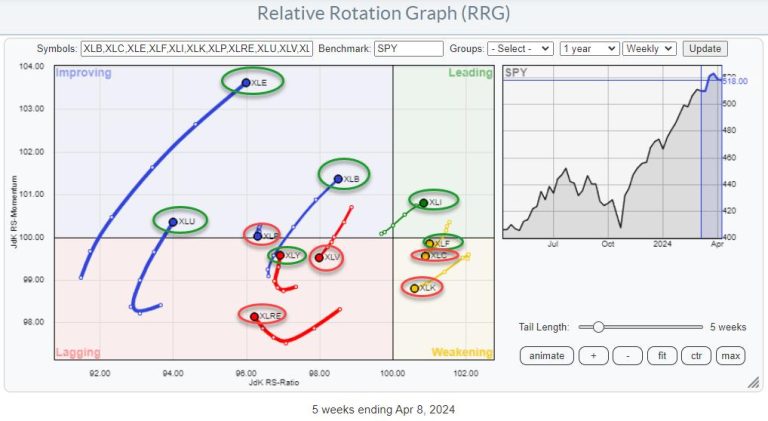
A quick assessment of current sector rotation on the weekly Relative Rotation Graph:

XLB: Still on a strong trajectory inside the improving quadrant and heading for leading. The upward break of overhead resistance on the price chart seems to be stalling at the moment, which could cause its relative strength compared to the S&P 500 to slow down. Overall, the trend, both in terms of price and relative, is still up.

XLC: Continues to lose relative strength and momentum inside the weakening quadrant and rotates toward lagging at a negative RRG-Heading. On the price chart, XLC is battling resistance, which causes its relative performance to slow down.

XLE: Is at the strongest rotation in this universe. Well inside the improving quadrant at the highest RS-Momentum reading and powered by the longest tail in the universe. The upward break in the price chart is holding up well, and the sector can even handle a small setback towards the former resistance area (just below ~95) without harming its uptrend.

XLF: Was on its way back to the leading quadrant after curling back up inside weakening, but this week’s dip is causing the tail to deviate from that path. This means we must watch this sector closely going into the close of this week and the beginning of next week to see if this is a temporary hiccup or a real change of direction. The nasty dip on the price chart pushes XLF back below its former resistance levels, which is usually not a strong sign. Caution!!

XLI: This is the only sector inside the leading quadrant at the moment, traveling at a strong RRG-Heading, taking the sector higher on both axes. The rally in the price chart is fully intact but seems to stall at current levels for three to four weeks. Plenty of room on the chart for a corrective move in this sector without damaging the uptrend.

XLK: The slow performance, primarily sideways, of the sector since the end of January has caused relative strength to flatten and for the sector to roll over and rotate into the weakening quadrant on the RRG. The jump today (Thursday, 4/11) caused an uptick in relative strength, but much more is needed to bring this sector back to the forefront.

XLP: Did not make it all the way up to horizontal resistance around 77.50 but set a lower high after a nasty reversal last week. The raw RS-Line continues steadily lower, causing the tail on the RRG to remain short and on the left-hand side of the graph, indicating a steady relative downtrend.

XLRE: After a rally at the end of last year, XLRE ended up in a sideways pattern that could turn out to be a double top after that rally. Such a top will be confirmed on a break below 37, which is the lowest low that was set in the week starting 2/12. When that happens, a decline all the way back to the late 2023 low becomes possible. The relative trend reversed back down after a very brief stint through the leading quadrant at the end of January.

XLU: Just moved into the improving quadrant from lagging but remains at a very low RS-Ratio level. The raw RS-Line continues to show a steady downtrend, making it hard for the tail to make it all the way to the leading quadrant. Price managed to break above a falling resistance line but shortly thereafter stalled in the area of Sept-23, Dec-23, and Jan-24 highs. Pressure remains in both price and relative terms.

XLV: After a short rotation through the improving quadrant that lasted roughly two months, XLV has now returned to the lagging quadrant and is pushing deeper into it on a negative RRG-Heading. On the price chart, XLV completed a (double) top formation and broke back below its former overhead resistance level, opening significant downside risk.

XLY: Is hesitating in a sideways pattern since mid-February, but still in a very shallow, uptrend. Relative strength continued to decline but is now nearing its late 2022 relative low, and the RRG-Lines are showing early signs of improvement.

Cap-weighted vs Equal-weighted

The RRG above shows the relative rotation of the relationships between the cap-weighted sector ETFs and their equal-weighted counterparts.

The more interesting information is coming from the tails that are far away from the benchmark. In this case, these are the Communication services sector, which is rolling over inside the leading quadrant, and Consumer Discretionary, which has just turned up inside the lagging quadrant.

This indicates that the large(er) cap communication services stocks are now starting to underperform the lower-tier market capitalizations. The opposite is true for Consumer Discretionary, where the opposite is happening, and larger market cap stocks are taking over from lower tier market caps.

A similar observation can be made for the Technology sector which is heading straight into the lagging quadrant, which suggests that large-cap tech is giving way to smaller names.

This information will be helpful when looking at RRGs for individual stocks inside the sectors.

#StayAlert: –Julius

S&P 500 earnings are in for 2023 Q4, and here is our valuation analysis.

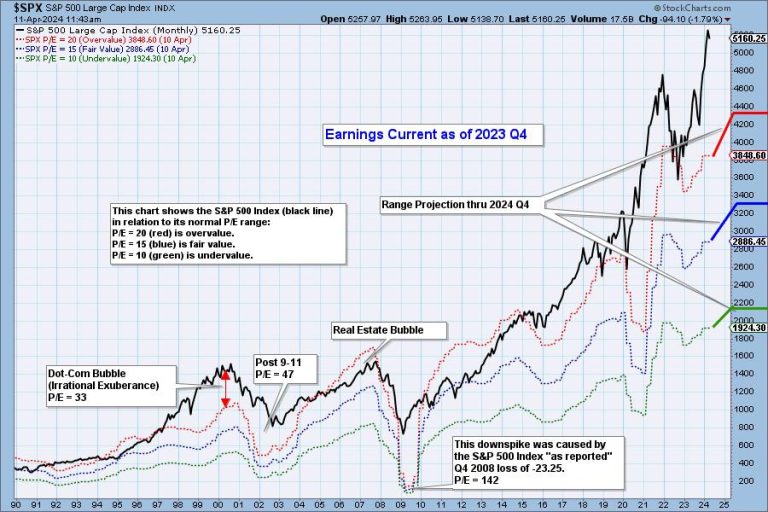
The following chart shows the normal value range of the S&P 500 Index, indicating where the S&P 500 would have to be in order to have an overvalued P/E of 20 (red line), a fairly valued P/E of 15 (blue line), or an undervalued P/E of 10 (green line). Annotations on the right side of the chart show where the range is projected to be based upon earnings estimates through 2024 Q4.

Historically, price has usually remained below the top of the normal value range (red line); however, since about 1998, it has not been uncommon for price to exceed normal overvalue levels, sometimes by a lot. The market has been mostly overvalued since 1992, and it has not been undervalued since 1984. We could say that this is the “new normal,” except that it isn’t normal by GAAP (Generally Accepted Accounting Principles) standards.

We use GAAP earnings as the basis for our analysis. The table below shows earnings projections through December 2024. Keep in mind that the P/E estimates are calculated based upon the S&P 500 close as of December 29, 2023. They will change daily depending on where the market goes from here. It is notable that the P/E is outside the normal range.

The following table shows where the bands are projected be, based upon earnings estimates through 2024 Q4.

This DecisionPoint chart keeps track of S&P 500 fundamentals, P/E and yield, and it is updated daily — not that you need to watch it that closely, but it is up-to-date when you need it.

CONCLUSION: The market is still very overvalued and the P/E is still above the normal range. Earnings have ticked up, are trending up, and are estimated to be higher through the end of this year. Being overvalued doesn’t require an immediate decline to bring valuation back within the normal range, but high valuation applies negative pressure to the market environment.

Watch the latest episode of DecisionPoint on StockCharts TV’s YouTube channel here!

(c) Copyright 2024 DecisionPoint.com

Technical Analysis is a windsock, not a crystal ball.

Disclaimer: This blog is for educational purposes only and should not be construed as financial advice. The ideas and strategies should never be used without first assessing your own personal and financial situation, or without consulting a financial professional. Any opinions expressed herein are solely those of the author, and do not in any way represent the views or opinions of any other person or entity.
DecisionPoint is not a registered investment advisor. Investment and trading decisions are solely your responsibility. DecisionPoint newsletters, blogs or website materials should NOT be interpreted as a recommendation or solicitation to buy or sell any security or to take any specific action.

Helpful DecisionPoint Links:

DecisionPoint Alert Chart List

DecisionPoint Golden Cross/Silver Cross Index Chart List

DecisionPoint Sector Chart List

DecisionPoint Chart Gallery

Trend Models

Price Momentum Oscillator (PMO)

On Balance Volume

Swenlin Trading Oscillators (STO-B and STO-V)

ITBM and ITVM

SCTR Ranking

Bear Market Rules

Shares of Trump Media have erased all their gains since they began trading under the ticker DJT last month.

The stock closed down more than 8% Monday at $37.17 after falling about 11% earlier in the day. It had traded above $79 a share on March 26, the day of its debut.

But experts say it’s hard to draw any firm conclusions about what the stock price’s movement means. That’s because so many available shares — about 12%, one of the highest ratios of any active stock listing — reflect traders’ bets that the stock will fall, said Ihor Dusaniwsky, managing director at S3 Partners, a data and predictive analytics company.

This is called short-selling.

Right now, much of the trading activity surrounding the stock reflects investors’ attempts to position bets around whether it will continue to fall, Dusaniwsky said in an email.

While some traders are looking to make even more gains from continued price declines, others may be looking to “squeeze” the short positions by betting that something will cause the share price to rise.

“This seems more like the gunfight at the OK Corral, with both sides waiting for the other to act first,” Dusaniwsky said.

As the stock’s price has rocked back-and-forth, former President Donald Trump, who owns a majority of the company’s shares, has seen his net worth move in tandem, falling from a high of about $5.2 billion down to about $2.9 billion.

But those figures are largely immaterial for Trump, since he is contractually barred from selling or even borrowing against his shares for six months.

In a post on Truth Social earlier this month, Trump called the company’s business ‘very solid’ and said criticisms of its ability to reach a wide audience were ‘lies.’

But according to company filings, Trump Media lost $58.2 million last year and did not report any user metrics.

Meanwhile, the company’s auditor issued a “going concern” notice for the business, saying it was not confident it would be able to stay afloat.

That auditor, BF Borgers CPA PC, has itself been the subject of recent reports about its effectiveness. For instance, it is banned in Canada.

In a news release last week, CEO Devin Nunes, a former U.S. congressman, said he was confident about the future of the business.

“We are excited to be operating as a public company and to have secured access to capital markets,’ Nunes said in a statement. ‘Closing out the 2023 financials related to the merger, Truth Social today has no debt and over $200 million in the bank, opening numerous possibilities for expanding and enhancing our platform.’

‘We intend to take full advantage of these opportunities to make Truth Social the quintessential free-speech platform for the American people,” Nunes said.

This post appeared first on NBC NEWS

Wednesday’s inflation report showed consumer price growth continues to drift higher.

The Bureau of Labor Statistics reported price growth accelerated to 3.5% in March, from 3.2% in February.

Few categories had as big a jump year on year than auto insurance, which soared 22% from March 2023, the most significant year-on-year jump in that category since 1976.

And over the last few years, average auto insurance rates have surged 43%.

As of April, the national average cost of car insurance is $2,314 per year for full coverage and $644 per year for the bare minimum, according to Bankrate.

That works out to about $193 a month for full coverage and $54 for minimum coverage.

A host of factors determine how much insurance companies charge drivers, but the cost of nearly all of them seem to be increasing.

One major factor is simply the rising cost of modern vehicles themselves. Today, a new vehicle costs about $10,000 more than it did before the pandemic. Blame supply-chain issues that drove up the cost of vehicle parts, increased labor costs and customer demand, which has naturally pushed prices upward.

The increasing sophistication of the technology in today’s vehicles also contributes to rising costs, said Robert Passmore, department vice president of personal lines at American Property Casualty Insurance Association. Cameras and sensors, which are used for various driver-assistance technologies, like emergency braking, automated parking and blind-spot monitoring, require parts that are more expensive to replace. They’re also subject to higher labor costs, Passmore said.

More complex and expensive repairs are also taking longer, and that shows up as higher vehicle costs, Passmore said. And worker shortages have resulted in higher pay for technicians.

Meanwhile, the higher cost of buying a vehicle has prompted some drivers to hold on to their existing cars for longer. As a vehicle ages, the likelihood of breakdowns rises, increasing the demand for repair services, said Sarah House, managing director and senior economist at Wells Fargo.

“Insurers are trying to recoup very costly claims,” House said.

Other factors are at work, too. According to the Insurance Information Institute, which represents insurance companies and the insurance industry, the severity of claims, including the medical and litigation costs that arise in claim disputes, are also on the rise.

In the years immediately after the outset of the Covid-19 pandemic, insurance companies took large losses — due in part to an increase in bad driver behaviors. As a result, they have pushed state regulators, who determine how high rates can go, to allow them to charge higher premiums while, in some cases, threatening to leave states entirely if they don’t. According to S&P Global Market Intelligence, those companies have been able to win huge rate increases as a result.

The bad news is there is no end in sight to the cost pressures.

Insurance companies filed for rate increases throughout the end of 2023 and at the start of this year, Bankrate analyst Shannon Martin said in an email. Because such rate changes hit auto policies only upon renewal, U.S. drivers are just starting to feel the impact, Martin said.  

“Car insurance inflation is sticky, and while inflation has slowed down and supply chain issues are improving, the premium increases we are seeing and will continue to see in 2024 are based on losses carriers experienced over the last few years,’ Martin said.

‘The ultimate goal is for rates in the insurance industry to stabilize, but that might not happen until sometime next year.”

This post appeared first on NBC NEWS

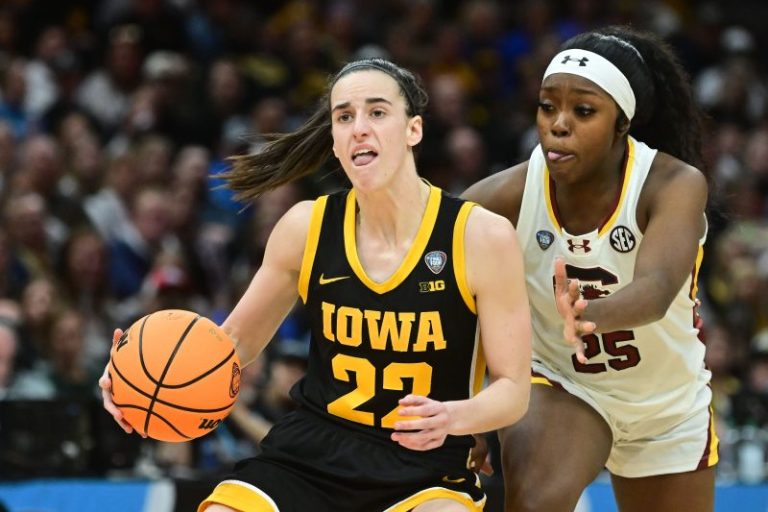
The WNBA released its broadcast schedule on Wednesday for the upcoming 2024 season, and for those who are looking to see former Iowa guard Caitlin Clark on television, she won’t be hard to find.

Unless the Indiana Fever surprises the whole world, they will select Clark, the NCAA’s all-time leading scorer, with the No. 1 overall pick during Monday’s draft. As a result, the team will have 36 of its 40 regular season games on linear television or streaming services.

The Fever will be featured eight times each on the Disney networks (ABC, ESPN and ESPN2), ION and twice more on CBS.

NBA TV will air 13 Fever games, with four more on Amazon Prime Video and one on CBS Sports Network.

The ABC/ESPN/ESPN2 doubleheader schedule starts on May 14, when the Fever takes on the Connecticut Sun at 7:30 p.m. ET. The nightcap will feature the two-time defending champion Las Vegas Aces taking on the Phoenix Mercury.

On the 18th, the Fever makes their first trip to New York to take on the WNBA MVP Breanna Stewart and the Liberty, who lost to the Aces in the Finals.

Indiana finished 13-27 last season and has missed the playoffs in each of the last eight seasons.

The WNBA All-Star Game is July 20. The WNBA season breaks for the Paris Summer Olympics and resumes on Aug. 15, when the Liberty take on the Los Angeles Sparks.

This post appeared first on USA TODAY

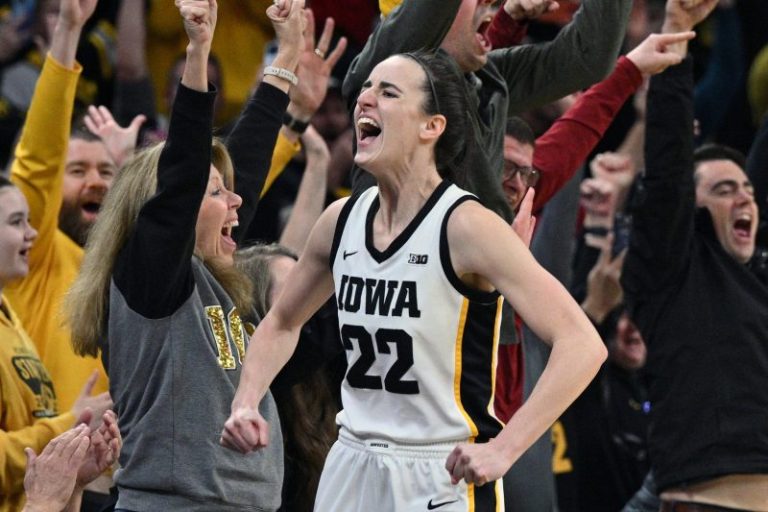
During Iowa’s end-of-season celebration ceremony on Wednesday, the university announced it will retire Clark’s No. 22 jersey. The announcement comes days after Clark’s illustrious, four-year collegiate career came to an end after the Hawkeyes fell short in the NCAA women’s national championship game against South Carolina.

‘There will never be another Caitlin Clark & there will never be another 22,’ Iowa wrote on X on Wednesday.

Clark said she’s ‘very thankful’ for the honor and took a moment to pay tribute to other Hawkeyes stars that wore No. 22 before her.

‘There’s been a lot of really good 22s to come before me and play for this program, whether it’s Kathleen Doyle or Sam Logic,’ said Clark, the all-time leading scorer in NCAA history. ‘That number holds a lot of weight, far beyond my name, and I guess I’m just really grateful and it will be a special day when it happens, for sure.’ 

FOLLOW THE MADNESS: NCAA women’s basketball scores, schedules, teams and more.

Clark’s jersey retirement marks the latest accolade for the star. She was named both the Naismith National Player of the Year and Wooden Award winner for the second consecutive season. She broke the women’s scoring record and all-time NCAA scoring record this year, breaking Pete Maravich’s 54-year-old record of 3,667 career points in her final regular season home game for the Hawkeyes.

‘It’s super incredible, something I’m very thankful for,’ Clark said. ‘Obviously I’ve had some amazing teammates the course of my four years here.’

Clark fell short of adding one last trophy to her collegiate resume. She was defeated in the national championship game for the second consecutive season. Clark had 30 points (10-28 FG, 5-13 3PT), eight rebounds and five assists in Iowa’s 87-75 loss to the undefeated South Carolina Gamecocks.

Clark, who declared for the WNBA Draft in late February, is presumed to be the No. 1 pick for the Indiana Fever.

This post appeared first on USA TODAY

NBA commissioner Adam Silver on Wednesday called player involvement in wagers related to the NBA a cardinal sin and said banishment from the game is on the table if it’s discovered a player intentionally influenced the outcome based on a wager.

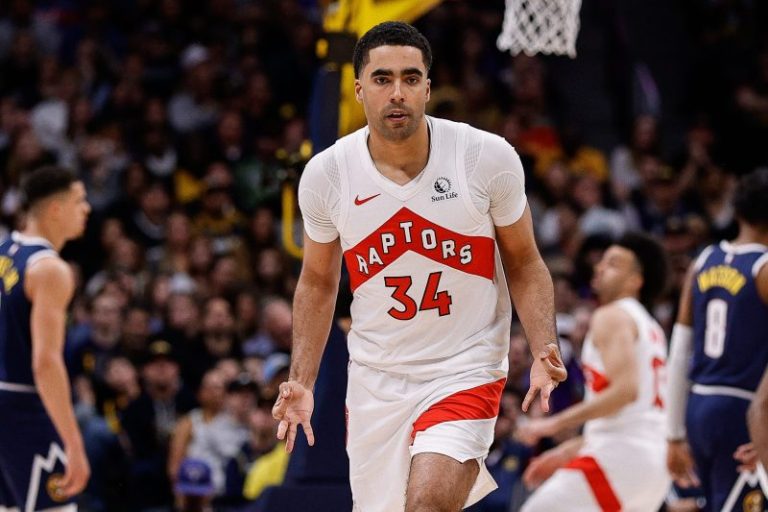
Toronto Raptors forward Jontay Porter is under investigation by the league surrounding over-under wagers involving Porter.

Porter, the younger brother of Denver Nuggets forward Michael Porter Jr., has not played since March 22, three days before an ESPN story detailed gambling irregularities involving games in which Porter played.

“It’s cardinal sin what he’s accused of in the NBA and the ultimate extreme option I have is to ban him from the game,” Silver said after the NBA owners meetings in New York. “That’s the level of authority I have here because there’s nothing more serious around this league when it comes to gambling and betting on our games – and that is a direct player involvement. And so the investigation is ongoing, but the consequences could be very severe.”

On Jan. 26 against the Los Angeles Clippers the over/under on Porter’s props were about 5.5 points, 4.5 rebounds and 1.5 assists and the over/under on his made 3-pointers was .5. Porter played just four minutes, did not take a shot and finished with zero points, three rebounds and one assist.  He played just four minutes, leaving the game with an eye injury he sustained in a game against Memphis on Jan. 22.

DraftKings Sportsbook reported that the under on Porter’s made 3-pointers was the biggest money on players props from the NBA that day, according to ESPN.

In a March 20 game against Sacramento, Porter left the game after just three minutes due to illness, according to the Raptors. He took one shot, did not score and had two rebounds, one block and one steal. The over/under on his player props in that game, according to ESPN was about 7.5 points and 5.5 rebounds.

Porter averages 4.4 points, 3.2 rebounds and 2.3 assists in 26 games with the Raptors this season. Porter signed a two-way contract with Toronto on Dec. 9.

NBA players are not allowed to wager on NBA games. Punishment if found culpable, according to the collective bargaining agreement between the NBA and National Basketball Players Association (NBPA, players union), is at the discretion of the NBA commissioner and “may include a fine, suspension, expulsion, and/or perpetual disqualification from further association with the Association or any of its Members.”

NBA teams and leagues monitor sports betting for potential problems.

“To the extent it’s going to exist, if you have a regulated environment, you’re going to have a better chance of detecting it than you would if all the bets were placed illegally,” Silver said.

This post appeared first on USA TODAY

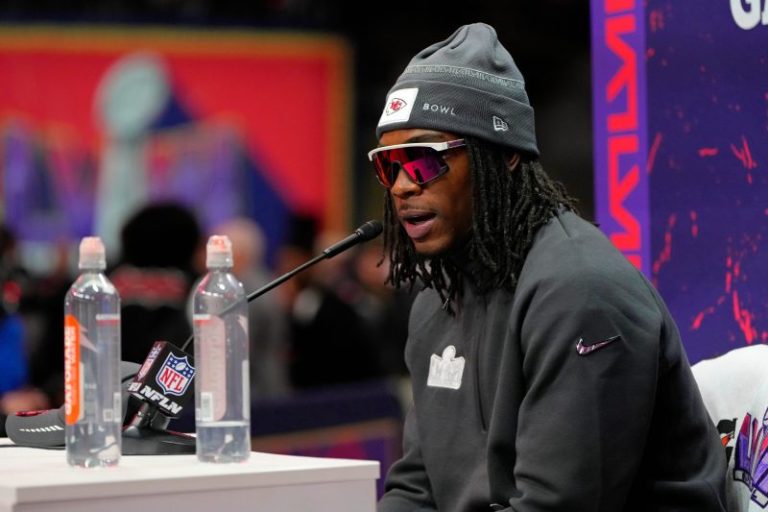
Kansas City Chiefs wide receiver Rashee Rice was indicted Wednesday for causing a multi-car crash in Dallas that sent two people to the hospital.

Dallas Police formally issued an arrest warrant for Rice, who faces one count of aggravated assault, one count of collision involving serious bodily injury and six counts of collision involving injury following the accident in north Dallas on March 30, the department announced on Wednesday. 

An investigation conducted by Dallas Police determined that Rice, who was driving a Lamborghini, and Theodore Knox, who was driving a Corvette, were ‘speeding in the far-left lane’ of North Central Expressway before the drivers lost control and caused a “chain reaction collision involving four other vehicles.’

An arrest warrant was also issued for Knox, who faces the same charges as Rice. Both Rice, 23, and Knox, 21, are not in custody, Dallas Police added. The other passengers in both vehicles will not face charges.

In a statement to USA TODAY Sports, NFL spokesperson Brain McCarthy confirmed that the league will ‘continue to monitor all developments in the matter.’

NFL DRAFT HUB: Latest NFL Draft mock drafts, news, live picks, grades and analysis.

According to a summary of the accident sent to USA TODAY Sports by Dallas Police Department spokeswoman Kristin Lowman, the Lamborghini veered onto the shoulder after losing control and hit the center median wall. Police said the drivers and occupants from both the Corvette and Lamborghini ‘all ran from the scene without stopping to determine if anyone needed medical help or providing their information.’

Two drivers were treated on the scene for minor injuries, while two passengers from a different car were taken to a local hospital, also for minor injuries.

A man who was driving the Expressway on March 30 sent his dash-cam video to the Dallas Morning News last month, confirming the police account of the accident.

In the clip, the Corvette and Lamborghini appear to speed past on the left side before the Lamborghini appears to swipe a white Hyundai Accent. The Corvette collides with a van, which spins around. Three people appear to exit the Lamborghini and walk away.

‘He’s a young man that made a mistake,’ West said in a news conference last week, adding that Rice accepted responsibility for his role in the incident and would take steps to assist those who were injured.

Rice was born in Philadelphia, but is from North Richland Hills, a suburb west of Dallas. Rice played football at Richland High School and then played collegiately at Southern Methodist University, which is located about a mile from the site of the car crash.

Rice was a rookie in 2023 for Kansas City and caught 79 passes for 938 yards and seven touchdowns, and became an important offensive piece as the Chiefs went on their run to a Super Bowl victory. Rice’s regular season totals for receptions and yards ranked second on the team, behind only tight end Travis Kelce, and his receiving touchdowns total led the team.

This post appeared first on USA TODAY

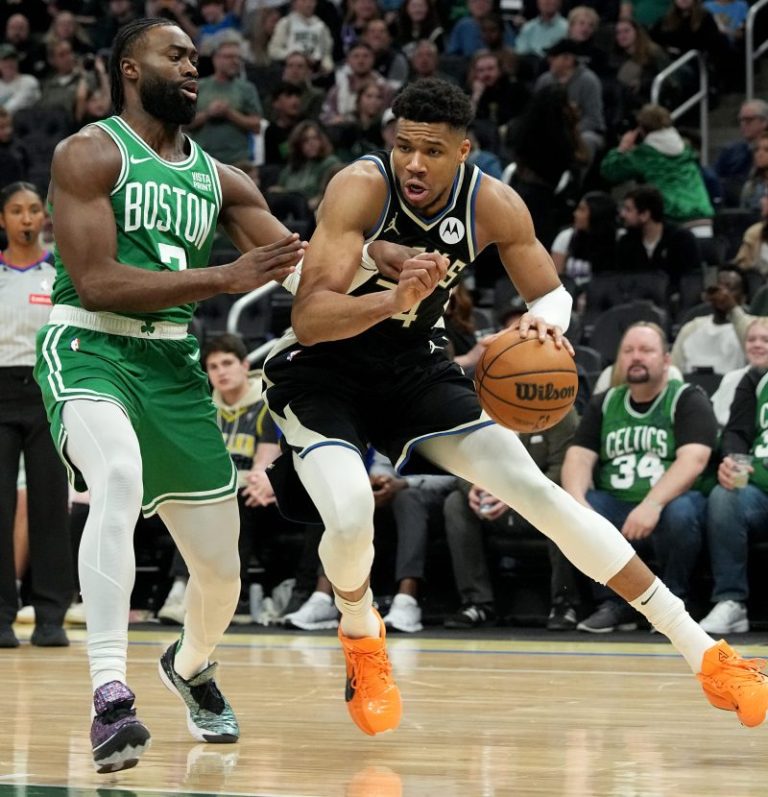
Giannis Antetokounmpo exited Tuesday night’s game against the Boston Celtics with a strain of the left soleus muscle, which is one of two muscles that make up the calf in the lower leg.

It was a scary-looking injury for the 29-year-old, as he fell to the court suddenly and without contact with just under four minutes remaining in the third quarter. Antetokounmpo couldn’t get up immediately without assistance, and once to his feet appeared unsteady. But he eventually walked off the court unassisted.

‘Antetokounmpo underwent an MRI last night that confirmed the diagnosis of a left soleus (calf) strain,’ the team said in a statement on Wednesday. ‘He will miss the remaining three games of the regular season and receive daily treatment and evaluation.’

Teammate Damian Lillard, who suffered a soleus injury in his right calf last season, said after the game it was a very painful injury to suffer. The point guard was injured on Nov. 20, 2022, and returned that Dec. 4.

What is the soleus muscle?

The calf is made up of two muscles, the soleus and the gastrocnemius. The Cleveland Clinic defined the soleus as a wide, flat muscle that ‘starts just below your knee, runs down your lower leg and connects to your Achilles tendon above your heel. Soleus injuries are less common because the muscle only crosses your ankle joint.’

All things Bucks: Latest Milwaukee Bucks news, schedule, roster, stats, injury updates and more.

What is the recovery time for a soleus strain?

A return to play depends on how severe the strain is and how the individual heals. The Bucks will not begin the playoffs until April 20 or 21, which would be a little less than two weeks from the original injury.

What is Giannis Antetokounmpo’s history of leg injuries?

Antetokounmpo severely injured his left knee during Game 4 of the Eastern Conference finals on June 29, 2021. Originally called a hyperextension, Antetokounmpo returned to play Game 1 of the NBA Finals on July 6.

He underwent surgery on that knee in June last year and was ready for training camp.

The two-time league MVP has managed injury and soreness in his knees for years, but this season he’s also been listed on the injury report with left ankle soreness, tendinitis in his left Achilles and tendinopathy (pain and/or swelling) in his left hamstring.

He has been playing through that issue since March 10, and it had caused him to miss three games. He initially was questionable to play against the Celtics because of the discomfort in his left hamstring.

This post appeared first on USA TODAY