Archive

2024

Browsing

The Democratic National Committee (DNC) covered legal fees for President Biden during the special counsel probe into his possession of classified documents, while his campaign slammed the Republican National Committee for paying former President Trump’s legal bills for his various criminal indictments. 

The DNC paid former President Obama lawyer Bob Bauer, who is also married to senior White House adviser Anita Dunn, for ‘legal services’ after it was revealed the attorney had been tapped to handle the president’s classified documents scandal. 

Over $1.05 million was doled out to Bauer and other lawyers representing Biden during special counsel Robert Hur’s investigation, with payments being made from July 2023 to February 2024, according to Axios, which first reported the story.

DNC spokesman Alex Floyd told Fox News Digital in a statement, ‘There is no comparison – the DNC does not spend a single penny of grassroots donors’ money on legal bills, unlike Donald Trump, who actively solicits legal fees from his supporters and has drawn down every bank account he can get his hands on like a personal piggy bank.’

News of the DNC’s payments to Biden’s lawyers in the Hur investigation comes as the president’s campaign has hit Trump for using donor money to pay off his legal debts. 

Biden’s campaign recently slammed Trump over a ‘lack of funding,’ questioning if it is good strategy to reach out to ‘donors to help cover your own personal debts instead of funding your campaign.’

Last week, Biden’s campaign manager, Julie Chavez Rodriguez, said Biden’s fundraising was in ‘stark contrast to Trump’s cash-strapped operation that is funneling the limited and billionaire-reliant funds it has to pay off his various legal fees.’

Fox News Digital did not immediately receive comments from the Biden campaign or the White House Counsel’s office.

‘Joe Biden and the Democrats’ entire campaign against President Trump is based upon lies and hypocrisy — they have repeatedly stated they don’t spend money on Biden’s legal bills, while they attack President Trump for having to defend himself from Biden’s witch hunts,’ the Trump campaign said in a statement. ‘Come to find out, the DNC paid millions to cover Biden’s legal bills to a law firm run by the husband of top White House staffer Anita Dunn. Apparently, ’10% for the big guy’ from Hunter wasn’t enough for Crooked Joe to foot his own bill.’

As the DNC’s Floyd noted, Trump’s various committees have spent tens of millions on covering legal bills for the former president, and they have further solicited donations by citing the criminal cases he is involved in. Conversely, Biden’s campaign has not used the legal matter involving the president to prompt supporters to donate. 

This post appeared first on FOX NEWS

A bill to renew a key federal government surveillance tool, known as Section 702 of the Foreign Intelligence Surveillance Act (FISA), passed the House of Representatives on Friday, about a week before it is set to expire.

However, House Freedom Caucus conservatives and their allies have blocked the bill from heading to the Senate. In the dramatic moments after its passage, Rep. Anna Paulina Luna, R-Fla., raised a procedural measure objecting to the final vote count, which was then countered by the bill’s sponsor, Rep. Laurel Lee, R-Fla., and House Intelligence Committee Chairman Mike Turner, R-Ohio.

Now, the House must vote on whether to reconsider passage of Section 702 on Monday, shortening the Senate’s timeline to consider the bill before its expiry on April 19.

A modified version of the original bill passed a procedural hurdle late on Thursday after a group of 19 conservative privacy hawks sunk the House GOP’s chance at passing it earlier this week.

The legislation is aimed at reforming Section 702 of the Foreign Intelligence Surveillance Act (FISA), which allows the government to surveil foreigners abroad with suspected terror links without a warrant. Section 702 allows the FBI to collect communications of a narrow list of foreign targets, even if the person at the other end of the suspect’s communications is an American. 

The battle over its renewal has put Johnson in a tough spot between privacy and national security hawks within his conference, while he also navigates a razor-thin majority of just two seats.

National security hawks and members of the intelligence community have called it a critical tool for preventing another 9/11-style attack. However, critics, including both conservatives and progressives, have been seeking to limit its scope after reported instances of abuse by FBI agents to query data on Americans that already existed in the Section 702 database.

To do that, the House Judiciary Committee backed an amendment that would have required a warrant to query Americans’ data that was collected in the Section 702 system. Opponents of the measure have said it would critically hamper the intelligence community’s ability to quickly detect major threats and equated it to forcing police to get a warrant before running a license plate during a traffic stop.

It was tense in the House chamber on Friday when that amendment, which ultimately failed to pass in a 212 to 212 vote, was being considered. Johnson cast a critical and potentially decisive vote against the amendment, though a spokesperson for the speaker told Fox News Digital that he voted early on during the 25-minute window.

An unusual political scene unfurled as members of the ultra-conservative House Freedom Caucus cheered for progressive ‘Squad’ members voting in favor of the amendment.

After the vote, those same conservatives criticized Johnson for his opposition to the amendment both online and in comments to the press.

‘We’re very disappointed that when we sent Mike Johnson away from the Judiciary Committee, he departed from some of the views that he held deeply and views that, frankly, he was more eloquent in expressing than even I was,’ Rep. Matt Gaetz, R-Fla., told reporters.

The Reforming Intelligence and Securing America (RISA) Act is a compromise effort between the House Judiciary and Intelligence committees aimed at narrowing who can access communications collected, and making it a crime to misuse that data.

However, the conservatives who voted to tank the bill on Wednesday said it did not go far enough to protect Americans’ data. Many were also angry at the exclusion of an amendment by Rep. Warren Davidson, R-Ohio, that would have forced the federal government to seek a warrant before buying Americans’ data from third parties. 

Opponents of the amendment argued it did not have to do with Section 702 and would have sunk the bill’s chances of passing in the Senate.

They were also backed by former President Trump, who pushed back on the RISA bill on Wednesday morning, declaring on Truth Social, ‘KILL FISA.’

House GOP leaders assuaged conservatives’ concerns by promising a standalone vote on Davidson’s amendment, though the timing of that is still unclear.

The modified legislation also shrinks the Section 702 reauthorization window from five years to two years. 

It would give the opportunity for the next administration, likely a Trump or Biden White House, to reform the tool early in the next presidential term.

This post appeared first on FOX NEWS

In this episode of StockCharts TV‘s The MEM Edge, Mary Ellen shares key signals that it’s time to sell a stock, using INTC as an example. She also reviews a key area of support for the markets, and new sectors that have entered a downtrend. She finishes up by showing how to compose a watchlist of names that can be bought once market pressures recede.

This video originally premiered April 12, 2024. Click here or on the above image to watch on our dedicated MEM Edge page on StockCharts TV.

New episodes of The MEM Edge premiere weekly on Fridays. You can view all previously recorded episodes at this link.

If you’re looking for stocks to invest in, be sure to check out the MEM Edge Report! This report gives you detailed information on the top sectors, industries and stocks so you can make informed investment decisions.

Staying on top of your portfolio in a fast-moving market can be a challenge. On this week’s edition of StockCharts TV‘s StockCharts in Focus, Grayson shows you how to make things easier on yourself with automated ChartList Reports for your portfolio. You’ll learn how to create a list full of the stocks, ETFs, and other securities you own, then turn on end-of-day or end-of-week performance reports that get sent to you automatically after the close. This is one of the simplest ways to improve your market monitoring and investing decisions no matter where you are or what pulls your attention away from the markets.

This video originally premiered on April 12, 2024. Click on the above image to watch on our dedicated StockCharts in Focus page on StockCharts TV.

You can view all previously recorded episodes of StockCharts in Focus at this link.

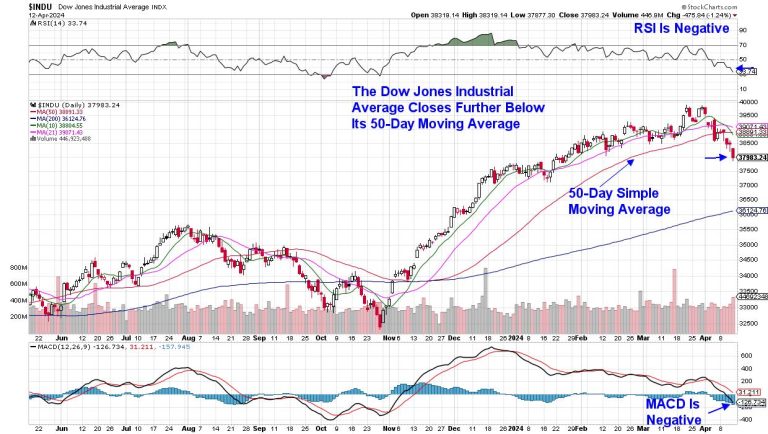
The Dow Jones Industrial Average fell 2.4% last week in a move that pushes this index further below its key 50-day simple moving average. While not the most widely followed index, the Dow has continued to evolve so that its 30 components more closely represent the current economy. Amazon’s (AMZN) inclusion at the end of February is the latest modification, where it joins Apple (AAPL), Microsoft (MSFT), and Salesforce (CRM) to name just a few of the heavier-weighted names.

Daily Chart of Dow Jones Industrial Average

Leading this index lower last week was a 7.4% decline in J.P. Morgan Chase (JPM), which fell following the release of their first quarter earnings on Friday. While the company’s results were strong, CEO Dimon’s tepid outlook for growth going forward pushed the stock lower. Among the risks cited by management were high inflation and the potential for the Federal Reserve to tighten monetary policy. Geopolitical risks were also mentioned.

Most notable on JPM’s chart, however, was the fact that it was trading at a new high in price prior to the release of their report.  In other words, the stock was priced for perfection, such that any hint of a possible slowing of growth pushed the stock sharply lower.

Currently, we are at the very beginning of earnings season and, should we see a similar reaction to well-known companies reporting results while their stock is priced at a near-term high, we could be in for some tough sledding. Netflix (NFLX) is the next well-known company due to report next week, followed by Microsoft (MSFT), Alphabet (GOOGL), and Meta Platforms (META) the following week. Each of these stocks are trading at near-term highs and are susceptible to weakness amid any talk of a rise in interest rates.

Comparative Chart of Dow, S&P 500 and NASDAQ – June 2023-Current

Above is a comparative chart of the Dow Jones Industrial Average versus the S&P 500 and the NASDAQ Composite. As highlighted, the Dow led the markets into a new uptrend, which began in early November. More recently, many of those winning stocks from the Dow are now in downtrends, after closing below their key 50-day simple moving average.

These winners were from a broad cross-section of sectors, such as Industrials, Financials, and Consumer Discretionary, and include Home Depot (HD) and J.P. Morgan (JPM), to name just two. My screening showed the weakness that had been spreading in these sectors, as I removed several Retailers from my MEM Edge Report Suggested Holdings List over the past several weeks and took off Bank stocks earlier this week. The deterioration among these Discretionary, Financial, and Healthcare stocks from the Nasdaq and the S&P 500 may be harder to spot, given the large number of names in their index; however, my MEM Edge Report has been detailing the weakness for weeks now.

Most important at this time is the fact that both the Nasdaq and S&P 500 are hovering above key support, and you’ll want to preserve profits should we see a downtrend develop. While interest rates are a key determinant of investor sentiment, earnings reports have been proven to be more impactful. If you’d like to be kept up to date on the condition of the broader markets, as well as how to handle stocks depending on your investment horizon, use this link here to access my twice weekly report for 4 weeks for a nominal fee.

Warmly,

Mary Ellen McGonagle

MEM Investment Research

Toward the bottom of my Mindful Investor LIVE ChartList, there is a series of charts that rarely generate signals. So why would I include things like the Hindenburg Omen and Coppock Curve, which are usually a nonfactor during my regular chart review, in my main list of macro charts? Because I’ve learned that when these rare signals do actually occur, it’s best to pay attention!

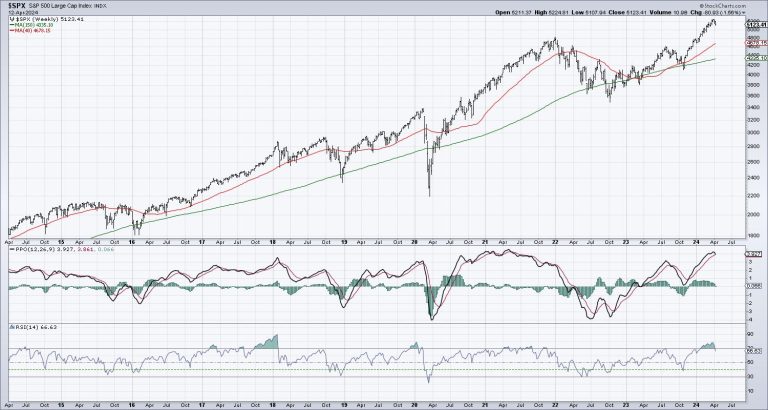
As I checked in on the markets this week during Spring Break, I noticed that the weekly S&P 500 chart showed that the RSI had just broken down out of the overbought region. And while the weekly PPO has not yet registered a sell signal, it finished the week by almost doing so.

At major market tops, you’ll usually see overbought conditions leading into peak, as prices move aggressively higher in the later stages of the bull market. The weekly RSI (bottom panel) pushed above the 70 level in mid-January, and has remained above that threshold until this week.

The weekly PPO is an adaptation of Gerald Appel’s fantastic MACD indicator, which uses a series of exponential moving averages to identify the primary trend and indicate trend reversals. If we would get a confirmed sell signal next week, with the PPO line crossing down through the signal line, that would be the first signal since the market peak in August 2023.

Let’s bring in some additional price history to consider how often this dual sell signal has triggered, and what has usually followed this bearish confirmation.

This pattern has occurred ten times since the 2009 market bottom, with five of those signals resulting in some of the most meaningful drawdowns of the last 15 years. The other five times ended up being fairly brief pullbacks within a longer-term uptrend.

How can we differentiate the winning signals from the less successful indications? Well, the winning signals were followed soon after by a break of the 40-week moving average, used on the weekly chart to emulate the 200-day moving average from the daily chart.

During the false sell signals, we never saw a confirmed break below the 40-week moving average, as buyers seemed to come in to buy on weakness and push prices back higher. Looking forward to the coming weeks, that would mean that an S&P 500 below 4680 or so would indicate a high likelihood of much further downside for stocks.

It also tells me to focus in on other macro technical indicators, using breadth indicators and the daily S&P 500 chart to further validate the short-term price momentum.

S&P 5050 remains a key short-term support level, as this served as a key pivot point in February and March. As the SPX has begun an apparent rotation down to this support level, it’s worth noting that the daily RSI is now below 50. The percent of stocks above the 50-day moving average is now below 50%, and the McClellan Oscillator is well below the zero level.

All of these short-term signals speak of a market in a corrective phase. If and when the S&P 500 would break below its 200-day moving average (less than 500 points away after Friday’s close!), that would mean the short-term deterioration has fueled enough of a breakdown to trigger our weekly sell signals.

In either case, I’ve seen enough after this week’s overheated inflation numbers to consider a much stronger downdraft as we enter the meat of earnings season. Whatever you think may come next for the S&P 500 and Nasdaq 100, now could be a perfect time to make sure you have a good exit strategy in mind!

RR#6,

Dave

P.S. Ready to upgrade your investment process? Check out my free behavioral investing course!

David Keller, CMT

Chief Market Strategist

StockCharts.com

Disclaimer: This blog is for educational purposes only and should not be construed as financial advice. The ideas and strategies should never be used without first assessing your own personal and financial situation, or without consulting a financial professional.

The author does not have a position in mentioned securities at the time of publication. Any opinions expressed herein are solely those of the author and do not in any way represent the views or opinions of any other person or entity.

Trends often start with outsized moves. But how do we measure and identify such moves? Chartists can measure moves in Average True Range (ATR) terms using the ATR Trailing Stop SAR indicator (ATR-SAR). ATR is a volatility indicator developed by Welles Wilder. For example, a 4 ATR advance off a low would signal an outsized move that could jumpstart an uptrend. Conversely, a 4 ATR decline off a high would signal an outsized move that could jump-start a downtrend or corrective period. Today’s report will highlight the outsized decline in the Home Construction ETF (ITB) and show this indicator for the Semiconductor ETF (SOXX).

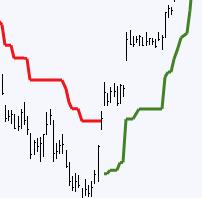
ATR-SAR is the bull/bear version of the ATR Trailing Stop, both of which are part of the TIP Indicator Edge Plugin for StockCharts ACP. SAR stands for “stop and reverse”, which means the line switches sides with price breaks. When prices are rising, ATR-SAR is green and under the price. It acts as a trailing stop for a long position or an uptrend marker. When prices are falling, ATR-SAR is red and above price. It then acts as a stop for shorts or a downtrend marker. Let’s look at an example using 22 periods for the Average True Range and 4 for the multiplier.

The chart above shows the Home Construction ETF (ITB) with ATR-SAR (22,4). It turned green in November as ITB surged and broke out with an outsized advance. The ATR-SAR line turned green and remained 4 ATR(22) values below the highest close as prices rose. ITB fell sharply this week and broke the ATR-SAR line. This signals an outsized decline that could jump-start a downtrend or correction.

Outsized declines can jump-start downtrends and outsized advances can jump-start uptrends. Notice that ITB held this ATR-SAR line from early November to early April. Declines during this period were less than 4 x ATR(22) values. The April decline broke this ATR-SAR line, meaning the decline was MORE than 4 x ATR(22) values. In other words, it was an outsized decline. Also notice that an outsized advance in early November jump-started the uptrend.  

Elsewhere, the EW Consumer Discretionary ETF (RSPD) and the Retail SPDR (XRT) also fell sharply and broke their ATR-SAR (22,4) lines. These were highlighted in Thursday’s report and video at TrendInvestorPro. This means three economically sensitive groups reversed their uptrends this month (consumer discretionary, housing and retail). Elsewhere note that the Software ETF (IGV), Cybersecurity ETF (CIBR) and Cloud Computing ETF (SKYY) broke their ATR-SAR lines on February 21st. The Technology SPDR (XLK), Mobile Payments ETF (IPAY) and Semiconductor ETF (SOXX) have yet to break their ATR-SAR lines. The chart above shows SOXX holding up better than ITB.

TrendInvestorPro offers two services. First, System Trader provides fully quantified momentum strategies for trading Nasdaq 100 and S&P 500 stocks. These strategies are designed to identify leading stocks and hold them as long as they lead. Second, Chart Trader reports and videos focus on stocks and ETFs with uptrends and tradeable patterns. Each week we cover the overall market environment and then feature highly curated trading ideas. Click here to learn more and get immediate access.

//////////////////////////////////////////////////

Now that earnings season has begun, what can you expect the stock market to do, especially after its stellar Q1 run? Well, after a few months singing the monotone “up, up, up” tune, the stock market has mixed things up a little. Now you hear “up, down, up, down.”

Why the Change?

A hotter-than-expected CPI number sent the stock market into a selling frenzy, but the PPI, which came in slightly lower than estimates, reversed things slightly. However, the selling pressure returned on Friday, with the broader indexes closing lower.

Earnings season kicked off with JPMorgan Chase (JPM), Wells Fargo (WFC), and Citigroup (C) beating estimates. Yet their share prices fell, mainly due to lower-than-expected interest income. The CEO of JPMorgan Chase, Jamie Dimon, made comments concerning inflation further worried investors. In addition, the elevated concerns of geopolitical tensions made investors jittery, resulting in the selloff the stock market witnessed this week. The CBOE Volatility Index ($VIX), considered a fear gauge, spiked above 18 during the trading day, but closed at a lower level.

Dow Jones Industrial Average Analysis

The daily chart of the Dow Jones Industrial Average ($INDU) below shows the index retreating after hitting a high in April, at around the same level as the high in March. This reversal happened relatively quickly. In this scenario, it helps to sit back, analyze the chart, and add your lines in the sand.

CHART 1. DAILY CHART OF THE DOW JONES INDUSTRIAL AVERAGE. After hitting a high, the index pulled back, fell below its 50-day simple moving average (SMA), and is now close to its 100-day SMA.Chart source: StockCharts.com. For educational purposes.

First, look for stand-out support levels—previous highs, price gaps, and lows. In the above chart, it’s clear the series of higher highs was broken, and the index now displays lower highs.

After breaking below its February low, the next support level would be the late December high (red-dashed line). Similarly, you can identify various support levels and draw them in your chart (red dashed line at around 35,600). 

Another way to identify support and resistance is to add Fibonacci retracement levels. In the daily chart of $INDU, Fibonacci retracement levels were drawn from the October low to the March/April high. 

How do you add trendlines in StockCharts? 

Select the Annotate button > Line tools icon > Trendline.Watch this tutorial!

How do you add Fibonacci retracement levels in StockCharts?

Select the Annotate button > Line Study icon > Fibonacci Retracement

Moving averages help identify the overall trend. In the daily chart of $INDU, the index is below its 50-day simple moving average (SMA) and is trying to hold on to the support of its 100-day SMA. The S&P 500 is at its 50-day SMA.

A Longer-Term Perspective

The weekly Dow Jones chart gives a big-picture view of the index (see chart below). While the Dow is still above its 50-week SMA, the last two weeks have seen a significant selloff. But it’s less than a 5% correction. Next week should be interesting, with the S&P 500 and Dow Jones at critical support levels at the end of this trading week. The market has gone through some minor dips lately, but, if the indexes fall below significant support levels, the correction could be extended.

CHART 2. WEEKLY CHART OF DOW JONES INDUSTRIAL AVERAGE. The index is below its 50-week SMA. Will it fall to its next support level?Chart source: StockCharts.com. For educational purposes.

While stocks have been selling off, commodities have risen since March, with gold hitting all-time highs and silver hitting a 52-week high. Energy prices have been rising, and the US dollar is edging higher. It’s too early to tell if investor sentiment is shifting, but it’s something to monitor closely.

What This Means For Your Investment Portfolio

A 5–10% correction isn’t something you should panic about. The stock market is overextended, and a pullback is long overdue. At times like this, you need to watch the market regularly.

A few actions you can take are as follows:

Add potential support levels to your charts and monitor them closely.Watch the S&P sectors and look to see which sectors are leading and lagging. Our Chief Market Strategist, David Keller, CMT, covers this in his show The Final Bar.Monitor price action in the commodity markets—gold, silver, and crude oil.

End-of-Week Wrap-Up

S&P 500 closes down 1.46% at 5,123.41, Dow Jones Industrial Average down 1.24% at 37,983; Nasdaq Composite down 1.62% at 16,175.09$VIX up 16.10% at 17.31Best performing sector for the week: TechnologyWorst performing sector for the week: FinancialTop 5 Large Cap SCTR stocks: MicroStrategy Inc. (MSTR); Coinbase Global Inc. (COIN); Super Micro Computer, Inc. (SMCI); Vistra Energy Corp. (VST); Vertiv Holdings (VRT)

On the Radar Next Week

March Industrial ProductionMarch Manufacturing ProductionMore Fed speeches Earnings from Goldman Sachs (GS), Bank of America (BAC), Morgan Stanley (MS), United Airlines (UAL), and Schlumberger (SLB)

Disclaimer: This blog is for educational purposes only and should not be construed as financial advice. The ideas and strategies should never be used without first assessing your own personal and financial situation, or without consulting a financial professional.

The strange thing about gold is that it’s always a relic… until it isn’t. And when it isn’t, everyone swears it’s always been an alternative currency (why would anyone have thought it was a relic in the first place?).

It’s a relic or “sound money” reckoning, as the yellow metal’s surge—notching a record-high of $2395.60—stunned non-believing investors and even die-hard gold bugs. Here’s the thing: some analysts are saying this record high is not the top, but rather the bottom range.

Why are Some Analysts Claiming Gold Can Reach $3,000?

$3,000 an ounce is 25% higher than the current price, and a 64% rally from its last significant low in October 2023. But what would drive gold to such heights?

Fiat currencies under pressure; financial repression (as BofA noted back in 2020)?Stubborn inflation; massive government debt (says European financial engineering firm, Mind Money)?BRICS de-dollarization efforts; new gold-backed currencies being issued across the globe—all aimed at challenging the US dollar’s unipolar position?

Let’s take a look at the gold’s macro price action.

CHART 1. MONTHLY CHART OF $GOLD. Note its series of sideways fits and start leading up to its current parabolic rise.Chart source: StockCharts.com. For educational purposes only.

Here’s gold’s trajectory starting with its 2016 low. Most of the time, the yellow metal traded within a fairly wide range between uptrends.

Note the Chaikin Money Flow (CMF) highlighted in blue circles. This indicates momentum via buying pressure.

In 2016, buying pressure rose after gold had established its high (institutional buying?), but selling pressure got nowhere near the depth it did before reaching that high.In 2019, CMF levels again broke above the zero line, this time followed by a mighty breakout (see black-dashed line) and rally, as the Fed’s repo market injections were likely perceived as yet another form of quantitative easing.And in late 2023, despite high valuations but amid escalating geopolitical risks and de-dollarization worries, the CMF broke above the zero line again, leading to the incredible surge we saw over the last two months.

Here’s the big question…

Is 2023’s Price Ceiling the New Price Floor for 2024 and Beyond?

Currently, analysts from leading banks are revising their gold forecasts, noting the clash between short-term economic shifts and deeper geopolitical fractures are rendering traditional valuation metrics obsolete.

Let’s take a look at the current price action.

CHART 2. DAILY CHART OF $GOLD. Note the parabolic move that’s losing momentum.Chart source: StockCharts.com. For educational purposes.

If you’ve been following national news, you’re probably aware that gold bullion sells like hotcakes at Costco. What does this say? Despite its sky-high valuations, it tells us there’s a frantic retail dash for gold. Still, there are many technical and fundamental reasons to expect a pullback.

For starters, sticky inflation (did you see the latest CPI and PPI report?) indicates the possibility of interest rates being higher for longer.The Money Flow Index (MFI), a volume-weighted RSI, is well within “overbought” territory.The CMF, this time on a daily scale, has dipped into “selling pressure” territory.

Yet, there are many reasons to be bullish on gold—technically, from a macro perspective (as you can see in the monthly chart above) and fundamentally, as discussed at the top of this article.

Keep an eye on $2,100—that’s the 2023 resistance level. Will it provide support for a next leg up?  

When prices dip, what if it doesn’t sink to that level? In this case, watch the most current swing low at $2,150 in conjunction with the Kumo range of the Ichimoku Cloud.

Gold is the Fear Trade

Gold’s rally to $2,395.60 and the whispers of a potential climb to $3,000 mark a seismic shift in how investors view the age-old asset. It also reflects fears surrounding the economy, the future status of the dollar amid de-dollarization, and dwindling faith in the Federal Reserve’s capacity to implement sound monetary policy.

Gold is the fear trade. And if you’re bullish on gold and monitoring all of the fundamental and geopolitical news affecting its valuations, now you have the technical context to get the 360-degree view you need to make your own forecast.

Disclaimer: This blog is for educational purposes only and should not be construed as financial advice. The ideas and strategies should never be used without first assessing your own personal and financial situation, or without consulting a financial professional.

Tesla has settled a wrongful death lawsuit brought by the family of Walter Huang, an Apple engineer and father of two who died after his Model X SUV, with Autopilot features switched on, crashed into a highway barrier near Mountain View, California, in 2018.

The settlement comes as jury selection and a trial were just beginning on Monday in a California Superior court. The settlement allows Tesla to avoid airing evidence and testimonies in a widelyfollowed case.

The National Transportation Safety Board investigated the fatal crash and revealed, in 2020, that it found Tesla’s tech was at least partly to blame for the collision, along with possible driver distraction and problematic road construction. NTSB believed that Huang had been looking at a game on his phone at some point before the collision.

The federal agency found that Tesla’s forward collision warning system did not provide an alert, and its automatic emergency braking system did not activate as Huang’s Model X, with Autopilot engaged, accelerated into a barrier alongside the highway 101. Faded lane markings and the barrier — or crash attenuator — positioning also may have contributed to the collision, the NTSB said in 2020.

Huang’s bereaved family sued Tesla for wrongful death and their claims focused in part on alleged safety and design defects in the company’s driver assistance systems. The case was Sz Huang et al v. Tesla Inc. et al in a California Superior Court in Santa Clara County.

Huang attorneys, in court filings, also pointed to social media and marketing messages from Tesla, its CEO Elon Musk and others, suggesting that Autopilot made Tesla vehicles safe to drive without needing to stay attentive to the road at all times or without needing to keep hands on the vehicle’s steering wheel.

In internal Tesla e-mails referenced in court filings, Tesla execs and engineers discussed how they had become complacent while driving their Tesla vehicles with Autopilot or related premium features switched on. They described reading emails and checking their phones while driving with these systems engaged.

A civil jury trial was slated to begin this week in a San Jose, California courthouse just before Tesla settled.

Tesla attorneys had argued that Huang was an inattentive driver, who ostensibly knew better but was playing mobile games on his phone at the time of the crash.

The company has filed to seal from public view the amount listed in the settlement agreement.

The fatal crash and filings in this suit had already thrown Tesla’s culture, its attitudes about safety and the quality of its driver assistance systems into question for many prospective shareholders and customers.

If a jury had found Tesla liable (in part or whole) for Huang’s death, this trial would have also set a precedent in product liability suits that the EV maker is now facing pervasively, making it easier for other plaintiffs to sue or win over related issues.

In May 2022, Musk declared in a post on social media: “We will never seek victory in a just case against us, even if we will probably win,” adding that, “We will never surrender/settle an unjust case against us, even if we will probably lose.”

Tesla lead attorneys with Bowman and Brooke LLP were not immediately available to comment on Monday.

In a filing asking the court to seal the settlement terms, Tesla’s attorneys wrote that the company had, “entered into a settlement agreement with Plaintiffs to end years of litigation.” They said they wanted the exact dollar amount of the settlement sealed because, “other potential claimants (or the plaintiffs’ bar) may perceive the settlement amount as evidence of Tesla’s potential liability for losses, which may have a chilling effect on settlement opportunity in subsequent cases.”

Attorneys for the Huang family, at the law firms Minami Tamaki and Walkup Melodia, did not immediately respond to a request for comment.

This post appeared first on NBC NEWS