Archive

2024

Browsing

In this edition of StockCharts TV‘s The Final Bar, Dave welcomes guest Danielle Shay of Simpler Trading. Danielle speaks to the downside rotation for the QQQ, SMH, and leading growth stocks, including why the $210 level is so crucial for the SMH. Dave highlights the recent downswing for Bitcoin, the resilience of AMZN, and key levels for earnings names including UAL, JBHT, and CSX.

This video originally premiered on April 17, 2024. Watch on our dedicated Final Bar page on StockCharts TV!

New episodes of The Final Bar premiere every weekday afternoon. You can view all previously recorded episodes at this link.

The iShares China Large-Cap exchange-traded fund (FXI) holds the 50 largest large-cap Chinese stocks that trade on the Hong Kong exchange.

FXI could soon make a secondary test of its 2022 low. A successful test will show strength, but a failed test will show weakness. Either outcome can produce a meaningful directional move offering multiple trading opportunities. This is the kind of setup or juncture around which I like to build agnostic trading plans. Either way, I will have a trading and risk management plan in place to take advantage of either outcome.

In a macro sense, there isn’t much going on in China, leading me to optimism. China is a command economy run by a communist regime in the process of retreating from capitalism. Importantly, leadership seems to be increasingly resistant to providing adequate fiscal stimulus. To that list, you can add a rapidly aging population, a world increasingly resistant to buying their goods, a rethinking of global supply lines, and significant raw material and climate challenges. Granted, there are positives. They are becoming a microchip superpower and have made significant technological advances over the last five years. In my view, the negatives outweigh the positives by quite a lot.

My macro view informs my aggressiveness and risk tolerance. But if a technical setup provides a clear risk-reward advantage, a conflicted macro view never deters me from making a trade. Technical setups are far more actionable than fundamental beliefs. And it is always good to remember that, the more widely accepted a viewpoint becomes, the more susceptible a market becomes to mean reversion or reversal.

Monthly Perspective of FXI

The monthly chart of FXI below shows some significant technical developments.

FIGURE 1: MONTHLY CHART OF FXI.

Chart Takeaways:

FXI is confined within the more extensive 13.43–50.80 range developed since the ETF began trading (four years after China joined the World Trade Organization).In 2021, after slightly up-thrusting the October 2007 high, the market began a vicious decline (-60%). The decline from the February 2021 high occurred on rising volume and a wide price spread (suggesting strong-handed selling). The move was impulsive.In early 2022, FXI fell out of the broad rising channel (A-B, C-D) that had defined the general price action for most of the prior 15 years.The fallout of the channel created strong selling, but a temporary selling climax developed (red arrow) as the market reached the lateral support at 23.05 and opportunistic buying emerged.The minor climax produced a small automatic rally that quickly ran into resistance along the lows of the broken channel. The market then devolved into a four-month show of weakness.The weakness occurred on a wide price spread and growing volume before potentially developing a complex selling climax (SC). Note that while the SC appears complex in this perspective, it appears more traditional in the daily perspective.The automatic rally (AR) lasted four months and found resistance in the same 32–33.00 zone that had turned the market lower in March 2022.After testing the resistance, FXI began setting back toward the selling climax low (19.81). Note that during the most recent decline, the angle of decline was shallower than that of the larger (50.80–19.81) decline and that the volume has been somewhat lighter. The shallower angle and lighter volume suggest less supply entering than on the prior decline.The recent pullback toward the October 2022 low may be developing as a secondary test. The outcome of that test is likely to develop into a significant directional move.The solid volume expansion around the recent low (ST?) suggests strong-handed buying and that the secondary test may be complete, pending a show of strength.

Let’s turn to momentum.

FXI Monthly Momentum

FIGURE 2: MOMENTUM IN FXI. The MACD histogram has turned positive. A push to the upper half of the Bollinger Band would be positive for FXI.Chart source: StockChartsACP. For educational purposes.Momentum takeaways:

Momentum is diverging significantly from price, and the Moving Average Convergence/Divergence Oscillator (MACD) histogram has turned positive. This oscillator condition and strength from this position in the trend would be highly positive.Price has been confined in the lower portion of the Bollinger Band since July 2021. A push into the upper half of the band would mark a significant change in the market’s character. Note that the B-band is narrow. Narrow B-bands often immediately precede trending moves.

Weekly Perspective of FXI

After evaluating the monthly perspective, I will turn to the weekly perspective. I prefer to trade in this (the weekly) perspective.

FIGURE 3. WEEKLY CHART OF FXI. If the ETF moves well above the recent downtrend (A-B) and the volume and price spread expands, consider bullish setups.Chart source: StockChartsACP. For educational purposes.

Chart takeaways:

The price/volume relationships detailed in the monthly perspective are seen more clearly.The false selling climax at A, complex climax at B, automatic rally to 32.36, and low volume decline (note the shallow angle) to point C.The strong volume at point C suggests that strong hands may be accumulating shares around the prior low.As the market has advanced from the 20.86 low, volume and price spread have declined. While supply seems limited, demand is still lacking. The odds of a setback to test 20.86 or perhaps even to provide a fuller test of the 19.81 low are still good.In my opinion, it’s premature to conclude that the secondary test is complete. But if the market begins working its way above the downtrend defining the potential test (A–B), particularly if volume and price spread expands, it would likely signal a completed test. This would allow me to begin utilizing bullish setups with confidence.

Daily Perspective of FXI

FIGURE 4. DAILY CHART OF FXI. Seeing strength above the A to B downtrend would indicate FXI has bottomed. If FXI breaks out above the downtrend channel, consider entering bull flags and other corrective style drift patterns.Chart source: StockChartsACP. For educational purposes.A show of strength above the A–B would suggest that a good bottom was in. If that level is exceeded, entering bull flags and other corrective style drift patterns should provide good entries.

Lastly, I evaluate the daily perspective to see if the larger price and volume characteristics still hold in the detail.

The initial selling climax (SC) stands out more clearly. Note that this was a large lower gap day (opened far below the prior day’s close) but closed well off the day’s low.The drift lower (A-B) is well-defined, has occurred on generally low volume, and the angle of the testing decline is shallow.I prefer secondary tests that are well separated in terms of time and that come close to fully retracing the climax structure. This structure qualifies in both respects. I prefer a deeper cut toward the 19.81 low, but 20.86 is close enough.Note that volume has declined markedly, and the price spread has narrowed as the market rallied over the last few weeks. This is not ideal and suggests that the secondary test structure may be incomplete.A show of strength above the A–B would suggest that a good bottom was in. If that level is exceeded, entering bull flags and other corrective style drift patterns should provide good entries.

Relative Strength Ratio Chart Weekly: China/Japan, China/World, and China/India

Below are monthly relative strength charts comparing FXI to iShares MSCI Japan ETF (EWJ), iShares MSCI World ETF (URTH), and iShares MSCI India ETF (INDA). China has consistently underperformed all three. Becoming optimistic about anything beyond a trading turn would require the Chinese market to strengthen markedly relative to the rest of the world.

FIGURE 5. FXI VX. EWJ, URTH, AND INDA. FXI has consistently underperformed EWJ, URTH, and INDA. FXI would have to strengthen relative to the others to paint a more optimistic picture.Chart source: StockChartsACP. For educational purposes.

Monthly Perspective of MSCI Japan (EWJ)

Figure 6. MONTHLY CHART OF EWJ. EWJ is testing its 2021 high, while FXI is testing an important low. If FXI shows strength and EWJ shows weakness, you could consider a long-term spread trade.Chart source: StockChartsACP. For educational purposes.

The FXI:EWJ chart in Figure 5 is particularly interesting.

As FXI tests an important low, EWJ is testing its 2021 high (see Figure 6).Potential divergences are setting up in the price chart of EWJ and the spread chart of FXI:EWJ. This sets up a potential long-term spread trade, especially if FXI shows signs of strength, as EWJ shows weakness.

The Final Step

In my process, the final step is the sanity check. Am I falling prey to behavioral bias? Am I being dispassionate? Is my belief system compromising my impartiality? I have to conclude that in the case of FXI, that may well be so. From a personal point of view, I may have reservations about investing in China. Historically, command economies that are becoming less free tend to make for lousy investments. They are also subject to step function changes due to policy changes and wrecking risk management overlays. My firmly-held opinion may compromise my read of the FXI chart. Because of this, I will need to pay greater than usual attention to how I build my trading plan.

Note: Many topics and techniques discussed in this blog post are part of the curriculum of the CMT Association’s Chartered Market Technician.

Shared content and posted charts are intended for informational and educational purposes only. The CMT Association does not offer, and this information shall not be understood or construed, as financial advice or investment recommendations. The information provided is not a substitute for advice from an investment professional. The CMT Association does not accept liability for any financial loss or damage our audience may incur.

It’s showtime! On Thursday, after the stock market closes, Netflix, Inc. (NFLX) will announce Q1 earnings. The stock is close to a major resistance level. Will it break through when it reports earnings? Or will it fall? The answer depends on whether it beats or misses.

Wall Street analysts expect stellar results—NFLX is expected to report adjusted EPS of $4.52 per share, well above the $2.88 in the prior-year quarter. Revenue is projected at $9.27 billion, up 13.6% from a year ago.

A Longer-Term View of NFLX Stock

Looking at the weekly chart of NFLX (see below), the stock price is approaching its all-time high. NFLX stock is trading above its 13-week simple moving average (SMA), and its relative performance suggests NFLX is underperforming the S&P 500 ($SPX) on a weekly scale.

Note: The 13-week SMA represents one quarter.

FIGURE 1. WEEKLY CHART OF NFLX STOCK. NFLX has been trending higher since July 2022. Whether the stock continues in this direction depends on its earnings report. The stock is close to its 13-week SMA and is approaching a strong resistance level.Chart source: StockChartsACP. For educational purposes.

If NFLX beats analyst estimates and delivers strong guidance, its stock price could reach its all-time high and have enough follow-through to rally higher. NFLX has a lot up its sleeve.

Despite increasing competition from Apple (AAPL), Amazon (AMZN), Walt Disney (DIS), and Comcast (CMCSA), NFLX has maintained its leadership position in the streaming space. NFLX continues releasing more content and plans to expand its sports offerings, including the live event of Mike Tyson vs. Jake Paul this summer. There are lots of other sports content in the works, all of which are expected to appeal to a broader audience.

If all goes as expected, NFLX could soar well past $700, but earnings reports can move the stock price either way. With the earnings release coinciding with an overall equity market correction, if earnings disappoint or if guidance is weak, NFLX could see a massive selloff. Some areas that could be soft are advertising revenue and the number of new memberships.

If the stock price falls below its 13-week SMA, it could be a repeat of what occurred at the end of 2021 after the stock price hit its all-time high. Note how steep the descent was.

A Shorter-Term View

Turning to the daily chart, NFLX stock is trading just above its 50-day SMA, but the relative strength index (RSI), an indicator that gauges momentum, presents an intriguing picture. While NFLX’s stock price was trending higher (late Jan to April 2024), the RSI (lower panel) was trending lower. This raises a red flag, since it indicates that momentum is slowing—a bearish divergence.

FIGURE 2. DAILY CHART OF NFLX STOCK. The divergence between price and RSI is concerning, but that could be because investors await the earnings results before deciding to buy or sell NFLX stock.Chart source: StockChartsACP. For educational purposes.This begs a sanity check to see if NFLX is technically strong. Adding the StockCharts Technical Rank (SCTR) to the chart is helpful. The SCTR score is at around 97, which indicates that NFLX is still a strong stock (upper panel).

Final Thoughts

Looking at the options quotes for NFLX in StockCharts, the implied volatility (IV) of options expiring on Friday, April 19, is around 150%. This means you can expect a lot of volatility in NFLX’s stock price around the earnings date. This may explain why the RSI has declined—investors are awaiting the earnings report.

There’s also increased activity in the out-of-the-money call options, which indicates that the directional bias is to the upside as of this writing.

FIGURE 3. OPTIONS DATA FOR NFLX. Options expiring on April 19 show high IV, with the out-of-the-money call options showing increased trading activity.Chart source: StockCharts.com. For educational purposes.

The bottom line: Expect a lot of volatility in NFLX after the market closes on Thursday. If you’re considering adding NFLX to your portfolio, wait until the price settles after the earnings announcement.

Learn More. Want to trade options to generate additional income or hedge your portfolio holdings? Check out this video.

Disclaimer: This blog is for educational purposes only and should not be construed as financial advice. The ideas and strategies should never be used without first assessing your own personal and financial situation, or without consulting a financial professional.

Tesla will lay off more than 10% of its global workforce, according to a memo sent to employees by CEO Elon Musk.

The company’s shares were down 3% on Monday morning.

“As we prepare the company for our next phase of growth, it is extremely important to look at every aspect of the company for cost reductions and increasing productivity,” Musk said in the memo obtained by CNBC.

“As part of this effort, we have done a thorough review of the organization and made the difficult decision to reduce our headcount by more than 10% globally,” the memo said.

The memo was first reported by Electrek.

Tesla had 140,473 employees as of December 2023.

Tesla shares have taken a bruising in recent months, falling 31% year to date. While electric vehicle sales are still gaining popularity worldwide, their sales growth rate has slowed especially for Tesla. The company now faces more competition than ever.

To end 2023, China’s BYD temporarily dethroned Tesla as the world’s top EV maker. Chinese smartphone company Xiaomi in March said it would sell its first electric car for far less than Tesla’s Model 3.

Musk has previously recognized that China, home to a large Tesla factory, may also house the company’s strongest competition. “There’s a lot of people who are out there who think that the top 10 car companies are going to be Tesla followed by nine Chinese car companies. I think they might not be wrong,” Musk said in November.

Some would-be Tesla customers are now skipping the brand owing to Musk’s incendiary rhetoric on the year to 386,810 in the first quarter, with output down 1.7% from a year earlier and 12.5% sequentially despite discounts and incentives offered to customers throughout the quarter.

Earlier this month, Tesla reported its first annual decline in vehicle deliveries since 2020, when the Covid-19 pandemic disrupted production extraneous of demand — first-quarter deliveries fell by 8.5% on the year to 386,810 in the first quarter, with output down 1.7% from a year earlier and 12.5% sequentially despite discounts and incentives offered to customers throughout the quarter.

More recently, Tesla trimmed the subscription price of its premium driver assistance system, marketed as its Full Self-Driving or FSD option, for U.S. customers. The move was sharply at odds with Musk’s previous pledges that the FSD fee would only bulk up as Tesla added features and functionality to the system. Despite the brand name, the system does not make Tesla vehicles self-driving and requires a driver attentive to the road, ready to steer or brake at any time.

But the squeeze on the company’s operating margin — which came in at 8.2% in the fourth quarter, down from 16% a year earlier — remains, and Tesla has warned investors to brace that vehicle volume growth this year “may be notably lower” than the rate logged in 2023, saying it is “currently between two major growth waves.”

Logistical challenges exacerbated Tesla’s problems this year. The company’s component supply was a casualty of disruptions caused by Yemeni Houthi maritime attacks in the Red Sea, while the automaker’s gigafactory near Berlin was forced to briefly suspend production due to suspected arson at a nearby electricity substation.

Tesla is scheduled to report first-quarter financial results on April 23.

Here’s the full memo from Musk (transcribed by CNBC):

Over the years, we have grown rapidly with multiple factories scaling around the globe. With this rapid growth there has been duplication of roles and job functions in certain areas. As we prepare the company for our next phase of growth, it is extremely important to look at every aspect of the company for cost reductions and increasing productivity.

As part of this effort, we have done a thorough review of the organization and made the difficult decision to reduce our headcount by more than 10% globally. There is nothing I hate more, but it must be done. This will enable us to be lean, innovative and hungry for the next growth phase cycle.

I would like to thank everyone who is departing Tesla for their hard work over the years. I’m deeply grateful for your many contributions to our mission and we wish you well in your future opportunities. It is very difficult to say goodbye.

For those remaining, I would like to thank you in advance for the difficult job that remains ahead. We are developing some of the most revolutionary technologies in auto, energy and artifiical intelligence. As we prepare the company for the next phase of growth, your resolve will make a huge difference in getting us there.

Thanks,

Elon

This post appeared first on NBC NEWS

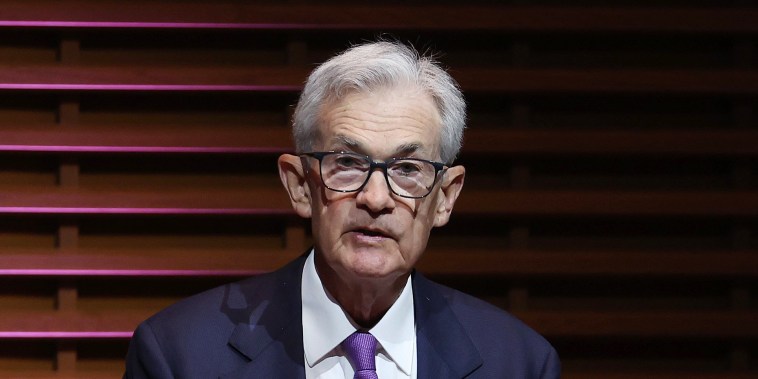
Federal Reserve Chair Jerome Powell said Tuesday that the U.S. economy, while otherwise strong, has not seen inflation come back to the central bank’s goal, pointing to the further unlikelihood that interest rate cuts are in the offing anytime soon.

Speaking to a policy forum focused on U.S.-Canada economic relations, Powell said that while inflation continues to make its way lower, it hasn’t moved quickly enough, and the current state of policy should remain intact.

“More recent data shows solid growth and continued strength in the labor market, but also a lack of further progress so far this year on returning to our 2% inflation goal,” the Fed chief said during a panel talk.

Echoing recent statements by central bank officials, Powell indicated the current level of policy likely will stay in place until inflation gets closer to target.

Since July 2023, the Fed has kept its benchmark interest rate in a target range between 5.25%-5.5%, the highest in 23 years. That was the result of 11 consecutive rate hikes that began in March 2022.

“The recent data have clearly not given us greater confidence, and instead indicate that it’s likely to take longer than expected to achieve that confidence,” he said. “That said, we think policy is well positioned to handle the risks that we face.”

Powell added that until inflation shows more progress, “We can maintain the current level of restriction for as long as needed.”

The comments follow inflation data through the first three months of 2024 that has been higher than expected. A consumer price index reading for March, released last week, showed inflation running at a 3.5% annual rate — well off the peak around 9% in mid-2022 but drifting higher since October 2023.

Treasury yields rose as Powell spoke. The benchmark 2-year note, which is especially sensitive to Fed rate moves, briefly topped 5%, while the benchmark 10-year yield rose 3 basis points. The S&P 500 wavered after Powell’s remarks, briefly turning negative on the day before recovering.

Powell noted the Fed’s preferred inflation gauge, the personal consumption expenditures price index, showed core inflation at 2.8% in February and has been little changed over the past few months.

“We’ve said at the [Federal Open Market Committee] that we’ll need greater confidence that inflation is moving sustainably towards 2% before [it will be] appropriate to ease policy,” he said. “The recent data have clearly not given us greater confidence and instead indicate that it’s likely to take longer than expected to achieve that confidence.”

Financial markets have had to reset their expectations for rate cuts this year. At the start of 2024, traders in the fed funds futures market were pricing in six or seven cuts this year, starting in March. As the data has progressed, the expectations have shifted to one or two reductions, assuming quarter percentage point moves, and not starting until September.

In their most recent update, FOMC officials in March indicated they see three cuts this year. However, several policymakers in recent days have stressed the data-dependent nature of policy and have not committed to set level of reductions.

This post appeared first on NBC NEWS

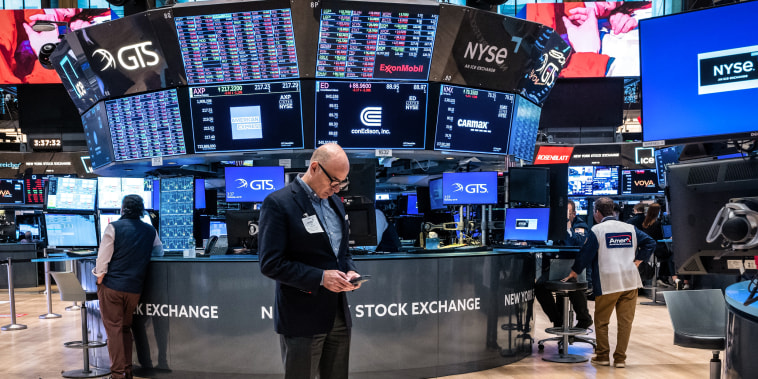
Stocks sold off Friday as inflation and geopolitical worries once again dented investor sentiment on Wall Street. A broad decline in major bank shares also weighed on the market.

The Dow Jones Industrial Average slid 475.84 points, or 1.24%, closing at 37,983.24. The S&P 500 tumbled 1.46% at 5,123.41. The Nasdaq Composite pulled back by 1.62% at 16,175.09.

At one point in the trading session, the Dow was down by nearly 582 points, or 1.51%. The S&P 500 slid as much as 1.75%.

Week to date, the broad market index dropped 1.56%, and the 30-stock Dow fell 2.37%. Meanwhile, the tech-heavy Nasdaq is 0.45% lower for the week.

Markets are generally in good shape so far this year. The Dow is up 0.7% year-to-date. The S&P 500 and Nasdaq are up 8% and 9.5% respectively since the beginning of 2024.

JPMorgan Chase shares declined more than 6% after the banking giant posted its first-quarter results. The bank said net interest income, a key measure of what it makes through lending activities, could be a little short of what Wall Street analysts are expecting in 2024. CEO Jamie Dimon also warned about persistent inflationary pressures weighing on the economy. 

Wells Fargo slipped 0.4% after reporting its latest quarterly figures. Citigroup dropped 1.7% despite posting a revenue beat.

Oil prices continued their rise on reports that Israel is preparing for a direct attack by Iran this weekend, in what would be the biggest escalation of tensions in the region since the outbreak of the Israel-Hamas war last October. U.S. crude settled at $85.66 a barrel after rising above $87.

That, coupled with fresh U.S. imports data, added fuel to inflation concerns that have put pressure on the market.

“We’re getting further risk off sentiment heading into the weekend. You’re seeing there’s a flight to safety trade, with the dollar stronger, and we’re seeing equities sell off,” said Rob Haworth, U.S. Bank Wealth Management senior investment strategist.

“That comes on the heels of the inflation data that tells us the economy’s still pretty hot and inflation is sticky; that’s what led [investors] to really adjust their expectations around the Fed. … That’s some of why they’re getting cautious headed into the weekend,” said Haworth.

Consumers are also growing worried about the persistent inflationary pressures. The consumer sentiment index for April came in at 77.9, below the Dow Jones consensus estimate of 79.9, according to the University of Michigan’s Surveys of Consumers. Year-ahead and long-run inflation expectations also ticked up, reflecting frustrations over sticky inflation.

This post appeared first on NBC NEWS

Veteran NBA forward Blake Griffin announced his retirement from professional basketball Tuesday.

“I never envisioned myself as the guy who would have a ‘letter to basketball’ retirement announcement … and I’m still not going to be that guy,” Griffin posted on Instagram. “But as I reflected on my career, the one feeling I kept coming back to and the thing I wanted to express was thankfulness.

“I’m thankful for every single moment – not just the good ones: the wins, the awards, the dunks and the memorable time spent with family, friends, fans, teammates, and coaches.”

Griffin also acknowledged his parents, Tommy and Gail, and his brother, Taylor ‘for their unconditional support and guidance.’

Griffin spent 13 seasons in the NBA with the Los Angeles Clippers, Detroit Pistons, Brooklyn Nets and Boston Celtics. He averaged 19.0 points, 8.0 rebounds and 4.0 assists and shot 49.3% from the field. He was a six-time All-Star, five-time All-NBA selection and 2010-11 Rookie of the Year. His final season was in 2022-23 with Boston.

A star at Oklahoma, Griffin was the 2008-09 college player of the year, averaging 22.7 points and 14.4 rebounds, and left for the NBA after two seasons with the Sooners. He was the No. 1 overall pick by the Clippers in the 2009 draft but missed the 2009-10 season with a knee injury.

Injuries were a significant part of Griffin’s career. He had five seasons with fewer than 35 games played, and Griffin gave a nod in that direction. “I am equally thankful for the not-so-good moments: the losses, the injuries, the wayyyy too many surgeries, the lessons, the heartbreaks, and it wouldn’t be (a) sports retirement letter without acknowledging the ‘haters.’ ”

In his prime, Griffin was among the league’s best power forwards. He averaged a double-double in points and rebounds twice in his career, including 22.5 points and 12.1 rebounds in 2010-11 and posted a career-high 24.5 points per game with the Pistons in 2018-19.

He was also a powerful and emphatic dunker – both in games and in the dunk contest. He won the event in 2011, jumping over the hood of a car while catching an alley-oop pass from Baron Davis who was poking through the sunroof of the car.

Follow NBA reporter Jeff Zillgitt on social media @JeffZillgitt

This post appeared first on USA TODAY

Kansas City Chiefs receiver Rashee Rice and Southern Methodist cornerback Teddy Knox are being sued for more than $10 million for damages from people who say they were ‘severely injured’ in the multi-vehicle crash last month in Texas.

Irina Gromova and Edvard Petrovskiy are the plaintiffs in the lawsuit filed in Dallas County, Texas on April 11. The two alleged Rice and Knox purposely drove their vehicles at high speeds and showed negligence toward the victims of the crash that occurred on March 30 in Dallas.

The two vehicles Rice and Knox drove in the crash were leased by Rice, and in the lawsuit, the plaintiffs alleged the football players challenged each other to a race in their high-speed cars. After the crash, Gromova and Petrovskiy say Rice and Knox didn’t show any remorse or compassion after the collision that resulted in injuries to several people.

‘Despite innocent victims calling for emergency help and desperately trying to exit their destroyed vehicles in state of shock, (Rice and Knox) intentionally, knowingly evaded assisting injured commuters and absconded from the scene,’ the lawsuit reads. ‘The victims and bystanders of the carnage tried to engage the (Rice and Knox), but they were ignored in (their) attempt to flee without responsibility.’

The lawsuit reads Gromova was the driver of one of the vehicles involved and Petrovskiy was the passenger. Both were wearing seatbelts at the time of the accident, according to the suit. The two claim they suffered several injuries as a result of the crash.

NFL DRAFT HUB: Latest NFL Draft mock drafts, news, live picks, grades and analysis.

‘They were severely injured by the tremendous force of the high-speed impact,’ the lawsuit reads. ‘Injuries include trauma to the brain, lacerations to the face requiring stitches, multiple contusions about the body, disfigurement, internal bleeding and other internal and external injuries that may only be fully revealed over the course of medical treatment.’

Because of the injuries and damage to the vehicle, Gromova and Petrovskiy are suing for $10 million in punitive damages, $1 million in actual damages for medical care, physical impairment, loss of earnings, mental anguish and property damage.

This post appeared first on USA TODAY

Women’s sports, particularly women’s basketball, continues to grow. So do the viewership numbers.

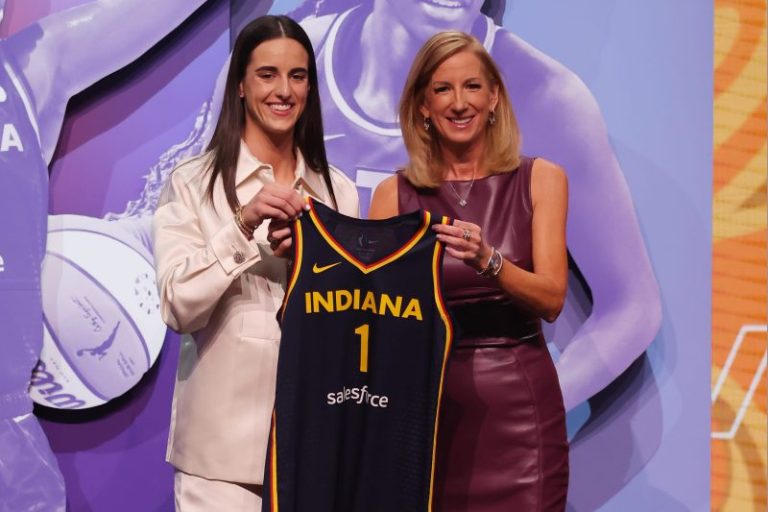
A record 2.45 million viewers tuned in to the 2024 WNBA draft on ESPN to witness the Indiana Fever select Caitlin Clark with the first overall pick on Monday, demolishing the previous record. Clark was apart of the superb 2024 draft class that included No. 2 pick Cameron Brink (Los Angeles Sparks), No. 3 pick Kamilla Cardoso (Chicago Sky), No. 4 pick Rickea Jackson (Sparks) and No. 7 pick Angel Reese (Sky).

“This is generational class,” Jackson said. “Viewership is peaking. Women’s basketball is on an uproar. Everybody is tuning in. … I’m grateful to be a part of this draft class. I feel like we’re just trending in the right direction.”

According to ESPN, viewership of the 2024 WNBA Draft peaked at 3.09M.

Earlier this month, a record 18.7 million people tuned into the NCAA championship game to see Cardoso and the South Carolina Gamecocks defeat Clark and the Iowa Hawkeyes in the most watched women’s basketball game ever and the most watched basketball game period – men’s or women’s, pro or college – since 2019.

2024 WNBA DRAFT: Clark goes No. 1 to Fever. See all the picks

OPINION: Why this WNBA draft is a landmark moment (not just because of Clark)

Before the 2024 WNBA draft’s historic numbers, the previous draft record was 600K viewers in 2004 when the Phoenix Mercury selected three-time UConn champion Diana Taurasi with the first overall pick. The 2023 WNBA draft, where former South Carolina star Aaliyah Boston we selected by the Fever first overall, drew in 512K viewers.

The 2024 draft also marked the WNBA’s largest television audience in over two decades. In 2000, a Memorial Day game between the New York Liberty and the now-defunct Houston Comets averaged 2.74 million viewers on NBC, which aired the game ahead of the NBA conference finals.

This post appeared first on USA TODAY

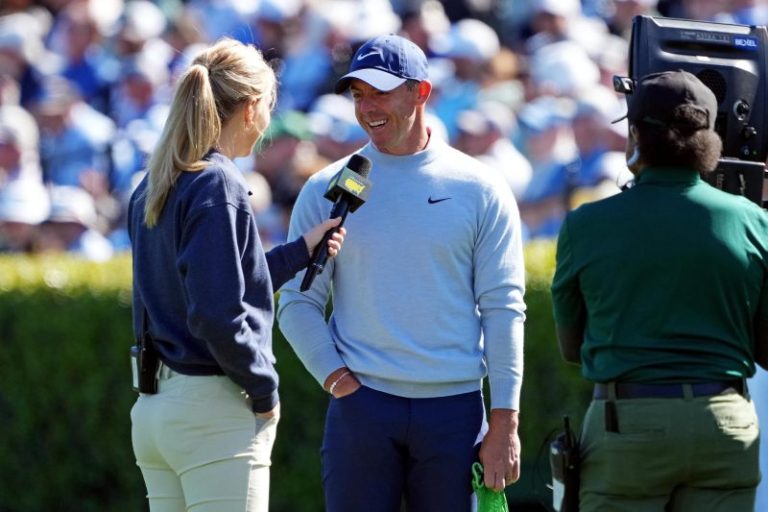
Rory McIlroy maintains he’s sticking with the PGA Tour following a report that LIV Golf offered him $850 million and an ownership stake to join the league.

‘I honestly don’t know how these things get started. I’ve never been offered a number from LIV and I’ve never contemplated going to LIV,’ McIlroy told Golf Channel.

‘I think I’ve made it clear over the past two years that I don’t think it’s something for me. Doesn’t mean that I judge people that have went and played over there — I think one of the things that I’ve realized over the past two years is people can make their own decisions for whatever they think is best for themselves and who are we to judge them for that? But personally, for me, my future is here on the PGA Tour and it’s never been any different.’

McIlroy doubled down on his commitment to the PGA Tour, saying he will spend the rest of his career with it.

‘Over the last two years there’s been so many rumors of guys — I think the one thing I’ve realized as well … guys need to keep an open mind. I’m sure there’s been players that are still playing on the PGA Tour that have talked to the guys from LIV and had offers and whatever. …. It’s never even been a conversation for us.

‘It’s one of those things. It’s unfortunate that we have to deal with it and this is the state that our game’s in. But I’m obviously here today and I’m playing this PGA Tour event next week and I will play the PGA Tour for the rest of my career.’

The four-time major champ had been one of LIV Golf’s more vocal critics since its inception, going so far as to say last year that, ‘If LIV Golf was the last place to play golf on Earth, I would retire.’ McIlroy’s stance on the Saudi-funded tour appears to have softened somewhat in recent months, however.

‘I wouldn’t say I’ve lost the fight against LIV, but I’ve just accepted the fact that this is part of our sport now,’ McIlroy said in January.

He added then he was ‘maybe a little judgmental of the guys who went to LIV Golf at the start, and I think it was a bit of a mistake on my part because I now realize that not everyone is in my position or in Tiger Woods’ position.’

He echoed many of those comments while speaking Tuesday with Golf Channel. His personal commitment to the PGA Tour, though, appears to remain firm.

This post appeared first on USA TODAY