Archive

2024

Browsing

In this episode of StockCharts TV‘s The MEM Edge, Mary Ellen reviews the negative shift that’s evolved over the past week in the market and highlights key signals of capitulation you should be watching for. She then shares the move into Value stocks she’s seeing as heavy selling hit well known stocks – Google, Meta and Microsoft.

This video originally premiered April 19, 2024. Click here or on the above image to watch on our dedicated MEM Edge page on StockCharts TV.

New episodes of The MEM Edge premiere weekly on Fridays. You can view all previously recorded episodes at this link.

If you’re looking for stocks to invest in, be sure to check out the MEM Edge Report! This report gives you detailed information on the top sectors, industries and stocks so you can make informed investment decisions.

While our major equity benchmarks showed incredible strength in Q1 2024, breadth conditions have been deteriorating since mid-March. Despite the weakening breadth readings, and the initial breakdowns of the S&P 500 and Nasdaq 100, leading growth names, including the formerly-described Magnificent 7 stocks, had remained in clearly-defined uptrends.

This week, some of the top-performing stocks in the S&P 500 finally broke below their 50-day moving averages. While this signal on its own is not a sign of a market top, these breakdowns represent just one of the many clear signals that the bull market off the October 2023 low may be over.

Today, we’ll briefly review some of the early breakdowns in the mega-cap growth space, how some of the top-ranked SCTR stocks have shown recent weakness, and why the “Fantastic Four” (current front-runner to replace the “Magnificent 7 moniker) breaking down may represent a key confirmation for a new bear phase.

The Early Breakdowns: Apple (AAPL) & Tesla (TSLA)

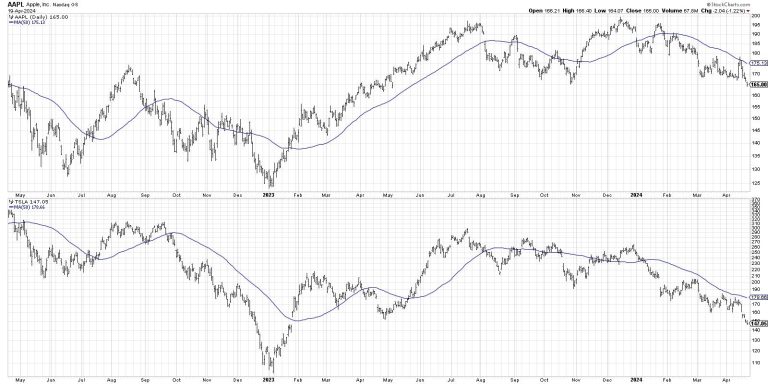
Tesla has been in a confirmed downtrend since July 2023, and Apple has appeared in a weak technical configuration since failing to break above the $200 level in December and January. But both charts have literally and figuratively made a new low this week.

Note how both charts have remained below downward-sloping 50-day moving averages since mid-January. Also observe how both have shown failed attempts to break above that moving average in recent months. When stocks are making lower lows and lower highs, and trending below downward-sloping moving averages, I’ve learned it’s best to avoid taking action until some of those conditions start to change. 

Ready to talk market breadth indicators? Our next free webinar, Breaking Down Breadth, will focus on breadth conditions now vs. previous market tops. Join me on Tuesday, April 23rd at 1pm ET as we review the current market environment through the lens of breadth indicators, compare them to conditions at previous market tops, and discuss the likelihood of further drawdowns for the S&P 500 and Nasdaq. Sign up HERE for this free webcast!

As these stocks broke down, diverging from most other leading growth names, the S&P 500 and Nasdaq 100 pushed much higher. So let’s see some of the stocks that served as leadership in Q1.

The Top-Ranked SCTRs: Super Micro Computer (SMCI) & MicroStrategy (MSTR)

Here, we have two names that were less well-known until they experienced exponential gains earlier this year. And while they certainly appeared overextended in March, they have now both come right down to earth.

From the end of 2023 to their peaks in March 2024, SMCI and MSTR gained 350% and 175%, respectively. They both were a far distance from moving average support, giving clear signs of overbought conditions. So far in April, both stocks have traded much lower, and they each finished this week below their 50-day moving averages.

It’s normal for stocks in strong uptrends to pull back and test moving average support. Indeed, the 50-day moving average often serves as a potential entry point for a “buy on the dips” strategy. But when top performers fail to hold this crucial short-term support level, I have found that it often implies a broader move to more risk-off positioning.

What about the best of the biggest–in other words, the most magnificent of the Magnificent 7?

The Fantastic Four Breakdowns: Netflix (NFLX) & Amazon (AMZN)

That brings us to perhaps the most concerning development this week. As I recently posted on my social media accounts, “As long as $AMZN and $NFLX remain above the 50-day moving average, you can make an argument for ‘short-term pullback’ as opposed to ‘protracted and painful decline.'” Unfortunately, this week, we finally observed this breakdown of breakdowns.

Mega-cap growth stocks wield an outsized influence on our top-heavy growth-dominated equity benchmarks. In recent weeks, bearish momentum divergences, weakening breadth conditions, and breaks of “line in the sand” support levels had us thinking market weakness over market strength. But the resilience of the Fantastic Four stocks gave us just a glimmer of hope that a pullback may be limited.

Given this week’s breakdown in the charts of previous top performers, we feel this just may be the beginning of the great bear phase of Q2 2024.

RR#6,

Dave

P.S. Ready to upgrade your investment process? Check out my free behavioral investing course!

David Keller, CMT

Chief Market Strategist

StockCharts.com

Disclaimer: This blog is for educational purposes only and should not be construed as financial advice. The ideas and strategies should never be used without first assessing your own personal and financial situation, or without consulting a financial professional.

The author does not have a position in mentioned securities at the time of publication. Any opinions expressed herein are solely those of the author and do not in any way represent the views or opinions of any other person or entity.

In this edition of StockCharts TV‘s The Final Bar, Dave and Grayson run through top 10 charts to watch in April 2024! Together they cover breakout strategies, moving average techniques, relative strength, and much more. You don’t want to miss these insights into market dynamics and chart patterns that could impact your trading decisions.

This video originally premiered on April 19, 2024. Watch on our dedicated Final Bar page on StockCharts TV!

New episodes of The Final Bar premiere every weekday afternoon. You can view all previously recorded episodes at this link.

What a difference a week makes.

Last week, the stock market changed its tune from up, up, up,… to up, down, up, down. That made it feel like investors were uncertain, yet the CBOE Volatility Index ($VIX) wasn’t high enough to confirm the fear. This week, the market’s singing another tune emphasizing the word “down.” This week, the selling pressure was more dominant, especially in the Tech sector. Does this mean the bear is coming out of hibernation?

The Macro Environment

We heard comments from two Federal Reserve Presidents, John Williams and Austan Goolsbee, who left open the possibility of a rate hike. Fed Chair Jerome Powell suggested interest rates could remain higher for longer. Next week, we’ll get the March PCE data, and, in light of the Fed comments, it could be higher than estimates.

We’ll also get the Q1 GDP, which will probably reveal the continued strength of the US economy. If the economy continues to be resilient, we may not see a rate cut this year. As of now, the stock market has priced in at least one rate cut in 2024, which is different than the four that were expected earlier in the year.

In a “higher for longer” interest rate environment, two events that could have intensified the selling pressure at the end of the week are:

Escalating geopolitical tensions in the Middle East, which, for the time being, have tapered.Options expiration day, which means heavy trading volume.

Nobody wants to open new positions on a Friday, especially after a volatile trading week. Anything could happen over the weekend, and traders would rather be patient and wait to see if the stock market has further to fall before jumping in.

The Broader Market

You’ve heard the adage, “Markets take the stairs up and the elevator down.” You can see this play out in the charts of the broader indexes.

The S&P 500

The S&P 500 ($SPX) closed below 5,000, a significant psychological level. On the daily chart, the index broke below its 50-day simple moving average (SMA) and is now approaching its 100-day SMA. The last six days have been an elevator ride down and, the way the chart looks, there could be more selling next week.

FIGURE 1. DAILY CHART OF THE S&P 500. Since the S&P 500 fell below its 50-day SMA, it’s taken the elevator down. The index is now approaching its 100-day SMA, which could be its next support level. Will it fall below the support?Chart source: StockCharts.com. For educational purposes.

On the weekly chart, the S&P 500 is above its 50-week SMA, but has three consecutive down weeks, which doesn’t paint a pretty picture. Right now, it looks as if the index has further to fall.

The Dow Jones Industrial Average

After its most recent selloff, the Dow Jones Industrial Average ($INDU) is trading around a support level (December 2023 high). The daily chart below shows that even though the index closed higher on Friday, it hit resistance from its 100-day SMA.

FIGURE 2. DAILY CHART OF DOW JONES INDUSTRIAL AVERAGE ($INDU). After its elevator ride down, $INDU appears to have hit a support level and trying to reverse, which is a positive sign.Chart source: StockCharts.com. For educational purposes.

The Nasdaq Composite

The Technology sector was hit hard this week. NVIDIA (NVDA) fell over 9% on Friday; Tesla (TSLA) shares continued to fall, hitting a new 52-week low; and Advanced Micro Devices (AMD) fell over 5%.

Super Micro Computers (SMCI), which has been in the top 5 StockCharts Technical Rank (SCTR) for months, fell over 23%. The selloff was caused by the company’s decision not to preannounce its earnings results as it has in the past.

Looks like investors were taking their Tech stock profits. As a result of the big Tech selloff, the Nasdaq Composite is trading below its 100-day SMA (see chart below).

FIGURE 3. DAILY CHART OF NASDAQ COMPOSITE. After falling below its 100-day SMA, the Nasdaq Composite could slide to its 200-day SMA. The small wick at the bottom is slightly encouraging, but next week is another week.Chart source: StockCharts.com. For educational purposes.

Whenever there’s a massive selloff, as was the case this week, investors question whether the market has hit a bottom and if it’s an ideal time to open long positions. There was a little bit of that on Friday, but every time the market rallied, it met pressure from sellers and the rally fizzled. When technicals still point lower, you may want to adopt a “wait and see” approach before entering long positions.

Nobody knows what will happen next week, but tech companies will start reporting earnings, and that could lift the stock market.

Some Bright Spots

After experiencing a plunge similar to that of the broader indexes, the Financial sector is showing signs of a reversal. The daily chart of the Financial Select Sector SPDR (XLF) below shows a possible reversal, although a series of higher highs and higher lows is needed before an uptrend can be established. XLF would need to break above.

FIGURE 4. DAILY CHART OF FINANCIAL SELECT SECTOR SPDR ETF (XLF). Looks like XLF will have to overcome the resistance from its 50-day moving average before its trend reverses.Chart source: StockCharts.com. For educational purposes.

Shares of Bank of America (BAC), JP Morgan Chase (JPM), Citigroup (C), and Wells Fargo (WFC) all traded higher on Friday. WFC’s stock price reached a new all-time high. Precious metals, such as gold and silver, are trading higher. As geopolitical tensions arise, investors turn to these safe-haven investments.

It was interesting to see the CBOE Volatility Index ($VIX) hit a high of 21.36, close to the 23 level it hit in October last year. But it pulled back and closed at 18.71. The higher volatility could have been because of options expiration.

If you look at the chart of the Nasdaq Composite, you’ll see that this coincided with the October selloff in Tech stocks. Will the broader markets follow a similar path, given Tech earnings start next week? We’ll have to wait and see.

The Bottom Line

This week’s stock market action wasn’t great, and while it’s tempting to find bargains in stocks, it’s best to exercise patience. Instead of chasing positions, it’s an excellent time to analyze charts and observe the market’s actions. This can go a long way in understanding the irrational nature of the stock market.

End-of-Week Wrap-Up

S&P 500 closes down 0.88% at 4,967.23, Dow Jones Industrial Average up 0.56% at 37,986; Nasdaq Composite down 2.05% at 15,282.01$VIX up 3.94% at 18.71Best performing sector for the week: UtilitiesWorst performing sector for the week: TechnologyTop 5 Large Cap SCTR stocks: MicroStrategy Inc. (MSTR); Coinbase Global Inc. (COIN); Super Micro Computer, Inc. (SMCI); Vistra Energy Corp. (VST); Vertiv Holdings (VRT)

On the Radar Next Week

Q1 2024 US GDPMarch Core PCEMarch Durable Goods Orders Earnings season is in full swing with Alphabet (GOOGL), Meta Platforms (META), Microsoft (MSFT), Intel Corp. (INTC), and Visa (V) reporting.

Disclaimer: This blog is for educational purposes only and should not be construed as financial advice. The ideas and strategies should never be used without first assessing your own personal and financial situation, or without consulting a financial professional.
Meta Platforms Inc. (META), the social media giant formerly known as Facebook, has been in tight consolidation at the top of its range for a little over a month. Following a 23% rise in February after its Q4 earnings, trading volume for the stock has declined significantly. Market participants are now looking for any catalyst that could guide the stock’s movement.

Analyst Price Predictions Show Wide Variation

If you’re undecided as to whether you’re bullish or bearish on Meta, you’re not alone, as the blogosphere will show you a wide range of analyst price predictions for the next 12 months. The highest price target is at $610, average consensus is at $489, and the lowest price targets average around $272.

Yet, consensus ratings lean from “Buy” to “Strong Buy.”

What’s New with Meta? It’s New AI Rollout

The bullish outlook is driven by its new AI app, Meta AI, which aims to boost user engagement across WhatsApp, Instagram, Facebook, and Messenger by providing advanced AI capabilities such as animations and image generation. Supported by partnerships with Alphabet (GOOGL) and Microsoft (MSFT), Meta AI will likely see ad revenue growth, prompting analysts to raise their stock price targets.

A Macro Look at Meta

CHART 1. WEEKLY CHART OF META. Hovering at record highs, Meta’s uptrend appears to be leaning toward the parabolic side of things, prompting investors to wonder whether such a trajectory is sustainable. The 13-week SMA represents one quarter.Chart source: StockCharts.com. For educational purposes.

Having gone the distance to bounce off its 2022 lows, Meta began outperforming the S&P 500 just this year, now besting the broader market by 37%.

However, before even matching the broader market. Meta’s technicals—as shown by its StockCharts Technical Rank (SCTR) score—have been remarkably strong (with a score above the 90-line) since the end of 2022.

The 13-week simple moving average, representing one quarter, appears to be a consistent proxy for support and resistance. You will want to watch that line when looking at Meta using a weekly chart.

A Near-Term View of Meta’s Price Action

Analyst consensus may be largely bullish, and the Meta AI rollout is prompting Wall Street to raise price targets upward, with some going as high as $610. However, right now, we’re seeing a rectangle pattern and, technically, Meta’s price can go either direction, at least in the near term (see chart below).

CHART 2. DAILY CHART OF META. The momentum, or lack thereof, says a lot. Investors are probably waiting for the META’s next earnings report, scheduled for April 24.Chart source: StockCharts.com. For educational purposes.

Mind the Rectangle: If you’re looking to take action upon a breakout, set a price alert at $481 near the bottom and $531 near the top of the formation.

Mind the Momentum: Fundamental forecasts may be bullish, but the Chaikin Money Flow (CMF) will tell you that selling pressure is currently far greater, though there isn’t that much activity, bullish or bearish, taking place right now. And why not?

Earnings Coming Up: Meta’s last earnings report catapulted the stock to record highs. The next earnings date is on April 24. You’ll likely see more activity occurring close to Meta’s earnings date. So pay close attention to this.

Support Levels: If Meta’s earnings are so-so but not bad enough to invalidate its longer-term bullish thesis (AI rollout), or if its price breaks below the current rectangle formation and the 50-day simple moving average (causing it to trade technically toward the downside), then note the wide support range projected via the Ichimoku Cloud. If the bullish fundamental thesis holds out, buyers will likely jump in within the cloud.

The Bottom Line

Meta’s long-term prospects look bullish, much of which is being driven by the optimistic expectations surrounding its AI rollout, Meta AI. Still, it seems poised for a correction, though its chart formation indicates it can go either way. Watch out for any catalysts that could influence the stock’s trajectory as the next earnings date approaches. And if Meta does take a dip, keep an eye on that cloud, should the bullish fundamental outlook persist.

Disclaimer: This blog is for educational purposes only and should not be construed as financial advice. The ideas and strategies should never be used without first assessing your own personal and financial situation, or without consulting a financial professional.

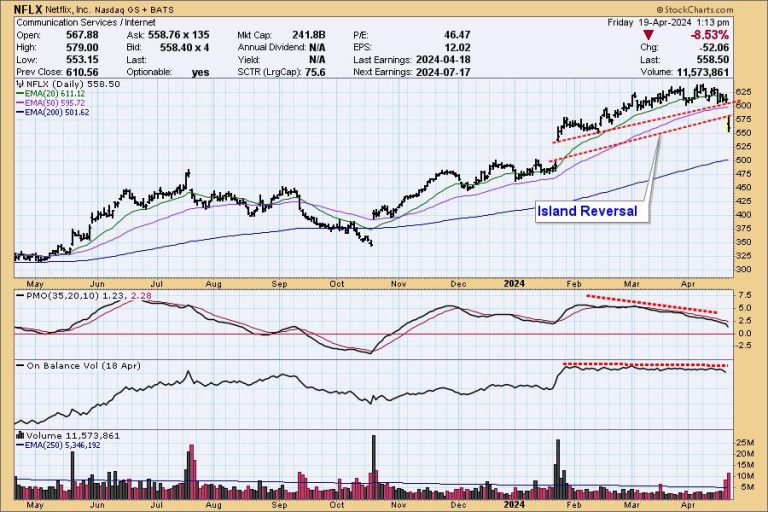
Netflix (NFLX) earnings were released today, and the news was good. . . except for one little thing. They also suspiciously announced that, starting next year, they would no longer be reporting subscriber metrics. That’s like General Motors saying that they will no longer report how many cars and trucks they made. I admit that some other aspect of the report could be a contributing factor for the crash, but let’s look at the technicals.

After the gap up in January, price formed a three-month island that drifted higher, but all was not well technically. The falling PMO formed a negative divergence against the rising price. When the PMO falls above the zero line, it is telling us that the strength behind the up move is diminishing.

Also, the On-Balance Volume (OBV) went flat to slightly falling. OBV usually tracks price, and when it doesn’t, it should attract our attention. In this case, it is suggesting that NFLX is not attracting sufficient volume to justify the rise in price.

Conclusion: Gaps don’t always result in island reversals. For example, there was a gap up in October, following which a very similar island was formed. However, in January price gapped up from that island instead of reversing. In the case of the latest island, OBV sent up the warning flag.

Learn more about DecisionPoint.com:

Watch the latest episode of the DecisionPointTrading Room on DP’s YouTube channel here!

Try us out for two weeks with a trial subscription!

Use coupon code: DPTRIAL2 at checkout!

Technical Analysis is a windsock, not a crystal ball. –Carl Swenlin

(c) Copyright 2024 DecisionPoint.com

Disclaimer: This blog is for educational purposes only and should not be construed as financial advice. The ideas and strategies should never be used without first assessing your own personal and financial situation, or without consulting a financial professional. Any opinions expressed herein are solely those of the author, and do not in any way represent the views or opinions of any other person or entity.

DecisionPoint is not a registered investment advisor. Investment and trading decisions are solely your responsibility. DecisionPoint newsletters, blogs or website materials should NOT be interpreted as a recommendation or solicitation to buy or sell any security or to take any specific action.

Helpful DecisionPoint Links:

Trend Models

Price Momentum Oscillator (PMO)

On Balance Volume

Swenlin Trading Oscillators (STO-B and STO-V)

ITBM and ITVM

SCTR Ranking

Bear Market Rules

The average rate on the popular 30-year fixed mortgage crossed over 7% on April 1, according to Mortgage News Daily, and it just kept going. It now sits right around 7.5%, the highest level since mid-November of last year.

Rates hit their highest level in a few decades last October, causing home sales to grind to a halt. Builders jumped to buy down rates for their customers and managed to do better than existing home sellers.

Rates then fell through mid-January to the mid-6% range and held there into February, causing a surge in home sales. But then they began rising again.

“By mid-February, a pick-up in inflation reset expectations, putting mortgage rates back on an upward trend, and more recent data and comments from Fed Chair [Jerome] Powell have only underscored inflation concerns,” said Danielle Hale, chief economist for Realtor.com. “Sales data over the next few months is likely to reflect the impact of now-higher mortgage rates.”

Even with rates higher, however, mortgage applications to purchase a home rose 5% last week compared with the previous week, according to the Mortgage Bankers Association’s seasonally adjusted index. Demand was still 10% lower than the same week one year ago, even with rates now 70 basis points higher than they were a year ago.

“Despite these higher rates, application activity picked up, possibly as some borrowers decided to act in case rates continue to rise,” said Joel Kan, MBA’s chief economist.

That may be short-lived, however, as affordability weakens even further. While there is more supply on the market now than there was a year ago, it is still at a very low level historically. That has caused homes to move faster as the competition increases. Anyone waiting for rates to drop significantly may be waiting for a while.

“Recent economic data shows that the economy and job market remain strong, which is likely to keep mortgage rates at these elevated levels for the near future,” said Bob Broeksmit, MBA’s president and CEO.

This post appeared first on NBC NEWS

Unionization at Disneyland may no longer be a fairytale, as a majority of approximately 1,700 parades and characters cast members have filed with the NLRB for union representation.

According to a statement from the Actors’ Equity Association, those employees are receiving unionization cards from the group.

‘These performers, and the Hosts, Leads and Trainers who create magic alongside them, know that their lives — as well as the Guest experience at Disneyland — can be improved through collective bargaining,’ Equity President Kate Shindle said. ‘They deserve a voice in their workplace, and meaningful negotiations over wages, benefits and working conditions.’

Cast members dressed as Pluto and Goofy at Disneyland, in Anaheim, Calif., on Nov. 13, 2021.Mark Rightmire / MediaNews Group via Getty Images file

Referring to themselves as ‘Magic United,’ the group of cast members announced their official unionization attempt on February 13, leading to volunteer organizers collecting already signed union authorization cards from coworkers.

Spokespeople for Magic United have been vocal in expressing their desire for a range of quality-of-life improvements in the workplace, such as better pay, scheduling and safety upgrades, benefits and an opportunity to have their voices heard.

‘We love the work we do. We are proud to be a part of one of the greatest legacies in modern entertainment,’ a joint letter from Magic United read. ‘Magic United invites The Walt Disney Company to voluntarily recognize our union and work with us to enhance an essential aspect of Walt Disney’s vision for his theme park — the transcendent magic of live entertainment.’

Magic United has yet to get a response from Disney, but will proceed with efforts to arrange a union election with the NLRB.

This post appeared first on NBC NEWS

The average rate on the popular 30-year fixed mortgage crossed over 7% on April 1, according to Mortgage News Daily, and it just kept going. It now sits right around 7.5%, the highest level since mid-November of last year.

Rates hit their highest level in a few decades last October, causing home sales to grind to a halt. Builders jumped to buy down rates for their customers and managed to do better than existing home sellers.

Rates then fell through mid-January to the mid-6% range and held there into February, causing a surge in home sales. But then they began rising again.

“By mid-February, a pick-up in inflation reset expectations, putting mortgage rates back on an upward trend, and more recent data and comments from Fed Chair [Jerome] Powell have only underscored inflation concerns,” said Danielle Hale, chief economist for Realtor.com. “Sales data over the next few months is likely to reflect the impact of now-higher mortgage rates.”

Even with rates higher, however, mortgage applications to purchase a home rose 5% last week compared with the previous week, according to the Mortgage Bankers Association’s seasonally adjusted index. Demand was still 10% lower than the same week one year ago, even with rates now 70 basis points higher than they were a year ago.

“Despite these higher rates, application activity picked up, possibly as some borrowers decided to act in case rates continue to rise,” said Joel Kan, MBA’s chief economist.

That may be short-lived, however, as affordability weakens even further. While there is more supply on the market now than there was a year ago, it is still at a very low level historically. That has caused homes to move faster as the competition increases. Anyone waiting for rates to drop significantly may be waiting for a while.

“Recent economic data shows that the economy and job market remain strong, which is likely to keep mortgage rates at these elevated levels for the near future,” said Bob Broeksmit, MBA’s president and CEO.

This post appeared first on NBC NEWS

The NHL’s Board of Directors announced Thursday it had approved the establishment of a franchise in Utah, selling the Arizona Coyotes’ existing hockey assets, including its reserve list, roster of players and draft picks to the new Utah team.

The sale renders the Coyotes franchise inactive. Team owner Alex Meruelo retains the right to reactivate the franchise if he can construct a new, state-of-the-art facility up to NHL standards within five years.

“The NHL’s belief in Arizona has never wavered,” commissioner Gary Bettman said in a statement. “We thank Alex Meruelo for his commitment to the franchise and Arizona, and we fully support his ongoing efforts to secure a new home in the desert for the Coyotes. We also want to acknowledge the loyal hockey fans of Arizona, who have supported their team with dedication for nearly three decades while growing the game.”

The team was sold to Smith Entertainment Group, led by Ashley and Ryan Smith, who own the Utah Jazz NBA team. It will play at the Delta Center.

In a statement, Meruelo said it was “simply unfair” to the players, coaches and other stakeholders to play in an arena that is not suitable for NHL games.

All things Coyotes: Latest Arizona Coyotes news, schedule, roster, stats, injury updates and more.

“But this is not the end for NHL hockey in Arizona,” Meruelo said in a statement. “I have negotiated the right to reactivate the team within the next five years, and have retained ownership of the beloved Coyotes name, brand and logo. I remain committed to this community and to building a first-class sports arena and entertainment district without seeking financial support from the public.”

All week, rumors have been swirling about the move. This came weeks after the hockey team announced it would bid on state land in north Phoenix to build an arena and surrounding entertainment district. That auction was set for June 27. Meanwhile, Phoenix Mayor Kate Gallego was trying to line up a meeting with team owners about its plans.

Bettman will hold a news conference with Meruelo on Friday in Arizona and with the Smiths in Salt Lake City later in the day.

“Our intention had always been to pursue an expansion team. Commissioner Bettman conceived and proposed an ingenious plan that would allow us to acquire an NHL franchise while also helping to address and remedy an immediate need of the NHL,’ the Smiths said in a statement. ‘When he approached us and asked us for help resolving this situation, we made the bold decision to introduce a new franchise in Utah, fully understanding that we are stepping up to do something in a time frame and way that has never been done before in professional sports under these circumstances.

“We are committed to building a Stanley Cup contending team and are thrilled to welcome incredible players, coaches, staff, and their families to Utah.’

Ryan Smith told NHL Network that fans had put down 4,000 deposits for season tickets in the first 45 minutes after the announcement.

This will be the first time an NHL team has moved since the Atlanta Thrashers relocated to Winnipeg in 2011.

The Coyotes moved from Winnipeg to Arizona in 1996. They first played in downtown America West Arena, which didn’t have good sightlines for hockey. They played in Glendale, a long drive from the fan base, and most recently at 5,000-seat Mullett Arena. Voters shot down a proposed arena in Tempe.

The Coyotes won their final game at Mullett Arena on Wednesday, beating the Edmonton Oilers 5-2. They finished seventh in the Central Division and missed the playoffs for the 11th time in 12 seasons since they reached the conference final in 2012.

But they improved by 13 points in 2022-23 and by another seven points this season.

The Coyotes’ presence led to a strong youth hockey market in Arizona. NHL star Auston Matthews and Toronto Maple Leafs teammate Matthew Knies are from Arizona.

‘(Arizona) means everything. I grew up here, I played my whole career here,’ Coyotes All-Star Clayton Keller said. ‘There’s so many great people that are in this organization, great teammates, I could go down the list of all the people who made sacrifices for us to perform. It’s definitely tough and hopefully the NHL will be back here in a couple years.’

This post appeared first on USA TODAY