Archive

2024

Browsing

Note to the reader: This is the eighteenth in a series of articles I’m publishing here taken from my book, “Investing with the Trend.” Hopefully, you will find this content useful. Market myths are generally perpetuated by repetition, misleading symbolic connections, and the complete ignorance of facts. The world of finance is full of such tendencies, and here, you’ll see some examples. Please keep in mind that not all of these examples are totally misleading — they are sometimes valid — but have too many holes in them to be worthwhile as investment concepts. And not all are directly related to investing and finance. Enjoy! – Greg

Weight of the Evidence Measures

I have been fond of a weight of the evidence approach for more than 30 years.

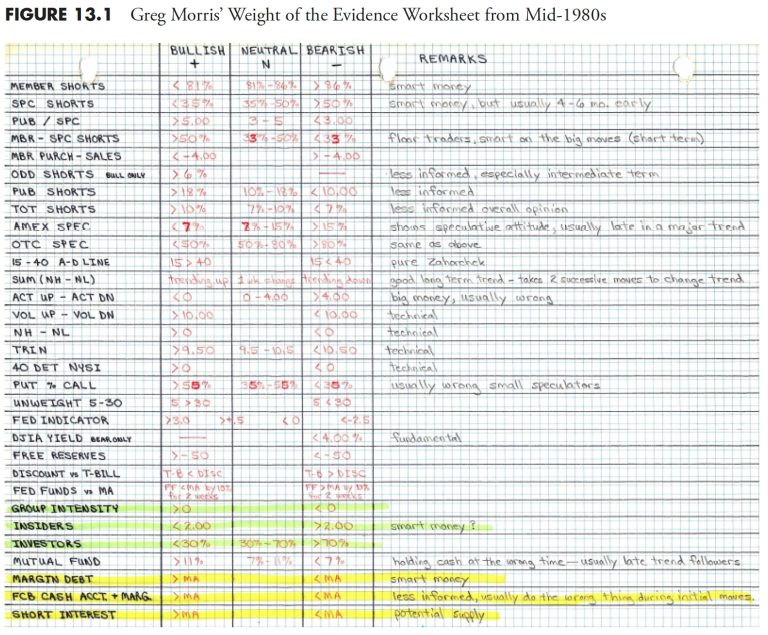
The concept of “weight of the evidence” came from Stan Weinstein, who published the newsletter The Professional Tape Reader and is the author of Secrets for Profiting in Bull and Bear Markets. Back in the early 1980s, most analysis was done manually. We did not have computers, Internet, or e-mail. Our data came from subscriptions or newspapers. I was a religious user of the Barron’s Market Laboratory pages. I was working with Norm North of N-Squared Computing then, designing technical analysis software (yes, it was DOS-based and ran on 5.25″ floppies). Norm had started a database of about 130 items from the market lab pages and, each Saturday, I would go to the nearby hotel, buy a copy of Barron’s, update the database then upload it to CompuServe so our clients could download it—all at the lightning fast speed of 300 baud. I ‘m somewhat of a packrat, and have many ring binders full of charts and notes; Figure 13.1 is the weight of the evidence approach I used back then. Wish I could print like that now.

I have totally stopped using the sentiment measures because I think the data collection process is not reliable. If you have ever taken a survey, especially an unsolicited survey, you can probably guess where I ‘m coming from. However, that does not mean the data isn’t worthwhile—just not for me. There is, however, an excellent service provided by Jason Goepfert called SentimenTrader at www.sentimentrader.com. Jason provided an example of a sentiment indicator that can be used in trend analysis.

Figure 13.2 is the put/call ratio, which tends to trend along with the market. We see a higher average range during bear markets and a lower average range during bull markets. That has changed a little bit over the past decade, as there has been a structural shift to higher put/call ratios—more hedging from nervous investors who have been whacked with two big bear markets. But you can still see the trend in the ratio from a bull market to the next bear market.

I also no longer use any of the NYSE member/specialist data or odd-lot data, as most doesn’t seem as valid today as then. Now, the technical trend-following measures that make up the weight of the evidence consist of price, breadth, and relative strength indicators.

A Note on Optimization

When evaluating indicators to be considered for trend following, you cannot optimize over long-term periods and then just pick the best performing indicator. That is a guarantee of failure, probably quite soon. Optimization is a great process in which to discover areas to avoid, but a poor process to actually determine parameters. If you do try to optimize then please read some good book on the downfalls of doing so. Optimization in the wrong hands is extremely dangerous.

One area of value is to plot all of parameter’s performance and look for plateaus (box) where the parameter performed steadily over a range of similar values. Picking a spike (circle) is the worst thing you can do, as the parameter surrounding the spike are probably closer to where you will see the actual results. See Figure 13.3.

Indicator Evaluation Periods

Indicators need to be evaluated over cyclical bull and bear markets, secular markets, periods covering calendar-based times, randomly selected periods, and almost any other period selection process you want to try. Remember, the goal is to find parameters that meet the needs of the model you are trying to create. You want indicators whose statistics over various times provide the safety and return that you expect of them. Ideally, you want to test the indicators with a certain portion of your data, get the parameters that work well, and then check it on the remaining portion of your data. This is known as in sample and out of sample testing. If the indicator continues to perform on the previously unused data, then you probably have something.

Figure 13.4 shows the Nasdaq Composite Average and the S&P 500 Index. The vertical lines are placed at each low and high that can be used to determine the evaluation periods. You must be careful with this and include the significant peaks and troughs when viewed over the long term. In fact, using a weekly price chart is probably better for this than using a daily price chart.

The remainder of this section covers many of the weight of the evidence indicators (measures) that are good for trend following. These can be separated into three broad categories: price, breadth, and relative strength.

Price-Based Indicators

Price-based means that the indicator is measuring movement in price instruments, whether it be from an index such as the Nasdaq Composite Average, the S&P 500, or from an individual security, such as an ETF, a stock, a mutual fund, and so on. I use the Nasdaq Composite for my price guide because it is a high beta index that contains small caps, mid-caps, large caps, technology, just about everything except financials, and also has some dogs. If you are going to be a trend follower, then you want to follow a price-based index that moves; it doesn’t matter if it is up or down, it just needs to do so in a big way, and the Nasdaq Composite fills the bill.

Price Short Term

The short version of price is more for shorter-term assessment of trendiness. It is simply looking at the price relationship in the 5- to 21-day range. If you were using multiple price measures on the same index, then this is the one that would turn on first and also turn off first; it is the quickest to respond to changes in price direction. Many times, a short-term measure is not actually used in the weight of the evidence calculation, but serves a weight of the evidence model well with an advance warning of things to come.

Price Medium Term

This is another price trend measure that uses a different analytical technique and different look-back period than the Trend Capturing component. This Price Medium measure is basically looking at the price relationships over a three- to four-week period. If the short-term price measure isn’t used, then this is the one that will lead the changed in direction of the index being followed.

Price Long Term

This price trend measure is similar to Price Medium, but looking at the price relationship over a four- to eight-week period. Generally, the Price Medium indicator will turn on first, and, if the trend is sustained, the Price Long measure will turn on, thus providing confirmation of the trend and further building the point total of the cumulative weight of the evidence.

Figure 13.5 is an example of the Price Long measure. Although this is almost too much data on one chart, you can focus on the binary overlay on the top plot and can see that it does a good job of tagging the uptrends, which is all we want it to do.

Figure 13.6 shows the same price measure as the one above, just a smaller timeframe. It becomes much clearer that the binary line overlaid on the top price data moves in conjunction with the indicator in the bottom plot, the price long measure. Whenever the price long indicator moves above the horizontal line, the binary moves to the top, and whenever the price long drops below the horizontal line, the binary drops back to the bottom. You can then see that whenever the binary is at the top, it is signaling an uptrend, and whenever it is at the bottom it is signaling no uptrend (down trend or sideways). This concept is quite valuable since it allows you to view only the binary to know what the indicator is doing.

So is this indicator perfect? Of course not, you can see there was a whipsaw signal (short and wrong, but also quickly reversed) near the right center of the chart where the binary was at the top for only a very short period of time. As I have said before and will no doubt say again, I know these measures will be wrong at times, but they are not going to stay wrong because they react to the market. Because these indicators are all trend following, they will reverse a wrong direction almost as fast as they identify it in the first place. That is exactly what you want them to do and it is also why I use a weight of the evidence approach, which means I rely on a basket of technical measures. Sort of a democratic approach, if you will.

Table 13.1 is an example of the detailed research behind each of the various indicators used in the weight of the evidence. This example is over the period from 1980 to 2012; however, it should be run over many different periods (see Figure 13.4) to find consistency.

Here is an explanation of the various parameters in Table 13.1:

Parameter. These are the variable parameters used to test the indicator’s usefulness in identifying trends. They can be discovered by optimization, or just a visual analysis of the indicator. They are then spread about to cover a wide range of analysis for the indicator.Winning years. The percentage of years that the trading ended higher than the close from the previous year.Trades per year. This is the number of closed trades per year.Average return per year. Determined by looking at the total return for the entire run, and then dividing it by the number of years.Total return. The total return from the system using the selected parameter.Compounded annual return. The gain each year that would be required in order to achieve the total gain for the analysis period.Compounded annual return while invested. The annual gain that would be required to achieve the total gain, excluding cash positions, over the period being analyzed.Percentage of time invested. The percentage of time that actual trades were placed and not in cash.Ulcer index. A measure of downside volatility also covered in the ranking measure section of this book.Largest trade loss. A single trade that resulted in the largest loss.Maximum drawdown. The maximum decline of the system measured from the highest level that the system had reached. Keep in mind this is a one-time isolated event.Ulcer performance index. The compounded annual return divided by the Ulcer index, this is a performance measure similar to the Sharp ratio, the Sortino ratio, and the Treynor ratio. All are risk-adjusted measures of performance.

Although the calculation of all the various measures of an indicator’s ability to work over a vast number of trials and time segments, one still has to determine “Where’s the beef?” Of all that data generated, shouldn’t you list the categories from best to worst inasmuch as their contribution to what you looking for? I think so, definitely so. One method, and the one I use, is to ask some sharp folks who are deeply familiar with the indicator and the output to give me their input as to the order in which the parameter analysis should be viewed. And to keep this as a robust process, it is done each year. Often, there isn’t much change, but sometimes someone gets a more involved feeling after working with these almost every day as to which is more important than another. Sometimes the overall relative ranking of these gets changed.

Table 13.2 shows that each column of data is ranked based on its relative importance as determined by the individuals involved in the portfolio management process. This relative input is then weighted based on the level it has reached in the vetting process. There is an old forecasting axiom that says the average of all estimates is probably going to work better than trying to select the single best guess.

Note: The columns with Inverted at the top mean that the smaller the value, the better it is performing.

The relative ranking is then placed alongside the parameter output to see where the current parameter being used is, and followed immediately by the ranking of the output components shown in the first column of Table 13.2. This process allows you to see how the parameters change over time compared to the one currently in use. Note that the parameters in the first column of Table 13.1 are in numerical order, so, while this is a change in the relative ranking, if the change in the parameter is small, then generally no changes will be made to the parameter in this weight of the evidence indicator. However, it will be watched over time and, if there is an obvious drift away from the parameter being used, a change will be considered.

The above performance statistical information provided for the price long weight of the evidence will not be included in all of the indicators that are used, as this section would get overly long. However, when something stands out that will provide additional insight into this process; the information will definitely be shown. However, do not fear; a chart or two will be shown for each measure.

Risk Price Trend

The risk price trend is in the lower plot of Figure 13.7, while the top plot is the Nasdaq Composite and the risk price trend binary. This measure uses the MACD concept with considerably longer parameters for both the short- and long components. You can see from the binary that it does a relatively good job of picking out the trends of the market.

Adaptive Trend

The adaptive trend measure incorporates the most recent 21 days of market data to compute volatility based on an average true range methodology. This process always considers the previous day’s close price in the current day’s high low range to ensure we are using days that gap either up or down to their fullest benefit. When the price is trading above the adaptive trend, a positive signal is generated, and when below, a negative signal is in place. This is clearly shown in Figure 13.8, with the adaptive trend binary overlaid on the price chart at top. Whenever the binary is at the top, it is showing an uptrend, and when at the bottom, a downtrend.

Breadth-Based Indicators

Breadth contributes significantly to trend analysis and is thoroughly described in this chapter and the Appendix. Breadth-based indicators offer an unweighted view of market action, a valuable view that is often obscured by price or capitalization weighted indices.

Advances/Declines

The advance/decline component measures the relationship of advancing issues to declining issues. Advancing issues outnumbering declining issues is a positive event, as more participation is taking place in the equity markets. However, an inverse relationship (decliners outnumber advancers) would be a clear sign of weakness to a price movement.

There was an example of the clear divergence in the price movement and market internal movement during much of 2007, and particularly in the fourth quarter of 2007. From early October 2007 to late October 2007, we saw a distinct positive price trend while the advance decline measure was rapidly declining. By late October, the markets were reaching all time new highs. What you were reading and hearing in the news was all positive, “The market reached an all-time new high.” According to the price movement, things couldn’t have looked better. However, the advance/decline measure was telling us a very different story, as declining issues continued to outnumber advancing issues. This forewarning was signaling increased risk, as the upward price movement was not being supported by broad participation. At that time, the advance/decline component was negative; hence, it was not contributing to the weight of the evidence total. Divergences can cue us to be prepared in the event the price action reverses rapidly. In fact, that is exactly what happened, and it was the beginning of the 2007 to 2009 bear market.

Figure 13.9 shows the deterioration in the advance decline measure in 2007. You can see that while the market was reaching new highs, the advance decline measure never even got back up to its horizontal signal line. Breadth does this time and time again. It almost always leaves the party early and is a great tool to have in your arsenal as a trend follower.

Figure 13.10 is the same indicator, but plotted with the same data used throughout this section, so cross reference is easier.

Up Volume/Down Volume

This Breadth measure gives us an internal look at the volume behind the price action by looking at the relationship of the volume in advancing issues versus the volume in declining issues. Again, by removing the capitalization weighting of the price movement that can drive the index price, this measure gives us an internal view of what is going on behind a price movement. Generally, if there is strong up volume relative to down volume, it is a positive sign that the positive price movement is being supported. However, if there is positive price movement, but down volume is greater than up volume, it is a sign that the price movement lacks participating volume. In this case, the up volume/down volume measure would not contribute to the weight of the evidence, leading to a lower total level signaling increased risk.

Figure 13.11 is the up volume/down volume weight of the evidence measure. You might notice that the signal line (horizontal line) is not at zero like many use, but, in this case, it is at +400. The parameter analysis identified that this was a significantly better signal level. You can see that the up and down volume has been quite weak since and before the peak in prices, which occurred in the middle of the time period shown.

New Highs/New Lows

The High/Low Breadth measure looks at the relationship between issues reaching new 52-week new high values to issues hitting new 52-week new low values. Generally, when the number of issues reaching new 52-week highs are outpacing the number reaching new 52-week lows, there is a positive indication in support of positive price action. The flip side of more new lows to new highs is a negative indication, and this lets us know that there is potential risk that the price action and prices could possibly turn quickly in the other direction. When this indicator is on, we have internal support for positive price movement, and it adds to the point value of the weight of the evidence.

This weight of the evidence measure is a little different than the previous ones, in that signals are generated by the crossing of the indicator’s moving average shown in Figure 13.12 the bottom plot as the dotted line. You can see the binary in the top plot makes seeing these crossings quite easy.

Breadth Combination Measure

The combination breadth measure (Figure 13.13) uses advancing and declining issues, as well as advancing volume and declining volume, by weighting the significant volume days inside of the indicator. This component serves to underweight insignificant price movements if the volume is weak, while weighting the more significant price movements when volume is significant. This measure was created out of concern for days such as the Friday that follows Thanksgiving, a partial day of trading, and always with very low volume. The downside of using breadth is that it does not matter if the day is shortened or the trading is light; you will always end up with a full complement of breadth data. Remember, breadth does not measure magnitude directly, only direction. In this measure, when the up volume is below a predetermined moving average, then only the advances are used. If the up volume is above this average, then the product of advances and up volume is used. The same concept is applied to the declines and the down volume.

Breadth Is Not Always Internal Data

There are a number of breadth-based measures that do not use internal market data such as advances, declines, up volume, down volume, new highs, or new lows. A concept known as the Percent Participation Index is used by many analysts. The concept is simple, yet revealing: it measures the number of stocks in an index as to where they are relative to their moving average. For example, many use a 200-day Participation Index, which shows the percent of stocks that make up the index that are above their own 200-day moving average.

Figure 13.14 shows the Nasdaq Composite in the top plot with its 200-day simple moving average. The bottom plot is the 200-day participation index, which shows the percentage of all Nasdaq Composite stocks that are above their respective 200-day simple moving averages.

Figure 13.15 is similar to the previous one, except that it shows the 50-day participation index.

Slope of Moving Average

A longer-term big picture measure of market movements can be accomplished by calculating the slope of a moving average, in this case the 252-day moving average. This is the type of market measure that can be used as a filter for parameter changes. For example, whenever the histogram in the lower plot of Figure 13.16 is above the zero line, the stops can be looser, the buying requirements can be looser, and even other market measure parameters could be lengthened. If it is below the horizontal line, then revert back to the tighter set of parameters.

World Market Climate

This is a breadth measure that uses a basket of international indices and their respective moving average relationship. For this example, this measure uses a basket of international stock market indices and their 50-day exponential average. The measure is bounded between zero and 100 because all that is being done is determining the percentage of the basket of indices that are above their 50-day exponential average. Complementarily, this will also tell you the percent below their 50-day moving average. Figure 13.17 has the World Market Climate shown in the top plot with lines drawn at 80%, 50%, and 30%. The bottom plot is the MSCI EAFE Index, which is a broad-based international index using markets from Europe, Australasia, and the Far East. Australasia is Australia, New Guinea, New Zealand, and their neighboring islands. Clearly the goal of EAFE is to include a broad international exposure outside North America. The EAFE in the bottom plot is shown with a 200-day exponential moving average, just for reference.

Cyclical Market Measure

 This measure looks for longer-term price trends to identify cyclical bull or bear environments. For this example, I use the basket of international markets discussed in the previous measure. The concept is unique, yet simple; it measures the direction of longer-term averages and uses a filter of 0.05% before a reversal of the average is identified. Figure 13.18 shows the Cyclical Market Measure in the top plot, with a horizontal line at 50% and the MSCI EAFE Index in the bottom plot with a 126-day simple moving average. One could use any values for the length of the moving average, both for the smoothing of the EAFE in the lower plot to the calculation of trending percentage that makes up the Cyclical Market Measure.

Thanks for reading this far. I intend to publish one article in this series every week. Can’t wait? The book is for sale here.

Last week, investors were spooked by geopolitical tensions and expectations of interest rates remaining higher for longer. The fear sent investors selling equities, resulting in the broader indexes breaking below their upward trendlines. This week, the market looked like it could be bouncing, and many investors wondered if it would bounce back.

So is this a good time to pick up some stocks? It may seem tempting, but the market looks indecisive. At such times, it’s best to tread with caution.

This week is a big earnings week, with big tech companies reporting; if these are weak, they could hurt the stock market. We saw this unfold when Meta Platforms (META) reported earnings on Wednesday after the close. Even though META’s earnings and revenues beat expectations, the stock price dropped like a rock on disappointing Q2 guidance. This spilled into other stocks, and the major indexes continued their downward fall.

Another data point dampening investor optimism was the Q1 GDP, which was well below economic forecasts. The broader indexes were all lower and approaching Friday’s close. But the market bounced back, and positive earnings reports from Microsoft (MSFT) and Alphabet (GOOGL) added a dose of optimism. A key area to watch is where the indexes will close relative to last week. A positive sign would be if they stay above Friday’s close.

What does all of this mean for the market, going forward?

The Pullback Play in SPY

View the live chart.

Let’s take a closer look at the daily chart of SPDR S&P 500 ETF (SPY). The ETF has been trading above its 50-day simple moving average (SMA) since November 2023 and has been moving in a pretty steady uptrend (red dashed line) until early April 2024, when its value fell below the trendline. Since the breakdown, SPY has been trading in a downward channel. This week’s bounce took it to the top end of the downward channel.

CHART 1. DAILY CHART OF SPY. The ETF looks like it wants to move higher, but it’s still trading within its downward channel. SPY is also moving out of its oversold territory, although it could quickly turn lower.Chart source: StockCharts.com. For educational purposes.

The following three scenarios could play out:

SPY could continue to bounce around in the downward price channel for longer.It could break out above the channel and set up for a reversal.It could break down below the lower channel line and fall towards its next support level.

It’s helpful to add an indicator that helps determine if the market is oversold or overbought. In this example, the Stochastic Oscillator (lower panel) is applied. It shows that SPY was in oversold territory after Friday’s close, but is now out of that area, although it could easily and quickly turn lower and go back below 20.

View the live chart.

If you look up the weekly chart of SPY (see below), the uptrend looks like it’s still in play. SPY is trading above its 50-day SMA and is no longer in overbought territory (see Stochastic Oscillator in lower panel). Although SPY has broken below the shorter-term trendline, the pullback looks much healthier than in the daily chart.

CHART 2. WEEKLY CHART OF SPY. Over the long-term, SPY’s uptrend still looks in play. If it dips below its 50-day SMA and the Stochastic Oscillator sinks into oversold territory, there may be reason to be concerned.Chart source: StockCharts.com. For educational purposes.

The market’s behavior changes from day to day, and right now it looks like any bad news hurts the equity indexes. If you’re trying to decide whether to unload some of your positions or considering adding new positions to your portfolio, it’s best to exercise patience and wait for the market to decide which way it’s going to go.

Set up a ChartList with the indexes or their ETF proxies and sector ETFs—DIA, QQQ, SPY, XLK, etc. Annotate the lines in the sand (trendlines, support/resistance lines, significant highs/lows) and view them as a CandleGlance so you can see all the charts simultaneously.

FIGURE 3. HOW TO VIEW CHARTLISTS. There are different ways to view your ChartLists. CandleGlance helps you view all charts simultaneously, giving you a bird’s eye view of stock market action.Chart source: StockCharts.com. For educational purposes.

This helps to identify which ETFs are breaking above strong resistance levels and which are breaking below support levels. Anything can change the market’s narrative, so watch the action closely.

Disclaimer: This blog is for educational purposes only and should not be construed as financial advice. The ideas and strategies should never be used without first assessing your own personal and financial situation, or without consulting a financial professional.

With the economy humming along and the stock market, despite some recent twists and turns, hanging in there pretty well, it’s a tough case to sell that higher interest rates are having a substantially negative impact on the economy.

So what if policymakers just decide to keep rates where they are for even longer, and go through all of 2024 without cutting?

It’s a question that, despite the current conditions, makes Wall Street shudder and Main Street queasy as well.

“When rates start climbing higher, there has to be an adjustment,” said Quincy Krosby, chief global strategist at LPL Financial. “The calculus has changed. So the question is, are we going to have issues if rates remain higher for longer?”

The higher-for-longer stance was not what investors were expecting at the beginning of 2024, but it’s what they have to deal with now as inflation has proven stickier than expected, hovering around 3% compared with the Federal Reserve’s 2% target.

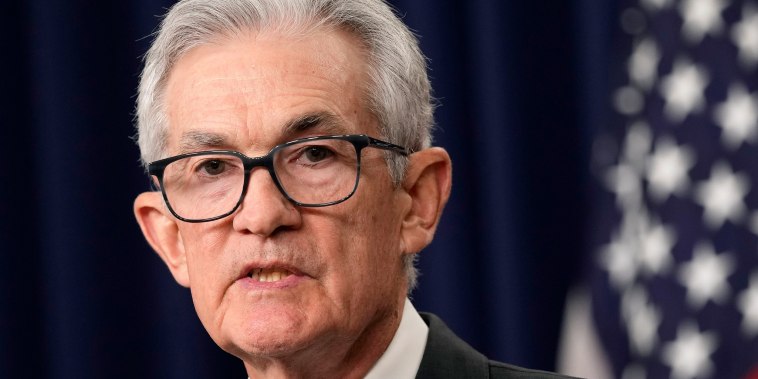
Recent statements by Fed Chair Jerome Powell and other policymakers have cemented the notion that rate cuts aren’t coming in the next several months. In fact, there even has been talk about the potential for an additional hike or two ahead if inflation doesn’t ease further.

That leaves big questions over when exactly monetary policy easing will come, and what the central bank’s position to remain on hold will do to both financial markets and the broader economy.

Krosby said some of those answers will come soon as the current earnings season heats up. Corporate officers will provide key details beyond sales and profits, including the impact that interest rates are having on profit margins and consumer behavior.

“If there’s any sense that companies have to start cutting back costs and that leads to labor market trouble, this is the path of a potential problem with rates this high,” Krosby said.

But financial markets, despite a recent 5.5% sell-off for the S&P 500, have largely held up amid the higher-rate landscape. The broad market, large-cap index is still up 6.3% year to date in the face of a Fed on hold, and 23% above the late October 2023 low.

History tells differing stories about the consequences of a hawkish Fed, both for markets and the economy.

Higher rates are generally a good thing so long as they’re associated with growth. The last period when that wasn’t true was when then-Fed Chair Paul Volcker strangled inflation with aggressive hikes that ultimately and purposely tipped the economy into recession.

There is little precedent for the Fed to cut rates in robust growth periods such as the present, with gross domestic product expected to accelerate at a 2.4% annualized pace in the first quarter of 2024, which would mark the seventh consecutive quarter of growth better than 2%. Preliminary first-quarter GDP numbers are due to be reported Thursday.

For the past several decades, higher rates have not been linked to recessions.

On the contrary, Fed chairs have often been faulted for keeping rates too low for too long, leading to the dot-com bubble and subprime market implosions that triggered two of the three recessions this century. In the other one, the Fed’s benchmark funds rate was at just 1% when the Covid-induced downturn occurred.

In fact, there are arguments that too much is made of Fed policy and its broader impact on the $27.4 trillion U.S. economy.

“I don’t think that active monetary policy really moves the economy nearly as much as the Federal Reserve thinks it does,” said David Kelly, chief global strategist at J.P. Morgan Asset Management.

Kelly points out that the Fed, in the 11-year run between the financial crisis and the Covid pandemic, tried to bring inflation up to 2% using monetary policy and mostly failed. Over the past year, the pullback in the inflation rate has coincided with tighter monetary policy, but Kelly doubts the Fed had much to do with it.

Other economists have made a similar case, namely that the main issue that monetary policy influences — demand — has remained robust, while the supply issue that largely operates outside the reach of interest rates has been the principle driver behind decelerating inflation.

Where rates do matter, Kelly said, is in financial markets, which in turn can affect economic conditions.

“Rates too high or too low distort financial markets. That ultimately undermines the productive capacity of the economy in the long run and can lead to bubbles, which destabilizes the economy,” he said.

“It’s not that I think they’ve set rates at the wrong level for the economy,” he added. “I do think the rates are too high for financial markets, and they ought to try to get back to normal levels — not low levels, normal levels — and keep them there.”

As a matter of policy, Kelly said that would translate into three quarter-percentage point rate cuts this year and next, taking the fed funds rate down to a range of 3.75%-4%. That’s about in line with the 3.9% rate at the end of 2025 that Federal Open Market Committee members penciled in last month as part of their “dot-plot” projections.

Futures market pricing implies a fed funds rate of 4.32% by December 2025, indicating a higher rate trajectory.

While Kelly is advocating for “a gradual normalization of policy,” he does think the economy and markets can withstand a permanently higher level of rates.

In fact, he expects the Fed’s current projection of a “neutral” rate at 2.6% is unrealistic, an idea that is gaining traction on Wall Street. Goldman Sachs, for instance, recently has opined that the neutral rate — neither stimulative nor restrictive — could be as high as 3.5%. Cleveland Fed President Loretta Mester also recently said it’s possible that the long-run neutral rate is higher.

That leaves expectations for Fed policy tilting toward cutting rates somewhat but not going back to the near-zero rates that prevailed in the years after the financial crisis.

In fact, over the long run, the fed funds rate going back to 1954 has averaged 4.6%, even given the extended seven-year run of near-zero rates after the 2008 crisis until 2015.

One thing that has changed dramatically, though, over the decades has been the state of public finances.

The $34.6 trillion national debt has exploded since Covid hit in March 2020, rising by nearly 50%. The federal government is on track to run a $2 trillion budget deficit in fiscal 2024, with net interest payments thanks to those higher interest rates on pace to surpass $800 billion.

The deficit as a share of GDP in 2023 was 6.2%; by comparison, the European Union allows its members only 3%.

The fiscal largesse has juiced the economy enough to make the Fed’s higher rates less noticeable, a condition that could change in the days ahead if benchmark rates hold high, said Troy Ludtka, senior U.S. economist at SMBC Nikko Securities America.

“One of the reasons why we haven’t noticed this monetary tightening is simply a reflection of the fact that the U.S. government is running its most irresponsible fiscal policy in a generation,” Ludtka said. “We’re running massive deficits into a full-employment economy, and that’s really keeping things afloat.”

However, the higher rates have begun to take their toll on consumers, even if sales remain solid.

Credit card delinquency rates climbed to 3.1% at the end of 2023, the highest level in 12 years, according to Fed data. Ludtka said the higher rates are likely to result in a “retrenchment” for consumers and ultimately a “cliff effect” where the Fed ultimately will have to concede and lower rates.

“So, I don’t think they should be cutting anytime in the immediate future. But at some point that’s going to have to happen, because these interest rates are simply crushing particularly low-income-earning Americans,” he said. “That is a big portion of the population.”

This post appeared first on NBC NEWS

Walmart’s majority-owned fintech startup One has begun offering buy now, pay later loans for big-ticket items at some of the retailer’s more than 4,600 U.S. stores, CNBC has learned.

The move puts One in direct competition with Affirm, the BNPL leader and exclusive provider of installment loans for Walmart customers since 2019. It’s a relationship that the Bentonville, Arkansas, retailer expanded recently, introducing Affirm as a payment option at Walmart self-checkout kiosks.

It also likely signals that a battle is brewing in the store aisles and ecommerce portals of America’s largest retailer. At stake is the role of a wide spectrum of players, from fintech firms to card companies and established banks.

One’s push into lending is the clearest sign yet of its ambition to become a financial superapp, a mobile one-stop shop for saving, spending and borrowing money.

Since it burst onto the scene in 2021, luring Goldman Sachs veteran Omer Ismail as CEO, the fintech startup has intrigued and threatened a financial landscape dominated by banks — and poached talent from more established lenders and payments firms.

But the company, based out of a cramped Manhattan WeWork space, has operated mostly in stealth mode while developing its early products, including a debit account released in 2022.

Now, One is going head-to-head with some of Walmart’s existing partners like Affirm who helped the retail giant generate $648 billion in revenue last year.

On a recent visit by CNBC to a New Jersey Walmart location, ads for both One and Affirm vied for attention among the Apple products and Android smartphones in the store’s electronics section.

Offerings from both One and Affirm were available at checkout, and loans from either provider were available for purchases starting at around $100 and costing as much as several thousand dollars at an annual interest rate of between 10% to 36%, according to their respective websites.

Electronics, jewelry, power tools and automotive accessories are eligible for the loans, while groceries, alcohol and weapons are not.

Buy now, pay later has gained popularity with consumers for everyday items as well as larger purchases. From January through March of this year, BNPL drove $19.2 billion in online spending, according to Adobe Analytics. That’s a 12% year-over-year increase.

Walmart and One declined to comment for this article.

One’s expanding role at Walmart raises the possibility that the company could force Affirm, Capital One and other third parties out of some of the most coveted partnerships in American retail, according to industry experts.

“I have to imagine the goal is to have all this stuff, whether it’s a credit card, buy now, pay later loans or remittances, to have it all unified in an app under a single brand, delivered online and through Walmart’s physical footprint,” said Jason Mikula, a consultant formerly employed at Goldman’s consumer division.

Affirm declined to comment about its Walmart partnership.

For Walmart, One is part of its broader effort to develop new revenue sources beyond its retail stores in areas including finance and health care, following rival Amazon’s playbook with cloud computing and streaming, among other segments. Walmart’s newer businesses have higher margins than retail and are a part of its plan to grow profits faster than sales.

In February, Walmart said it was buying TV maker Vizio for $2.3 billion to boost its advertising business, another growth area for the retailer.

When it comes to finance, One is just Walmart’s latest attempt to break into the banking business. Starting in the 1990s, Walmart made repeated efforts to enter the industry through direct ownership of a banking arm, each time getting blocked by lawmakers and industry groups concerned that a “Bank of Walmart” would crush small lenders and squeeze big ones.

To sidestep those concerns, Walmart adopted a more arms-length approach this time around. For One, the retailer created a joint venture with investment firm firm Ribbit Capital — known for backing fintech firms including Robinhood, Credit Karma and Affirm — and staffed the business with executives from across finance.

Walmart has not disclosed the size of its investment in One.

The startup has said that it makes decisions independent of Walmart, though its board includes Walmart U.S. CEO, John Furner, and its finance chief, John David Rainey.

One doesn’t have a banking license, but partners with Coastal Community Bank for the debit card and installment loans.

After its failed early attempts in banking, Walmart pursued a partnership strategy, teaming up with a constellation of providers, including Capital One, Synchrony, MoneyGram, Green Dot, and more recently, Affirm. Leaning on partners, the retailer opened thousands of physical MoneyCenter locations within its stores to offer check cashing, sending and receiving payments, and tax services.

But Walmart and One executives have made no secret of their ambition to become a major player in financial services by leapfrogging existing players with a clean-slate effort.

One’s no-fee approach is especially relevant to low- and middle-income Americans who are “underserved financially,” Rainey, a former PayPal executive, noted during a December conference.

“We see a lot of that customer demographic, so I think it gives us the ability to participate in this space in maybe a way that others don’t,” Rainey said. “We can digitize a lot of the services that we do physically today. One is the platform for that.”

One could generate roughly $1.6 billion in annual revenue from debit cards and lending in the near term, and more than $4 billion if it expands into investing and other areas, according to Morgan Stanley.

Walmart can use its scale to grow One in other ways. It is the largest private employer in the U.S. with about 1.6 million employees, and it already offers its workers early access to wages if they sign up for a corporate version of One.

There are signs that One is making a deeper push into lending beyond installment loans.

Walmart recently prevailed in a legal dispute with Capital One, allowing the retailer to end its credit-card partnership years ahead of schedule. Walmart sued Capital One last year, alleging that its exclusive partnership with the card issuer was void after it failed to live up to contractual obligations around customer service, assertions that Capital One denied.

The lawsuit led to speculation that Walmart intends to have One take over management of the retailer’s co-branded and store cards. In fact, in legal filings Capital One itself alleged that Walmart’s rationale was less about servicing complaints and more about moving transactions to a company it owns.

“Upon information and belief, Walmart intends to offer its branded credit cards through One in the future,” Capital One said last year in response to Walmart’s suit. “With One, Walmart is positioning itself to compete directly with Capital One to provide credit and payment products to Walmart customers.”

Capital One said last month that it could appeal the decision. The company declined to comment further.

Meanwhile, Walmart said last year when its lawsuit became public that it would soon announce a new credit card option with “meaningful benefits and rewards.”

One has obtained lending licenses that allow it to operate in nearly every U.S. state, according to filings and its website. The company’s app tells users that credit building and credit score monitoring services are coming soon.

And while One’s expansion threatens to supersede Walmart’s existing financial partners, Walmart’s efforts could also be seen as defensive.

Fintech players including Block’s Cash App, PayPal and Chime dominate account growth among people who switch bank accounts and have made inroads with Walmart’s core demographic. The three services made up 60% of digital player signups last year, according to data and consultancy firm Curinos.

But One has the advantage of being majority owned by a company whose customers make more than 200 million visits a week.

It can offer them enticements including 3% cashback on Walmart purchases and a savings account that pays 5% interest annually, far higher than most banks, according to customer emails from One.

Those terms keep customers spending and saving within the Walmart ecosystem and helps the retailer better understand them, Morgan Stanley analysts said in a 2022 research note.

“One has access to Walmart’s sizable and sticky customer base, the largest in retail,” the analysts wrote. “This captive and underserved customer base gives One a leg up vs. other fintechs.”

This post appeared first on NBC NEWS

With the economy humming along and the stock market, despite some recent twists and turns, hanging in there pretty well, it’s a tough case to sell that higher interest rates are having a substantially negative impact on the economy.

So what if policymakers just decide to keep rates where they are for even longer, and go through all of 2024 without cutting?

It’s a question that, despite the current conditions, makes Wall Street shudder and Main Street queasy as well.

“When rates start climbing higher, there has to be an adjustment,” said Quincy Krosby, chief global strategist at LPL Financial. “The calculus has changed. So the question is, are we going to have issues if rates remain higher for longer?”

The higher-for-longer stance was not what investors were expecting at the beginning of 2024, but it’s what they have to deal with now as inflation has proven stickier than expected, hovering around 3% compared with the Federal Reserve’s 2% target.

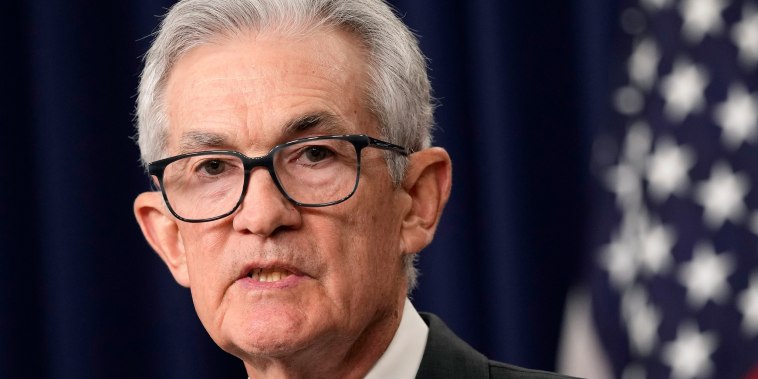
Recent statements by Fed Chair Jerome Powell and other policymakers have cemented the notion that rate cuts aren’t coming in the next several months. In fact, there even has been talk about the potential for an additional hike or two ahead if inflation doesn’t ease further.

That leaves big questions over when exactly monetary policy easing will come, and what the central bank’s position to remain on hold will do to both financial markets and the broader economy.

Krosby said some of those answers will come soon as the current earnings season heats up. Corporate officers will provide key details beyond sales and profits, including the impact that interest rates are having on profit margins and consumer behavior.

“If there’s any sense that companies have to start cutting back costs and that leads to labor market trouble, this is the path of a potential problem with rates this high,” Krosby said.

But financial markets, despite a recent 5.5% sell-off for the S&P 500, have largely held up amid the higher-rate landscape. The broad market, large-cap index is still up 6.3% year to date in the face of a Fed on hold, and 23% above the late October 2023 low.

History tells differing stories about the consequences of a hawkish Fed, both for markets and the economy.

Higher rates are generally a good thing so long as they’re associated with growth. The last period when that wasn’t true was when then-Fed Chair Paul Volcker strangled inflation with aggressive hikes that ultimately and purposely tipped the economy into recession.

There is little precedent for the Fed to cut rates in robust growth periods such as the present, with gross domestic product expected to accelerate at a 2.4% annualized pace in the first quarter of 2024, which would mark the seventh consecutive quarter of growth better than 2%. Preliminary first-quarter GDP numbers are due to be reported Thursday.

For the past several decades, higher rates have not been linked to recessions.

On the contrary, Fed chairs have often been faulted for keeping rates too low for too long, leading to the dot-com bubble and subprime market implosions that triggered two of the three recessions this century. In the other one, the Fed’s benchmark funds rate was at just 1% when the Covid-induced downturn occurred.

In fact, there are arguments that too much is made of Fed policy and its broader impact on the $27.4 trillion U.S. economy.

“I don’t think that active monetary policy really moves the economy nearly as much as the Federal Reserve thinks it does,” said David Kelly, chief global strategist at J.P. Morgan Asset Management.

Kelly points out that the Fed, in the 11-year run between the financial crisis and the Covid pandemic, tried to bring inflation up to 2% using monetary policy and mostly failed. Over the past year, the pullback in the inflation rate has coincided with tighter monetary policy, but Kelly doubts the Fed had much to do with it.

Other economists have made a similar case, namely that the main issue that monetary policy influences — demand — has remained robust, while the supply issue that largely operates outside the reach of interest rates has been the principle driver behind decelerating inflation.

Where rates do matter, Kelly said, is in financial markets, which in turn can affect economic conditions.

“Rates too high or too low distort financial markets. That ultimately undermines the productive capacity of the economy in the long run and can lead to bubbles, which destabilizes the economy,” he said.

“It’s not that I think they’ve set rates at the wrong level for the economy,” he added. “I do think the rates are too high for financial markets, and they ought to try to get back to normal levels — not low levels, normal levels — and keep them there.”

As a matter of policy, Kelly said that would translate into three quarter-percentage point rate cuts this year and next, taking the fed funds rate down to a range of 3.75%-4%. That’s about in line with the 3.9% rate at the end of 2025 that Federal Open Market Committee members penciled in last month as part of their “dot-plot” projections.

Futures market pricing implies a fed funds rate of 4.32% by December 2025, indicating a higher rate trajectory.

While Kelly is advocating for “a gradual normalization of policy,” he does think the economy and markets can withstand a permanently higher level of rates.

In fact, he expects the Fed’s current projection of a “neutral” rate at 2.6% is unrealistic, an idea that is gaining traction on Wall Street. Goldman Sachs, for instance, recently has opined that the neutral rate — neither stimulative nor restrictive — could be as high as 3.5%. Cleveland Fed President Loretta Mester also recently said it’s possible that the long-run neutral rate is higher.

That leaves expectations for Fed policy tilting toward cutting rates somewhat but not going back to the near-zero rates that prevailed in the years after the financial crisis.

In fact, over the long run, the fed funds rate going back to 1954 has averaged 4.6%, even given the extended seven-year run of near-zero rates after the 2008 crisis until 2015.

One thing that has changed dramatically, though, over the decades has been the state of public finances.

The $34.6 trillion national debt has exploded since Covid hit in March 2020, rising by nearly 50%. The federal government is on track to run a $2 trillion budget deficit in fiscal 2024, with net interest payments thanks to those higher interest rates on pace to surpass $800 billion.

The deficit as a share of GDP in 2023 was 6.2%; by comparison, the European Union allows its members only 3%.

The fiscal largesse has juiced the economy enough to make the Fed’s higher rates less noticeable, a condition that could change in the days ahead if benchmark rates hold high, said Troy Ludtka, senior U.S. economist at SMBC Nikko Securities America.

“One of the reasons why we haven’t noticed this monetary tightening is simply a reflection of the fact that the U.S. government is running its most irresponsible fiscal policy in a generation,” Ludtka said. “We’re running massive deficits into a full-employment economy, and that’s really keeping things afloat.”

However, the higher rates have begun to take their toll on consumers, even if sales remain solid.

Credit card delinquency rates climbed to 3.1% at the end of 2023, the highest level in 12 years, according to Fed data. Ludtka said the higher rates are likely to result in a “retrenchment” for consumers and ultimately a “cliff effect” where the Fed ultimately will have to concede and lower rates.

“So, I don’t think they should be cutting anytime in the immediate future. But at some point that’s going to have to happen, because these interest rates are simply crushing particularly low-income-earning Americans,” he said. “That is a big portion of the population.”

This post appeared first on NBC NEWS

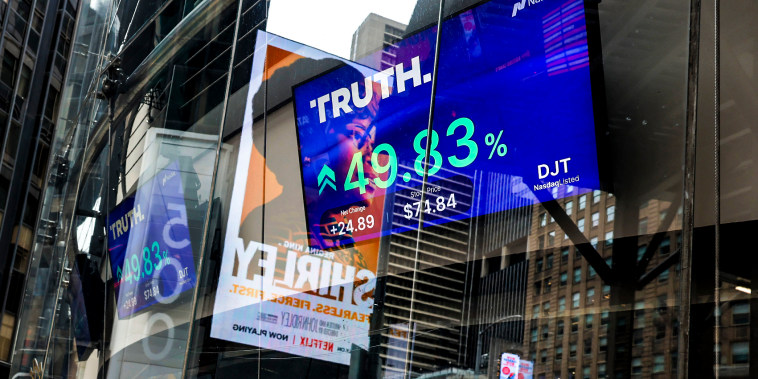
Shares of Trump Media shot up more than 9% on Wednesday, hours after the company revealed it was urging House Republican committee leaders to investigate possible “unlawful manipulation” of its stock.

The stock boost also came one day after a deadline passed for former President Donald Trump, the company’s majority owner, to become eligible for an additional 36 million “earnout” shares. That stake was worth more than $1.3 billion as of the share price at 3:25 p.m. ET.

It was unclear what spurred the sudden rise of Trump Media, which began the trading day down nearly 5% before turning positive later Wednesday morning.

The company’s CEO, Devin Nunes, in a letter Tuesday asked the GOP chairs to probe “anomalous trading” of the stock in order to gauge the extent of the alleged manipulation and “whether any laws including RICO statutes and tax evasion laws were violated.”

The request doubles down on Nunes’ claim that Trump Media, which trades under the ticker DJT, is the apparent victim of “naked” short selling, the practice of selling a company’s shares without first borrowing them for that purpose.

Trump Media, which began trading on the Nasdaq on March 26 after completing a lengthy public merger, was far and away the most expensive U.S. stock to short as of early April.

Brokers therefore “have a significant financial incentive to lend non-existent shares,” wrote Nunes, himself a former House GOP chair, in the letter.

The probe is necessary to protect the company’s shareholders and to ensure that “the perpetrators of any illegal activity can be held to account,” he wrote.

The CEO addressed the letter to four House committee leaders: Financial Services Chairman Patrick McHenry, R-N.C., Judiciary Chairman Jim Jordan, R-Ohio, Ways and Means Chairman Jason Smith, R-Mo., and Oversight Chairman James Comer, R-Ky.

Spokespeople for the four chairmen did not immediately respond to CNBC’s requests for comment on Nunes’ letter.

The letter comes as the stock price of Trump Media, which created the social media app Truth Social, continues to trend down in volatile trading sessions.

DJT shot up in its trading debut and has touched a high of nearly $80 a share, but it has since lost more than half of that value.

Trump Media has been described as a meme stock and a “scam” by some analysts who are quick to highlight the disparity between the company’s lack of revenue and its roughly $5 billion market capitalization.

The letter from Nunes also escalates a feud with Citadel Securities, the capital markets firm founded by GOP megadonor Ken Griffin.

Nunes referenced Citadel Securities in an April 18 letter to Nasdaq CEO Adena Friedman, warning that DJT “appears on Nasdaq’s ‘Reg SHO threshold list,’ which is indicative of unlawful trading activity.” He referenced Citadel Securities again in the new letter he sent to Congress.

The Reg, or Regulation, SHO list was designed to monitor short sales and flag potentially problematic failures to deliver securities to parties in a transaction. But “there are many justifiable reasons why broker-dealers do not or cannot deliver securities on the settlement date,” the SEC notes on its website.

Nunes told Friedman in his letter that more than 60% of DJT shares have been traded by just four market participants, including Citadel Securities.

The firm responded with a statement blasting Nunes as “the proverbial loser who tries to blame ‘naked short selling’ for his falling stock price.”

“Nunes is exactly the type of person Donald Trump would have fired on [The] Apprentice,” a spokesperson for Citadel Securities added in that statement Friday.

A spokeswoman for Trump Media shot back: “Citadel Securities, a corporate behemoth that has been fined and censured for an incredibly wide range of offenses including issues related to naked short selling, and is world famous for screwing over everyday retail investors at the behest of other corporations, is the last company on earth that should lecture anyone on ‘integrity.’”

A representative for Citadel Securities did not immediately respond to a request for comment.

This post appeared first on NBC NEWS

He does several things well: scores, rebounds, passes and defends.

After signing a three-year, $41.9 million contract with the Minnesota Timberwolves in the offseason, Reid had his best season in his fifth year with Minnesota in 2023-24.

The 6-foot-9 center-forward averaged career highs in points per game (13.5), rebounds per game (5.2) and assists per game (1.3) and shot a career-best 41.4% on 3-pointers in just 24.2 minutes per game. He also shot 47.7% from the field.

When Reid was on the court, the Timberwolves allowed just 105.5 points per 100 possessions, helping make Minnesota the No. 1 defense in the NBA.

All things T-Wolves: Latest Minnesota Timberwolves news, schedule, roster, stats, injury updates and more.

On Wednesday, Reid was named the NBA’s 2023-24 Sixth Man of the Year.

He edged Sacramento Kings guard Malik Monk by 10 points in the voting. Reid received 45 first-place votes, 39 second-place votes and 10 third-place votes; Monk received 43 first-place votes, 39 second-place votes and 10 third-place votes. It was the closest vote since Detlef Schrempf edged Dan Majerle by one point (in a different voting system) in 1990-91.

Reid, who was not drafted out of LSU in 2019, played in 81 of 82 regular-season games and gave the Timberwolves another valuable big man alongside Karl-Anthony Towns and Rudy Gobert.

He scored a career-high 34 points against Cleveland on March 8, had two games with 12 rebounds, 20 games with at least two blocks and 16 games with at least two steals.

He is versatile on both ends of the court. Reid, who’d start for several teams in the league, scores inside and outside and can drive to the rim, and he’s quick enough to provide help defense. For a more offensive-minded lineup, Timberwolves coach Chris Finch could pair Reid with Towns, and for a more defensive-minded lineup, Finch could pair him with Gobert.

Reid is the third player to win the award after going undrafted, joining John Starks in 1996-97 and Darrell Armstrong in 1998-99.

Monk and Milwaukee’s Bobby Portis were finalists for the award.

2023-24 NBA Sixth Man of the Year voting results

Naz Reid, Minnesota Timberwolves (352 points)
Malik Monk, Sacramento Kings (342)
Bobby Portis Jr., Milwaukee Bucks (81)
Norman Powell, Los Angeles Clippers (65)
Bogdan Bogdanovic, Atlanta Hawks (40)
Jose Alvarado, New Orleans Pelicans (3)
Russell Westbrook, Los Angeles Clippers (2)
T.J. McConnell, Indiana Pacers (2)
Jonathan Isaac, Orlando Magic (1)
Jaime Jaquez Jr., Miami Heat (1)
Tim Hardaway Jr., Dallas Mavericks (1)
Bojan Bogdanovic, New York Knicks (1)

This post appeared first on USA TODAY

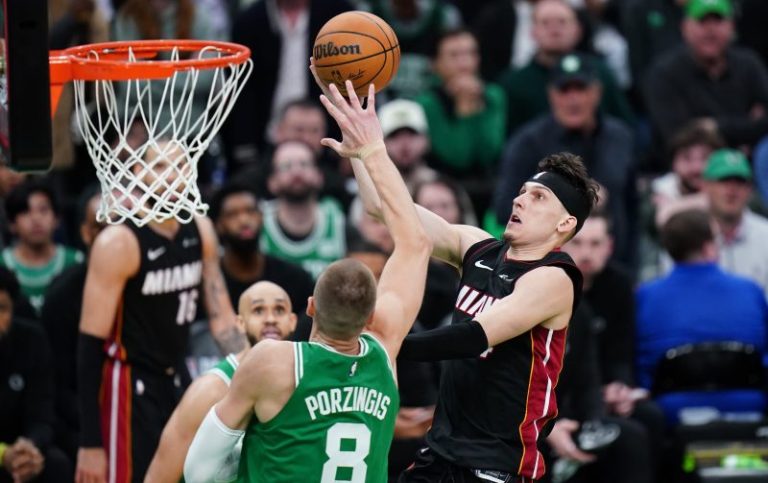
Tyler Herro sank six of Miami’s franchise playoff-record 23 3-pointers as the Heat evened their Eastern Conference first-round playoff series with the Boston Celtics by earning a 111-101 road victory in Game 2 on Wednesday night.

Miami shot 23-for-43 from long distance, with Herro going 6-for-11 on 3-point tries en route to a team-high 24 points. Herro also had 14 assists.

Eighth-seeded Miami led 102-91 after Bam Adebayo made a hook shot with 4:12 to play, and top-seeded Boston failed to get closer than six points after that. The Heat outscored the Celtics 53-40 in the second half.

Adebayo had 21 points and 10 rebounds. Miami also received 21 points from Caleb Martin, who made 5 of 6 from 3-point range.

Boston’s Jaylen Brown led all scorers with 33 points, and Jayson Tatum finished with 28 points. Brown and Tatum each had eight rebounds.

The Celtics were limited to 12 3-point field goals (on 32 attempts) after they went 22-for-49 during their 114-94 victory in Game 1.

Miami’s Jaime Jaquez Jr. added 14 points while Nilola Jovic finished with 11 points, nine rebounds and six assists.

Boston’s Kristaps Porzingis shot 1-for-9 from the field and finished with six points.

Miami led 28-27 after one quarter but trailed 61-58 at halftime. The Heat made 13 3-pointers (on 24 tries) in the first half.

The Heat had a five-point lead with 2:09 left in the half, but the Celtics closed the half on an 11-3 run. Brown scored all 11 Boston points in the sequence, during which he sank three consecutive 3-pointers. Neither team led bymore than six points in the first two quarters.

A 15-3 run put the Heat up 82-70 with 3:36 remaining in the third quarter. Miami was on top 85-79 entering the fourth.

Game 3 will be played Saturday in Miami.

This post appeared first on USA TODAY

The end of spring practices across the country signals the reopening of the college football transfer portal. Many players who have gone through offseason workouts are looking for new homes after finding their current roster situation isn’t to their liking. Others may have been told their opportunities to see the field aren’t promising or that their playing time this fall will be diminished.

Some of those looking for new opportunities will be familiar names or heralded recruits who can step into their programs and provide immediate impact. Who are the best ones available in this cycle?

Here’s the best of the best that will be in demand from schools looking to improve their rosters:

KeAndre Lambert-Smith, WR, Penn State

Lambert-Smith considered entering the NFL draft after leading the Nittany Lions with 673 receiving yards. His return was seen as a major coup with Penn State in need of receiving options to help make its offense more explosive against top defenses. But Lambert-Smith won’t be part of that group this fall and will look to make an impact elsewhere.

Damien Martinez, RB, Oregon State

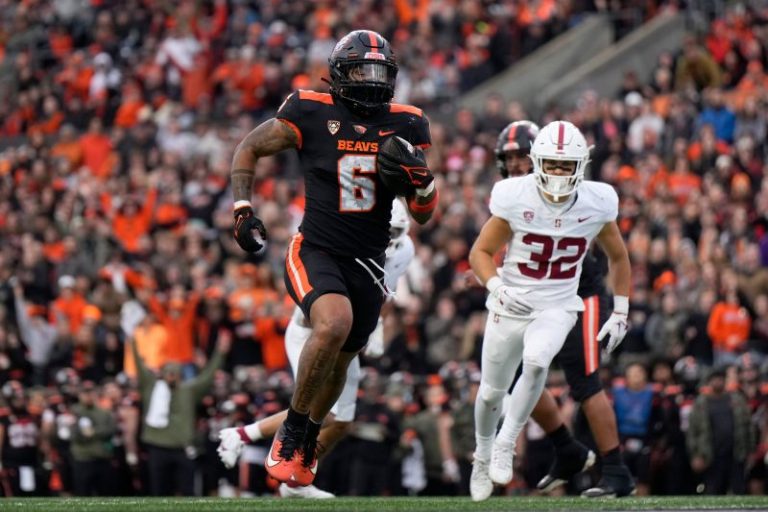
A running back that totaled more than 1,000 yards rushing in a Power Five league last season is going to draw interest from major programs. Martinez put up big numbers for the Beavers last year and stayed this spring despite the loss of coach Jonathan Smith to Michigan State and the school in a transition phase with the Pac-12 down to two teams. Now he is available on the market and should be in demand.

Kaydn Proctor, OL, Iowa

It’s already been an eventful career for Proctor after just one season in college football. He committed to staying home at Iowa as one of the top high school recruits in the 2023 class before signing with Alabama. As a freshman, he was an immediate starter for the Crimson Tide but decided to transfer to the Hawkeyes after the retirement of Nick Saban. A few months, later, Proctor is back in the portal and looks to return to Tuscaloosa.

Damonic Williams, DL, TCU

A two-year starter for the Horned Frogs, Williams helped the team to the College Football Playoff title game as a freshman and followed that up with 33 tackles and three sacks in 2023. He is expected to draw attention from any number of teams looking to fortify their defensive line.

Cormani McClain, DB, Colorado

One of the prized high-school recruits from the first recruiting class of Deion Sanders, McClain struggled to make his mark in his one season with the Buffaloes. He played in nine games and registered 13 tackles. Previously committed to Miami, McClain could potentially return to his home state of Florida or be wooed elsewhere.

Tacario Davis, DB, Arizona

Davis is one of many significant losses for the Wildcats after the departure of coach Jedd Fisch to Washington. He led the Pac-12 with 15 pass breakups and will be a valuable addition to a team seeking an immediate starter in the secondary.

Elijah Herring, LB, Tennessee

It’s rare to see a leading tackler from an SEC school available in the portal. Herring’s decision to leave Knoxville after starting 11 games and posting 80 tackles comes with his playing time uncertain due to the return of Keenan Pili. Still, his production makes him an attractive option for programs with a need in the middle of their defense.

Jason Zandamela, OL, Southern California

One of the top signings for the Trojans last December, Zandamela leaves after going through his first spring practice. He may not be ready to be an instant starter this fall but is a potential project in the interior of the offensive line who could pay big dividends in the future.

Peny Boone, RB, Louisville

Boone ran for 1,400 yards and 15 touchdowns for Toledo last season before making the move to Louisville this winter. But after spring practice with the Cardinals, he is on the move again and should have plenty of options. His size (6-1, 242 pounds) is unique to the position.

Jaden Rashada, QB, Arizona State

It’s already been quite a college journey for Rashada. He signed with Florida in 2023 and left before the season after a fallout with his NIL deal that now has the Gators under NCAA investigation. He started the first two games for the Sun Devils before an injury sidelined him until the team’s final game against Arizona. Now, he’ll try to find his footing at another program.

Sam Brown, WR, Houston

The leading receiver for the Cougars is headed out to catch passes for another school. Brown totaled 815 yards on 62 catches in a breakout season. His skills should be valued by any team looking for a wide receiver who can play right away.

Jacoby Mathews, DB, Texas A&M

It’s been an offseason of transition for the Aggies with Mike Elko taking over for Jimbo Fisher. Mathews is the latest starter from last year’s defense to enter the portal. He registered 42 tackles in his first season of major contribution.

This post appeared first on USA TODAY

Against the backdrop of ‘all-in,’ the hangover of another playoff collapse and the usual hype that envelops the Dallas Cowboys, a key question looms with the countdown to the NFL draft:

Can the Cowboys regain their draft mojo?

They could surely use a banner draft class after losing five starters this offseason and barely causing a ripple during free agency.

Then there was last year’s class. Underwhelming.

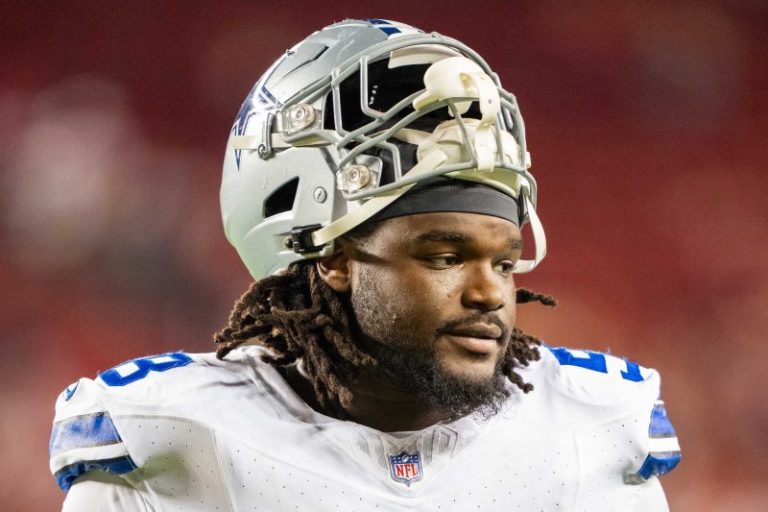
Mazi Smith, the first-round defensive tackle, was hardly the envisioned run-stuffer and melted away pounds in the process. Luke Schoonmaker, the second-round tight end, never emerged as the expected replacement for Dalton Schultz and caught just eight passes while dealing with a foot problem. And from the Dept. of Really Bad Luck, promising third-round linebacker DeMarvion Overshown had his rookie season wiped out after tearing an ACL in training camp.

NFL DRAFT HUB: Latest NFL Draft mock drafts, news, live picks, grades and analysis.

‘With their performance in the first year, the whole group did not measure up to, say, a lot of other people’s draft class,’ Jerry Jones, the Cowboys owner and general manager, told USA TODAY Sports recently. ‘But they’re not through.

‘We can have some of that draft come up and be outstanding this year.’

We’ll see. In the meantime, the Cowboys, holding the 24th pick in the first round, have some significant holes to fill. They need players in the trenches – on both sides of the ball. Longtime left tackle Tyron Smith and center Tyler Biadasz are gone. They are weak against the run in the middle of the D-line, as the Packers exposed in the playoff meltdown. Tony Pollard left after rushing for 1,000 yards and catching 55 passes in 2023, making it a given that they’ll draft a running back at some point.

The Cowboys may be ‘all-in’ for winning big while riding a 28-year drought since playing for a championship, but without some impact reinforcements ASAP the challenge confronting coach Mike McCarthy while on the last year of his contract gets even tougher.

More pressure with this draft?

Jones doesn’t characterize it as such. Never mind your lying eyes.

‘We just need to continue doing it as well as we’ve done in the past,’ Jones said.

That’s hardly hopeful spin, even coming from the optimistic hype man who signs the checks.

According to Pro Football Reference, over the past 10 drafts the Cowboys are tied with the Baltimore Ravens and San Francisco 49ers for the most players selected, six, who have earned first-team All-Pro honors. The Kansas City Chiefs are next with five (although star tight end Travis Kelce, who was drafted in 2013, is not in the tally).

During that same span, Dallas drafted 14 players who earned Pro Bowl selections, which tied Baltimore for second-most in the league. The Detroit Lions, having selected an eventual Pro Bowler in 11 consecutive drafts (and two rookie Pro Bowlers in 2023 in running back Jahmyr Gibbs and tight end Sam LaPorta), have chosen 16 players in the past 10 drafts who earned Pro Bowl nods (including honors while playing for other teams).

The Cowboys’ All-Pro roll call from the past 10 drafts includes DaRon Bland (2022 draft class), Micah Parsons (’21) CeeDee Lamb (’20), Trevon Diggs (’20), Ezekiel Elliott (’16) and Zack Martin (’14). Eight other draftees, including Dak Prescott and DeMarcus Lawrence, have Pro Bowls on their résumés.

In other words, the Cowboys, with Stephen Jones positioned as executive vice president of personnel and Will McClay in an essential role as vice president of personnel, have consistently stocked the roster with premium talent.

The dots also connect to the issues the Cowboys are currently facing in managing their salary cap. As stars emerge, so does their worth on the market. Jones has repeatedly maintained that he will extend Prescott, who is heading into the final year of his contract. The team also needs to strike extensions for Parsons and Lamb.

It’s the reality of NFL Moneyball: Pay up or watch them walk away as free agents. That’s why nothing helps manage a tight salary cap like impact from draft hits playing on rookie contracts, buying time for decisions on the bigger deals in the future while allowing more cap dollars to be used to keep the stars – or at least some of them.

Jones knows. And now?

‘I’d like this draft class to do what that one didn’t,’ he said, comparing to last year’s crop. ‘That is, be more productive in their rookie year.’

That, too, should be listed with the ‘draft needs’ for the Cowboys.

This post appeared first on USA TODAY