Archive

2024

Browsing

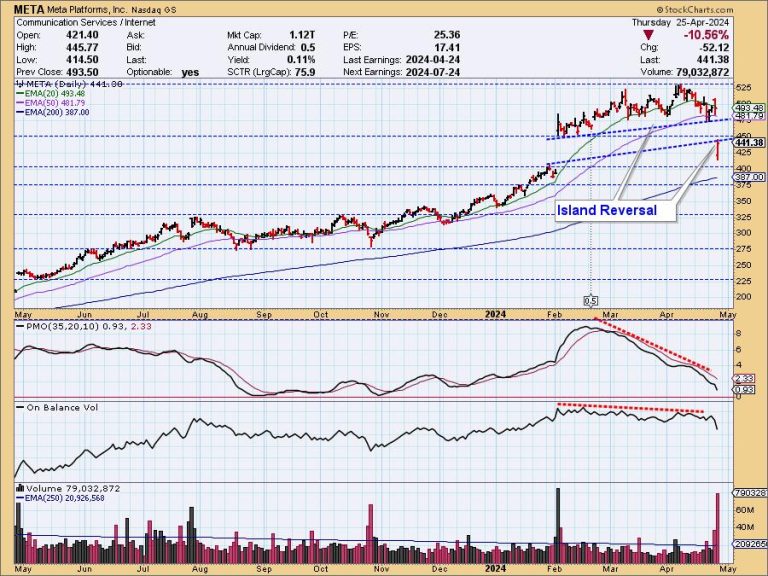
Whenever we see price gapping up or down, as happened with META in February, we prepare for the possibility of an island reversal. After the gap up, price forms a cluster, the island, and we ponder the possibility of a gap down to complete the reversal. During the formation of META’s island, news coverage was very positive, but yesterday’s earnings report made investors unhappy, and META really took a dive, jumping down across the gap.

While some might have been surprised by the final resolution, the chart gave ample clues, as there were negative divergences on both the PMO (price) and OBV (volume).

There was also a PMO negative divergence on the weekly chart.

Island reversals can happen to the downside as well as the upside.

However, we have two more island formations to monitor in the intermediate term. Neither appears that dangerous, as the clues we had on META are not visible on Amazon (AMZN) and NVIDIA (NVDA).

AMZN shows a large island formation, but do note we saw a gap down yesterday. That turned into its own reverse island only to the upside. The PMO has since begun to turn up on today’s rally. There is no OBV negative divergence. We would just be careful with earnings being reported next week, as that was the catalyst for META’s reverse island.

The weekly PMO looks suspect, but we do not have a negative divergence as we did with META.

NVDA has a large island formation to monitor as well, and is set up far better than META and even AMZN. The PMO has already turned back up on the short-term resolution of a double bottom formation. There is no OBV negative divergence; we don’t expect a gap down resolution at this time.

In addition, we don’t really see a strong negative divergence on PMO tops, and the weekly PMO has bottomed above the signal line in bullish fashion. NVDA isn’t necessarily out of the woods, but the hype surrounding it will likely push price higher after its recent correction.

Conclusion: META experienced a reverse island execution on earnings. Now we watch and wait to see what AMZN will do going into earnings as it is vulnerable to a gap down. NVDA doesn’t report again until next month and thus is not as vulnerable to a reverse island decline.

Learn more about DecisionPoint.com:

Watch the latest episode of the DecisionPointTrading Room on DP’s YouTube channel here!

Try us out for two weeks with a trial subscription!

Use coupon code: DPTRIAL2 at checkout!

Technical Analysis is a windsock, not a crystal ball. –Carl Swenlin

(c) Copyright 2024 DecisionPoint.com

Disclaimer: This blog is for educational purposes only and should not be construed as financial advice. The ideas and strategies should never be used without first assessing your own personal and financial situation, or without consulting a financial professional. Any opinions expressed herein are solely those of the author, and do not in any way represent the views or opinions of any other person or entity.

DecisionPoint is not a registered investment advisor. Investment and trading decisions are solely your responsibility. DecisionPoint newsletters, blogs or website materials should NOT be interpreted as a recommendation or solicitation to buy or sell any security or to take any specific action.

Helpful DecisionPoint Links:

Trend Models

Price Momentum Oscillator (PMO)

On Balance Volume

Swenlin Trading Oscillators (STO-B and STO-V)

ITBM and ITVM

SCTR Ranking

Bear Market Rules

Using technical indicators to identify stocks fundamentally undervalued but technically strengthening is a common practice. But, using indicators to find fundamentally strong stocks that happen to be technically undervalued (or contested) is probably less common, especially if you lean toward technicals.

That was certainly the case with Alphabet Inc (GOOGL), leading to Friday’s 15% spike and price gap, the sharpest rally since 2015. Alphabet’s earnings and revenue results soared past Wall Street’s expectations. But the extraordinary news was the declaration of the company’s first-ever dividend (20 cents per share) and a $70 billion buyback, providing substantial benefits to shareholders.

The dividend and buyback part was unpredictable. But the case for having bought (and held) GOOGL was present in the fundamentals and technicals, notably when the technicals indicated significant weakness.

FIGURE 1. DAILY CHART OF ALPHABET SINCE 2023. The Communications sector outperformed the S&P 500 consistently, while Alphabet began underperforming the sector toward the end of 2023.Chart source: StockCharts.com. For educational purposes.

Alphabet’s StockCharts Technical Rank (SCTR) scores at the beginning of 2023 were quite dismal, though the stock began picking up steam shortly after. Alphabet had a big earnings miss in February 2023, yet analysts would argue that the miss was “baked-in.”

The SCTR line started trending downward in October 2023, hitting consecutive lows in December of that year and, most recently, March, where the SCTR score plunged to a 10, an exceedingly bearish technical reading.

Relative performance against its sector (XLC), would have confirmed Alphabet’s relative weakness, as it grossly underperformed it by -10%.  Meanwhile, XLC (the Communications sector proxy) steadily outperformed the S&P 500, as you can see in the chart above.

All signs read “bearish” in bold letters, except for a couple of things:

Fundamentally, its earnings performance after Feb 2023 had shown nothing but consecutive strength.Technically, Alphabet was in a strong uptrend (and a long one) despite its sector underperformance and various other indications of technical weakness.

So, was it technically undervalued, save for the one thing that perhaps mattered the most: the direction of the larger trend?

Running Bullish Scans

For context, Alphabet came up on a scan for Outperforming SPY: 52-Week Relative Highs. It wasn’t there yesterday. But if you did a quick Symbol Summary search on Friday morning, you would have seen GOOGL pop up on several bullish scans.

FIGURE 2. PREDEFINED SCAN LISTING IN THE STOCKCHARTS SYMBOL SUMMARY TOOL. What a difference a day makes!Chart source: StockCharts.com. For educational purposes.

So, now that the retail crowd is joining those who have long been “long,” is it too late to jump in?

It’s a Wait-and-See Moment

FIGURE 3. DAILY 6-MONTH CHART OF ALPHABET. Huge gap but mixed signals.Chart source: StockCharts.com. For educational purposes.

As a continuation gap, the odds of it getting filled within the week is around 8% (according to analyst Thomas Bulkowski’s studies).

Looking at the candle, you’ll notice heavy selling (profit-taking?) occurred immediately after Friday’s market opening. If you look at the coinciding volume bar, you’ll see that selling activity outpaced buying activity.

The Stochastic Oscillator shows a slight divergence between it and the two consecutive highs in April. But the Chaikin Money Flow (CMF) paints a bullish picture of surging pressure among buyers.

Given the mixed signals, it’s a wait-and-see moment. If the gap gets filled, how close will the price get to $160, the previous high that may serve as support? If it falls through that level, what’s the likelihood it might find support at the most recent swing low range near $150? And if Alphabet bounces in either spot, will there be enough volume and momentum to field its next leg upward?

The Bottom Line

If you’ve been bullish on Alphabet, the green light for loading up on the stock flashed well before the latest earnings shocker—complete with its inaugural dividend and hefty buyback. Strangely enough, perhaps the apparent technical inconsistencies highlighted Alphabet’s underlying strength. At this juncture, it’s a game of watchful waiting to pinpoint the perfect entry point.

Disclaimer: This blog is for educational purposes only and should not be construed as financial advice. The ideas and strategies should never be used without first assessing your own personal and financial situation, or without consulting a financial professional.

A tug-of-war with no clear winner—that’s what the stock market seemed to be playing this week. With a Fed meeting, key economic data, and more earnings on top, will a winner emerge next week?

It was an interesting week in the stock market. Economic data shows that growth is slowing, while inflation isn’t showing signs of slowing down. This possible “stagflation” scenario paves a path towards more uncertainty, especially when it comes to interest rates. And with next week’s Fed meeting, investors are becoming even more cautious about making any trading or investing decisions.

Looking back at last week, we can see how Tesla (TSLA) bounced higher after it missed earnings. Meta Platforms (META) beat earnings estimates, but its stock price gapped lower on weak Q2 guidance. That was a concern, since META has been enjoying a bullish rally since the end of 2022. It remains to be seen if the gap up in META’s stock price on February 2, 2024 will get filled. The stock is trading at its 100-day simple moving average (SMA), which could be a support level the stock bounces from; however, META could also end up breaking below it and sliding further.

Investors were concerned by META’s weak guidance, as they were looking for Tech earnings to be the catalyst that pushes the market higher. After META took most of the market lower, the next worry was whether the other Tech stocks would follow the same path. Fortunately, that didn’t occur. Microsoft (MSFT), Alphabet (GOOGL), and Snap (SNAP) all beat earnings, and their stock prices moved higher, reversing the downtrend.

Is this Reversal Sustainable?

The positive earnings excited the bulls, but it felt like they hit a wall. There wasn’t enough follow-through to push the stock market indexes higher, and the bears didn’t seem to be interested in putting up much of a fight.

While the S&P 500 ($SPX), Dow Jones Industrial Average ($INDU), and Nasdaq Composite ($COMPQ) traded higher on Friday, the weekly chart shows the S&P 500 and Nasdaq didn’t close above last week’s high. The Dow did close slightly higher, though.

Follow the live chart here.

The daily charts are more attractive. Below is the daily chart of the Nasdaq Composite, which shows that, after last Friday’s low, the index moved higher, then fell on Thursday before recovering those losses at the close of the trading day. Today (Friday, April 26), the Nasdaq gapped higher and closed above Wednesday’s swing high.

CHART 1. DAILY CHART OF NASDAQ COMPOSITE. After closing higher than the last swing high, there’s hope the Nasdaq could rally higher depending on what unfolds next week. Chart source: StockCharts.com. For educational purposes.

The Nasdaq Composite is getting close to its 50-day SMA, which would be a strong resistance level for the index.

Follow the live chart here.

Moving on to the S&P 500, the index is up against resistance from its 50-day SMA, which coincides with a downward-sloping trendline.

CHART 2. DAILY CHART OF S&P 500 INDEX. If the S&P 500 breaks above the downward sloping trending on the top of the channel and its 50-day moving average, there could be upside follow-through. Chart source: StockCharts.com. For educational purposes.

Follow the live chart here.

The Dow is the most bullish of the three broad indexes. It has seen a clear reversal from a support level (red dashed line), and any bullish news next week will likely move the index higher.

CHART 3. DAILY CHART OF THE DOW JONES INDUSTRIAL AVERAGE. A clear bounce from a significant support level could mean the Dow has more buying than selling pressure. Chart source: StockCharts.com.

Which Way Will the Stock Market Move?

It looks like the bulls are hungry to be the more dominant player. If any news blocks the bulls from taking this market any higher, the bears will be quick to take over. Remember, the market takes the stairs up and the elevator down. The market will probably continue to see some choppiness until Wednesday afternoon, when the Fed makes its interest rate decision. That will probably be what will take the stock market down or up.

End-of-Week Wrap-Up

S&P 500 closes up 1.02% at 5,099.96, Dow Jones Industrial Average closes up 0.4% at 38,239.66; Nasdaq Composite closes up 2.03% at 15,927.90$VIX down 2.28% at 15.02Best performing sector for the week: TechnologyWorst performing sector for the week: MaterialsTop 5 Large Cap SCTR stocks: Super Micro Computer, Inc. (SMCI); Coinbase Global Inc. (COIN); Vertiv Holdings (VRT); MicroStrategy Inc. (MSTR); Vistra Energy Corp. (VST)

On the Radar Next Week

April ISM Manufacturing PMIFed interest rate decisionFed Chairman Powell’s Press ConferenceMarch JOLTS Job Openings reportApril Non Farm Payrolls (Jobs) ReportApril ISM ServicesEarnings season continues with Amazon (AMZN), Advanced Micro Devices (AMD), Eli Lilly (LLY), Barrick Gold (GOLD) and Booking Holdings (BKNG) reporting.

Disclaimer: This blog is for educational purposes only and should not be construed as financial advice. The ideas and strategies should never be used without first assessing your own personal and financial situation, or without consulting a financial professional.

In this edition of StockCharts TV‘s The Final Bar, Dave answers viewer questions on spotting downturns in daily vs. weekly charts, using the Relative Rotation Graphs (RRG) to identify actionable ideas, and comparing the NYSE Composite Index ($NYA) to the S&P 500 Index ($SPX). He also shares the one chart he will never forget, and what he learned from it.

This video originally premiered on April 26, 2024. Watch on our dedicated Final Bar page on StockCharts TV!

New episodes of The Final Bar premiere every weekday afternoon. You can view all previously recorded episodes at this link.

In this episode of StockCharts TV‘s The MEM Edge, Mary Ellen reviews the key drivers for this week’s volatile period, including Core PCE and GDP numbers. She takes a look at where the S&P 500 and NASDAQ closed for the week and whether it’s safe to put new money to work. Several stocks gapped up into base breakouts, and Mary Ellen covers these as well.

This video originally premiered April 26, 2024. Click here or on the above image to watch on our dedicated MEM Edge page on StockCharts TV.

New episodes of The MEM Edge premiere weekly on Fridays. You can view all previously recorded episodes at this link.

If you’re looking for stocks to invest in, be sure to check out the MEM Edge Report! This report gives you detailed information on the top sectors, industries and stocks so you can make informed investment decisions.

The S&P500 trend conditions have continued this week in “NoGo” conditions despite relief rallies. Alex Cole and Tyler Wood, CMT identify intermarket forces including rising rates ($TNX) and a strong US Dollar (UUP) that can provide headwinds to risk assets. This week we again take a closer look at GoNoGo Trend® conditions across sectors that are trending and outperforming. Notably, consumer staples (XLP) and Utilities (XLU) are in “Go” conditions and outperforming US equities ($SPY) on a relative basis. These are characteristically “defensive” sectors of the market and become attractive to investors during periods of weakness across the broad indices.

Alex and Tyler dig deeper into the industry group level within the utilities sector (XLU) to see electricity providers leading relative outperformance. We pull up NextEra Energy (NEE) and Edison (EIX) to showcase these opportunities within the leading industry group of an outperforming sector.

On an educational note, we show an example of bearish divergence and discuss how to interpret such concepts as a sign of trend weakness or exhaustion, not as a trade signal to exit long positions. Using Boston Scientific (BSX) as an example, we can see that Price is our most important indicator for trade decisions, and while momentum waned, the bearish divergence appeared, and we even saw brief negative momentum, that weakness proceeded a gap higher for price action.

We’ve been covering the signs of weakness for stocks, from the bearish divergences in March, to the mega-cap growth stocks breaking through their 50-day moving averages, to even the dramatic increase in volatility often associated with major market tops. While Q1 was marked by broad market strength and plenty of new 52-week highs, Q2 has so far provided a much different playbook for investors. Both bulls and bears have felt validated by the recent choppiness for the major market averages.

Over the last week, the S&P 500 managed to gain about 2.7%, despite some hotter-than-expected inflation data and a mixed bag of earnings for the Magnificent 7 stocks. Does this set us up for much further gains, and a potential break to new all-time highs, as we continue through the second quarter? Or are we currently experiencing the “dead cat bounce” phase with a countertrend move to the upside before the great bear market continues?

Psst! Check out the January 2024 edition of this exercise, and guess which scenario actually played out!

Today, we’ll lay out four potential outcomes for the S&P 500 index. As I share each of these four future paths, I’ll describe the market conditions that would likely be involved, and I’ll also share my estimated probability for each scenario. And remember, the point of this exercise is threefold:

Consider all four potential future paths for the index, think about what would cause each scenario to unfold in terms of the macro drivers, and review what signals/patterns/indicators would confirm the scenario.Decide which scenario you feel is most likely, and why you think that’s the case. Don’t forget to drop me a comment and let me know your vote!Think about how each of the four scenarios would impact your current portfolio. How would you manage risk in each case? How and when would you take action to adapt to this new reality?

Let’s start with the most optimistic scenario, involving a move to new all-time highs over the next six to eight weeks.

Option 1: The Very Bullish Scenario

If you think the April pullback was just another buyable dip within a primary bullish trend, then the Very Bullish Scenario is for you. This scenario would be made possible only if the Magnificent 7 stocks returned to their former magnificent ways, with stocks like AMZN and NVDA following GOOGL in making new all-time highs.

We’d need to see economic indicators, especially inflation readings, come in much weaker, which would give the Fed confidence to begin cutting rates at the June Fed meeting. By the end of June, we’d be talking about the S&P 500 breaking above 5500, and even 6000 could be on the table.

Dave’s Vote: 10%

Option 2: The Mildly Bullish Scenario

What if the S&P manages to hold the April low around 4950, but is unable to push to new all-time highs? Scenario 2 could mean that value-oriented sectors like industrials and materials experience a resurgence, outpacing the growth leadership stocks from Q1. But since these sectors are much lower weight in the S&P 500, it’s just not enough market cap to move the needle on the major benchmarks.

Perhaps the rest of earnings season yields mixed results, and by the end of Q2 we are left with more questions than answers as the Fed is unable to commit to aggressive rate cuts. Interest rates remain elevated, which creates a major headwind for growth stocks.

Dave’s vote: 30%

Option 3: The Mildly Bearish Scenario

Now we get to two scenarios that would mean a more bearish picture emerges in the coming weeks. Scenario 3 would mean the S&P 500 is unable to hold the April low around 4950, but we remain above a 38.2% retracement level around 4820. The Fed either delays its first rate cut or uses language that exudes little confidence in multiple additional rate cuts in 2024.

The Magnificent 7 stocks would be choppy at best, and as they stall out attempting to return to new all-time highs, investors see that as a signal of limited upside. Gold and gold stocks become the trade of the day, as investors are looking for anything other than stocks to try and generate positive returns.

Dave’s vote: 45%

Option 4: The Super Bearish Scenario

You always have to include a doomsday scenario, and our final option would mean the April selloff was indeed just the beginning. May and June are marked with lower lows and lower highs, and Q2 feels very similar to September and October of 2023. The S&P 500 breaks through Fibonacci support around 4820, and even pushes below the 200-day moving average for the first time since the October 2023 low.

What could cause this last scenario? Economic data could come in way higher than expected, and the Fed could then become unwilling to cut rates while the economy shows signs of renewed strength. The market braces for “higher for longer” interest rates, growth-oriented sectors like technology and communication services begin the lead the way lower, and defensive sectors bump higher as investors ignite the “flight for safety” trade.

Dave’s vote: 15%

What probabilities would you assign to each of these four scenarios? Check out the video below, and then drop a comment with which scenario you select and why!

RR#6,

Dave

P.S. Ready to upgrade your investment process? Check out my free behavioral investing course!

David Keller, CMT

Chief Market Strategist

StockCharts.com

Disclaimer: This blog is for educational purposes only and should not be construed as financial advice. The ideas and strategies should never be used without first assessing your own personal and financial situation, or without consulting a financial professional.

The author does not have a position in mentioned securities at the time of publication. Any opinions expressed herein are solely those of the author and do not in any way represent the views or opinions of any other person or entity.

BALTIMORE — The first cargo ship passed through a newly opened deep-water channel in Baltimore on Thursday after being stuck in the harbor since the Francis Scott Key Bridge collapsed four weeks ago, halting most maritime traffic through the city’s port.

The Balsa 94, a bulk carrier sailing under a Panama flag, passed through the new 35-foot channel headed for St. John, Canada.

Its voyage marked an important step in the ongoing cleanup and recovery effort as salvage crews have been working around the clock to clear thousands of tons of mangled steel and concrete from the entrance to Baltimore’s harbor.

The ship is one of five stranded vessels expected to pass through the new, temporary channel, including one loaded car carrier. Other ships are scheduled to enter the port, which normally processes more cars and farm equipment than any other in the country.

On Thursday morning, the vessel moved through the channel guided by two tug boats, one in front and one behind. It passed in between red and green buoys marking the channel’s boundaries and glided slowly by the wreckage of the bridge and the grounded Dali, the massive container ship that caused the collapse when it slammed into one of the bridge’s support columns.

Pieces of the fallen bridge are still blocking other parts of the port’s main channel, which has a controlling depth of 50 feet (15 meters), enough to accommodate some of the largest cargo and cruise ships. Officials have prioritized opening a temporary channel deep enough for large commercial vessels to pass through in hopes of easing the economic impacts of the collapse.

The Balsa 94 is expected to arrive in Canada on Monday.

The Dali lost power and veered off course shortly after leaving the Port of Baltimore bound for Sri Lanka last month. Six members of a roadwork crew plunged to their deaths in the collapse. Four bodies have been recovered from the underwater wreckage while two remain missing.

The new channel will remain open until Monday or Tuesday. It will close again until roughly May 10 while crews work to remove steel from the Dali and refloat the ship, which will then be guided back into the port, officials said earlier this week.

The 35-foot depth is a substantial increase over the three other temporary channels established in recent weeks. It puts the cleanup effort slightly ahead of schedule, as officials previously said they hoped to open a channel of that depth by the end of April.

The port’s main channel is set to reopen next month after the ship has been removed. That will essentially restore marine traffic to normal.

In a court filing Monday, Baltimore’s mayor and city council called for the Dali’s owner and manager to be held fully liable for the bridge collapse, which they said could be devastating for the regional economy. They said the port, which was established before the nation’s founding, has long been an economic driver for Baltimore and the surrounding area. Losing the bridge itself has also disrupted a major east coast trucking route.

Officials have established a slew of assistance programs for port workers and others whose jobs are suffering as a result of the collapse.

The filing came in response to an earlier petition on behalf of the two companies asking a court to cap their liability under a pre-Civil War provision of an 1851 maritime law — a routine procedure for such cases. A federal court in Maryland will ultimately decide who’s responsible and how much they owe.

In the meantime, both the FBI and the National Transportation Safety Board are conducting probes to determine what caused the ship to lose power and strike the bridge.

This post appeared first on NBC NEWS
TikTok’s fate in the U.S. has never been more in doubt after Congress approved a bill that gives its parent company two options: sell it to an approved buyer or see it banned.

President Joe Biden signed the legislation into law on Wednesday. 

But it could take years for the TikTok ban to actually go into effect, since its Chinese-owned parent company, ByteDance, is likely to challenge the statute in court. 

And even if it survives a legal challenge, no one is quite sure what would happen next. 

It would probably be several years from now.

According to the statute’s language, ByteDance would have nine months to divest and find an American buyer for TikTok once the bill is signed into law. 

On top of that, the president can push back the deadline by an additional 90 days. 

That means, without a sale, the soonest TikTok could shut down in the U.S. would be more than one year from now.  

But it’s more complicated than that. 

If ByteDance sues to block the implementation of the statute — which it has said it would do — the bill will be taken up by the D.C. Circuit Court of Appeals, according to Isaac Boltansky, director of policy for the financial services firm BTIG.

Boltansky said ByteDance would file a suit no later than this fall. And while the case is under judicial review, the “clock” on any ban is effectively paused, he said. 

Once the D.C. court issues its ruling, whichever side loses is likely to request a review by the U.S. Supreme Court.

That would forestall the ban by another year — meaning nothing would go into effect until 2026, Boltansky said.

TikTok will argue that the ban is unconstitutional and that it’s also taken steps to protect American users’ data. The app has already launched an aggressive lobbying campaign, featuring a number of small-business owners and influencers who say it’s their lifeblood.

“We have got to make enough noise so that they don’t take away our voice,” TikTok user @dadlifejason, who has 13.8 million followers, says in a TikTok ad shared on social media.

The bill stipulates that TikTok can continue to operate in the U.S. if ByteDance sells the app to a U.S.-approved firm. 

While large U.S. tech companies would love to get their hands on the platform, Boltansky said that Biden administration regulators — not to mention GOP critics of Big Tech firms — have no interest in expanding the power, reach or influence of such companies.  

Some other outside groups might emerge. At least one led by Steve Mnuchin, who was Treasury secretary in the Trump administration, has already sought to make a bid, telling CNBC in March that he was putting together an investor group. The Wall Street Journal has also reported that former Activision Blizzard CEO Bobby Kotick was looking for potential buyer partners. While ByteDance, which owns other companies, is worth hundreds of billions of dollars, TikTok would fetch less than that, experts say — especially if it is sold without its powerful recommendation algorithm.  

But Boltansky believes ByteDance is unlikely to agree to any kind of sale. The Chinese government has said as much, arguing that it regards the algorithm as a national security asset. And without that, TikTok becomes much less appealing to potential buyers.    

It might — but the ultimate impact may be limited. The fact is, most TikTok users already have a presence on other platforms, so the impact on their livelihoods to the extent that they operate businesses on TikTok could be limited.

According to a survey from the financial services group Wedbush, approximately 60% of TikTok user respondents said they’d simply migrate to Instagram (or Facebook) in the event of a sale, while 19% said they’d go to YouTube. 

Analysts with financial services company Bernstein arrived at similar estimates. In a note to clients, they forecast that Meta, which owns Instagram and Facebook, would take over as much as 60% of TikTok’s U.S. ad revenue, with YouTube gaining 25%. Snapchat would also benefit, they said. 

Boltansky said many political pundits remain surprised that the bill got over the finish line. But a wave of anxiety about both Chinese influence and the impact of social media on youth converged to get it passed.

“This has been noteworthy,” Boltansky said. “Everyone is so conditioned to D.C. doing nothing or the bare minimum to keep the lights on.”

As tensions with Beijing have grown, congressional lawmakers, along with top law enforcement officials, have warned that TikTok is controlled by the Chinese Communist Party (CCP) and is a national security threat to the United States.

“It screams out with national security concerns,” FBI Director Christopher Wray testified on Capitol Hill last year

U.S. officials fear that the Chinese government is using TikTok to access data from, and spy on, its American users, spreading disinformation and conspiracy theories.

The House passed its standalone TikTok bill on a big bipartisan vote in March. But the Senate appeared in no hurry to take up the measure as Commerce Chair Maria Cantwell, D-Wash., drafted her own legislation.

That all changed when Speaker Mike Johnson, R-La., working with the White House, rolled out his $95 billion foreign aid supplemental plan last week that included billions of dollars for Ukraine, Israel and Taiwan. 

Included in that sweeping aid package: the House’s TikTok bill, with some minor changes. Johnson pushed the package through his chamber, then sent the House on a recess, forcing the Senate to take it or leave it.

Rather than further delay the critical, long-stalled military and humanitarian aid, the Democratic-controlled Senate is moving to quickly pass the package — including the TikTok bill and other Johnson priorities.

This post appeared first on NBC NEWS

The United Auto Workers just notched a historic victory in Tennessee, the union’s first major win since signing new contracts in Detroit as it shifts focus to the South. Some industry workers there feel more optimistic than ever, but others still aren’t ready to join up.

Friday’s landslide outcome at the Chattanooga Volkswagen plant, where 73% of workers who cast votes opted to unionize, followed two failed attempts and is the UAW’s first win at a foreign automaker in the South.

The breakthrough came months after strikes at the Big Three Detroit automakers — Ford, General Motors and Jeep maker Stellantis, all of which have long been unionized. Those walkouts led to contracts, ratified by 64% of voting union members, featuring pay hikes and better job security in an increasingly electrified auto industry.

The UAW is now targeting 13 nonunion automakers, with the next battle set for a Mercedes-Benz plant in Vance, Alabama, that will vote on unionizing in mid-May.

“We’ve got the lead,” said Jeremy Kimbrell, a measurement machine operator at the plant who isn’t daunted by a climate some expect to be tougher for labor organizers than Tennessee’s.

All Southern states have “right to work” laws allowing workers to opt out of union participation, contributing to membership rates that lag behind the national 10% average. While Volkswagen remained neutral in the Chattanooga campaign, six Southern GOP governors, including Alabama’s, slammed it, warning of potential layoffs to offset higher labor costs.

Kimbrell said he and some of his colleagues have been required to watch videos outlining the potential downsides to union membership, adding that management has sought to limit group discussion of the issues.

A Mercedes-Benz factory in Vance, Ala., in June 2017. The plant faces a union vote in May.Andrew Caballero-Reynolds / AFP via Getty Images file

Employees at the Vance plant filed federal charges against Mercedes, alleging it retaliated against pro-union workers by denying some paid family leave and taking disciplinary action for minor infractions. In February, the Department of Labor recovered nearly $440,000 in back wages and unpaid bonuses for two plant workers who were terminated after taking federally covered leave.

A Mercedes spokesperson said the company “holds meetings where multiple business topics are covered” and would “continue to share facts and opinions through open and direct communication” so staffers could make an informed choice. The company has said it cooperated with regulators but denied violating federal rules or wrongfully terminating workers.

We’re going to see a huge change in the balance of power in the South.

Kate Bronfenbrenner, Cornell University School of Industrial and Labor Relations

Kimbrell, who has worked at the Alabama facility for over 20 years and volunteers on the organizing committee, said he’d long doubted that unionizing was “ever gonna happen.” Now he’d be surprised if it didn’t: “There’s no doubt that people on the floor think we’re going to win.”

Some labor experts also foresee the momentum continuing.

“We’re going to see a huge change in the balance of power in the South once you have powerful unions who can leverage change in public policy in those states,” said Kate Bronfenbrenner, director of labor education research at the Cornell University School of Industrial and Labor Relations. “The gains that happened in 2023 moved people into middle class jobs,” she said, and workers everywhere see it.

But not all of them have been won over.

Omari Roundtree, who works as a trim specialist at a Honda plant in Maryville, Ohio — and has a brother who works at the Chattanooga VW plant — said his skepticism since speaking to NBC News in October hasn’t shifted much. He still hasn’t seen enough of the benefits of unionizing to overcome his mistrust of the UAW, stemming from his father’s experience working for a GM supplier in the 1990s.

“Maybe if there was an offshoot or another [union] that was created,” said Roundtree, 33, “but I don’t necessarily trust the characters and actors from that organization.”

The UAW’s president, Shawn Fain, has sought to refresh its image after sweeping into power on an anti-establishment platform following a high-level corruption scandal. Some supporters said they see the UAW’s push beyond Detroit as Fain making good on his campaign promises.

United Auto Workers President Shawn Fain is pushing to expand the union in states with tougher terrain for labor groups.John J. Kim / Chicago Tribune via Getty Images file

In a news conference Tuesday, Fain appealed to members who question the UAW’s Southern strategy and the use of their dues to support it, saying, “This ain’t charity, this is power.”

Fain also touted the “UAW bump” — pay raises at nonunion firms after the Big Three strikes — and described nationwide membership growth as an important tool to maximize the union’s clout.

“In 2028, we’re going back to the table with Ford, GM and Stellantis,” he said. “If we want the leverage to win back our pensions and retirement health care, we need to organize the unorganized.”

James Bryant, a 52-year-old vehicle inspector at a Nissan plant in Canton, Mississippi, said the automaker rolled out “the biggest raise that they’ve ever given us” after the UAW finalized its Big Three contracts last fall, boosting his hourly pay to $34.62 from $31.47.

Bryant said he was heartened by the Volkswagen vote and believes it will help energize skittish co-workers at the Canton plant, which voted down a 2017 union bid after a heated campaign that drew national attention.

If Mercedes passes their union vote, Nissan might as well not even put up a fight.

James Bryant, Nissan plant worker, Canton, Miss.

“We are still going to be so far behind everybody else” due to the annual wage progression the UAW negotiated with the Big Three, he said. “If Mercedes passes their union vote, Nissan might as well not even put up a fight.”

A Nissan spokesperson said the company respects workers’ right to organize but said, “For more than forty years, when Nissan employees have exercised their voices, they have chosen overwhelmingly to continue representing themselves.”

Some Southern autoworkers said they’re already seeing stronger union interest this year.

In February, the UAW said more than 30% of workers at Hyundai’s auto plant in Montgomery signed union cards. Conbralius Thomas, 37, who works on a multifunctional team there, said he and other volunteers are working with the union to reach 50%. Once 70% of eligible site workers sign cards, the UAW will ask the company to recognize the union or call for a federally overseen vote if it doesn’t.

Hyundai said “the decision to be represented by a union is up to our team members” and pointed to a new pay structure it said would boost hourly wages by 25% by 2028.

For now, Thomas is pleased with the UAW’s efforts. “They’re sticking their necks out and it’s showing,” he said.

This post appeared first on NBC NEWS