Archive

2024

Browsing

Israel’s recent retaliatory strike inside Iran, in response to Tehran’s unprecedented missile and drone assault on Israel proper the weekend before, was a brilliant work of what practitioners of intelligence statecraft call ‘strategic signaling.’

The message delivered to the ayatollahs on April 19 by the Jewish state was so daring, direct and unequivocal that it will likely compel Iran to abandon its new bold tactics of direct kinetic warfare. Jerusalem has enforced its red lines with Iran, making a successful kinetic counterattack by Iran inside Israel unlikely. Here’s why. 

Benjamin Netanyahu’s government has demonstrated to the Iranian regime that its skillfulness at bombastic rhetoric and ability to gin up anti-Israel fervor among various groups across the globe doesn’t compensate for its military’s ineptness at conventional warfare. 

There was a lot of drama unfolding in multiple corners of the world, with the usual theatrics coming out of Tehran. The Iranian Parliament’s National Security Committee spokesman Abolfazl Amoue warned a day before Israel’s retaliation that Iran will use ‘weapons that we have never used’ to attack Israel. Iran’s President Ebrahim Raisi threatened a ‘painful and severe’ response if Israel takes even the ‘slightest action.’  

Doubling down on these warnings, Raisi, speaking at Iran’s annual army parade, issued a threat to launch a ‘massive and harsh’ retaliation if Israel launches even a ‘tiniest attack.’ And Iran’s Deputy Foreign Minister Ali Bagheri Kani vowed that the speed of response from Iran, if Israel strikes back, ‘will be less than a few seconds.’

The usual anti-Israel suspects were ratcheting up fear-mongering rhetoric, in an attempt to put pressure on Israel simply to ‘eat’ the provocative Iranian attack, in order to avoid further escalation. ‘The Middle East is on the brink,’ U.N. Secretary-General António Guterres told a Security Council meeting in response to the Iranian strikes. ‘The people of the region are confronting a real danger of a devastating full-scale conflict,’ he said, calling for maximum restraint. 

Russia’s Vladimir Putin warned against a ‘new round of confrontation fraught with catastrophic consequences for the entire region.’ Media outlets across the world ran headlines that evoked fears of open warfare breaking out between Israel and Iran, dangers of conflict escalation into a regional war that could drag the United States in. 

Following Raisi’s telephone call with Putin on April 17, fear spread from the doomsayers to the international ‘expert’ class. U.S., European and Middle Eastern intelligence officials and weapons experts privately expressed concerns, according to major U.S. media outlets, about Russia’s pledge to supply Iran with advanced fighter jets and air defense technology that are capable of destroying stealth fighter jets operated by the U.S. and Israel. Even President Biden reportedly urged Prime Minister Netanyahu to ‘take the win’ after Israel and its allies intercepted most of the missiles launched during Iran’s attack.

And then came the Israeli counterstrike. Kinetic. Precise, yet calibrated, using measured force. Stealth technology was likely used in what appeared to be a covert action, combining conventional warfare and special operations. The ayatollahs didn’t know what hit them. 

The Israeli strike took out Iranian air-defense missile batteries in Ishafan, rendering them inoperable. The choice of target – located near the Natanz enrichment facility that is critical to Tehran’s nuclear program – was deliberate.

The Israelis went after the very systems that are designed to prevent such attacks. It was, in Western military strategy parlance, a shot across the bow. And the message to Iran was clear – knock it off, or we will decimate the very crown jewel of your war-fighting machine – the nearly operational nuclear capability. Iran has playedits nuclear card as a psychological weapon to intimidate the region and the West and, most importantly, to manipulate Washington into giving the regime billions of dollars and other concessions.

Compare Israel’s limited albeit strategically commanding strike with that of Iranian airstrikes on Israel on April 13. Out of about 320 drones, cruise missiles and ballistic missiles, only 1% made it through combined Israeli, American, Jordanian and Saudi air defenses. The IDF’s spokesman, Rear Adm. Daniel Hagari, called it ‘a very significant strategic success,’ and it was 99% ineffective for Iran. It was a vivid display of impotence of the Iranian combat force.

It is no wonder that Tehran played down the Israeli counterstrike and almost immediately declared that it has no plans to respond. Shortly after Israel’s limited but highly effective strike, the Iranian foreign minister, Hossein Amirabdollahian, speaking in New York, where he was attending a U.N. Security Council session, stated that Iran would not escalate conflict. He belittled Israeli weapons as ‘toys that our children play with’ without acknowledging that the attacks came from Israel. 

Iran is considered by the U.S. intelligence community to be one of the top four threats to the United States. The other three are China, Russia and North Korea. The 2024 Annual Threat assessment issued by the Office of the Director of National Intelligence, characterized Iran’s ‘hybrid approach to warfare – using both conventional and unconventional capabilities’ – as posing a ‘threat to U.S. interests in the region for the foreseeable future.’ The report also noted that Iran’s ballistic missile programs have the largest inventory in the region, and highlighted that Tehran is putting emphasis on improving the accuracy, lethality and reliability of its missiles. 

While the threat posed by Iran cannot be underestimated, it is more of an asymmetric rather than conventional nature. For instance, Tehran has been developing clandestine networks inside the United States for more than a decade, with the goal of kidnapping, assassinating and otherwise harming high-level government officials and law enforcement and security personnel. The Iranian regime is now agitating the anti-Israel movement that is raging at universities across America.

But when it comes to conventional warfare, Israel clearly has demonstrated to the world that the Iranian military is not a match for it, and certainly not for the U.S. military.

This post appeared first on FOX NEWS

A 2020 social media post by then-presidential candidate Joe Biden blaming then-President Donald Trump for violence in the U.S. is drawing renewed criticism after violence has erupted on college campuses nationwide stemming from anti-Israel protests.

‘Remember: every example of violence Donald Trump decries has happened on his watch,’ Biden posted on Twitter, now known as X, in August 2020. ‘Under his leadership. During his presidency.’

Social media users have looked back on that post in recent days, given the increased violence and arrests being made as anti-Israel activists have caused chaos on over a dozen college campuses in recent weeks. 

‘It’s now the year 2024, three full years into Joe Biden’s presidency and Jewish students are being blocked from their college campuses, and being told to stay home and remote learn,’ conservative political commentator Stephen Miller recently posted on X.

‘Is this the soul of the nation healed?’

‘Joe Biden has looked the other way as Democrat foot soldiers hijack universities across America,’ Fox News contributor Lisa Boothe told Fox News Digital. ‘He’s more concerned about winning votes in Dearborn, Michigan, than condemning the 20-year-olds cheering for intifada.’

Former White House press secretary and Fox News contributor Ari Fleischer told Fox News Digital that President Biden ‘would be well served by reading his old tweets and taking action.’

‘There are antisemitic uprisings on campuses across the country, and all Joe Biden can do is passively sit there and hope they go away,’ Fleischer said. ‘He’s shown no leadership, despite this being far worse than the two-day Unite the Right protest in Charlottesville.’

David Avella, chairman of GOPAC and a veteran Republican strategist, told Fox News Digital that polling shows Americans feel less safe after three years of Biden.

‘Gallup reported more than 75% of Americans believe there’s more crime in the country than there was in 2022,’ Avella said. 

‘Whether Biden’s statements condemning violence are hollow have less impact on his re-election than the fact that Americans feel less safe. Forty percent of Americans said they were afraid to walk alone at night within a mile of their home,’ Avella continued. ‘The last time we were at this level was 1993. In the next election, President Clinton was at 46% approval and Republicans gained 54 seats in the House of Representatives, and gained eight seats in the Senate. President Biden is at 39% approval and Americans are watching violence occur every day.’

Conservatives on social media have recently resurfaced other posts from Biden during the summer of 2020, including a post where he said, ‘Does anyone believe there will be less violence in America if Donald Trump is reelected?’

Fox News Digital reached out to the White House for comment but did not receive a response.

President Biden respects the right to free expression, but protests must be peaceful and lawful,’ White House deputy press secretary Andrew Bates said Tuesday in a statement. ‘Forcibly taking over buildings is not peaceful — it is wrong. And hate speech and hate symbols have no place in America.’

This post appeared first on FOX NEWS

The House GOP rebels who ousted ex-House Speaker Kevin McCarthy in the fall are now hesitant to embrace the new push to boot current House Speaker Mike Johnson from the job.

‘I don’t think it’s a good idea. The support’s not there. I’m glad they’re getting it out of the way, but waiting another week just keeps it in the press,’ Rep. Tim Burchett, R-Tenn., said on Wednesday.

Burchett spoke with Fox News Digital hours after Rep. Marjorie Taylor Greene, R-Ga., announced she would force a House-wide vote on ousting Johnson, R-La., sometime next week via a procedural move known as a motion to vacate the chair. 

She filed her resolution in late March, but she is expected to note it as ‘privileged’ next week – meaning House leaders will have two legislative days to either call a vote on the measure itself or first try to kill it via a vote to table the resolution.

However, beyond finding impassioned support in Reps. Thomas Massie, R-Ky., and Paul Gosar, R-Ariz., Greene’s push has mostly fallen flat within the House GOP. That includes the seven remaining House Republicans out of the original eight who voted with Democrats to boot McCarthy, R-Calif., in early October.

When asked what was different about the situation now, Burchett told reporters the rebels were ‘100% sure that we’d put a Republican in.’

‘You’ve got Republicans in districts [where] Democrats won the White House by 15 points. So in an election year, anything can happen,’ he said.

Additionally, while nearly all the rebels expressed disappointment in their belief that Johnson has not fought hard enough for House GOP priorities since winning the gavel in late October, most were hesitant to say if they wanted to go through another midterm speaker election – while others outright rejected the idea.

‘I don’t support the motion to vacate. I’m still recovering from the first one,’ Rep. Nancy Mace, R-S.C. told Fox News Digital on Monday.

Rep. Matt Gaetz, R-Fla., who spearheaded McCarthy’s ouster, said, ‘I’ll probably support a motion to table it.’

When asked what he thought of Greene announcing she would force the vote next week, Gaetz told Fox News Digital, ‘I think everybody’s got the weekend to think about it.’

House Freedom Caucus Chairman Bob Good, R-Va., indicated last month that he wanted a new House GOP leader but pointed out that Republicans had a thinner majority than when he and the others forced out McCarthy. He has not indicated anything about changing his position since.

‘I think there’s a lot of dissatisfaction within the Republican Party. I think the speaker guarantees himself that there will be a contest for the speaker, I hope, in November. I think that’s the wise course when you’re sitting at a 216 to 213 margin,’ Good told reporters.

Similarly, both Reps. Eli Crane, R-Ariz., and Andy Biggs, R-Ariz., expressed displeasure with Johnson’s leadership but told CNN and The Hill respectively that a Johnson ouster is not likely right now.

Rep. Matt Rosendale, R-Mont., who is retiring at the end of this year, would not give reporters an indication of his thinking earlier this week.

‘It’s my understanding that even if she tries to move it, we’ve got, I don’t know, 48 hours to figure out what’s going to happen,’ Rosendale said. ‘So I guess I have plenty of time to think about it.’

When asked about their lukewarm reception to her push, Greene told Fox News Digital, ‘I think that’s the question you’ll have to ask them.’

‘But if they stand by the words and the statements that they made when they voted to oust Kevin McCarthy from the speakership after he basically did nothing wrong, I would think that they would be the first ones running to vote to vacate Mike Johnson,’ Greene said.

In comments to reporters alongside Greene, however, Massie said early on Wednesday evening that he anticipates more GOP support next week.

‘I’ll go out on a limb and predict there’ll be enough votes to show that Mike Johnson can’t be elected speaker in January because although he can get Democrat votes on a motion to table, it’s not a motion to table vote on January 3rd,’ Massie said, referring to closed-door House GOP leadership elections.

Both Massie and Greene were emphatically against toppling McCarthy last year.

The eighth Republican who voted to oust McCarthy, former Rep. Ken Buck, R-Colo., left the House in March before the end of his term.

This post appeared first on FOX NEWS

It was a poll that rattled the campaign world, disrupting the recent narrative that President Biden was closing the gap with former President Trump in the 2024 election rematch.

A survey that went viral on Sunday indicated Trump topping his Democratic successor by six points in a head-to-head match-up and by nine points in a five-candidate ballot that included Democrat turned independent contender Robert F. Kennedy, Jr., Green Party candidate Jill Stein and progressive professor Cornel West.

The CNN poll conducted by SSRS was instantly used as evidence by pundits – and as ammunition by Trump and his team – of the waning of the perceived polling bump the president enjoyed coming out of his well-regarded and aggressive State of the Union address in early March – when he went for the jugular in primetime with numerous salvos fired at his Republican predecessor.

Trump enjoyed the polling edge over Biden in an average of national horserace surveys dating back to last October, but the president’s numbers edged up in the weeks after the State of the Union address.

‘Biden’s position in the polls is improving against Trump,’ polling analyst Nate Silver said last month.

But Daron Shaw, a politics professor and chair at the University of Texas who serves as a member of the Fox News Decision Team and the Republican partner on the Fox News Poll, is skeptical.

‘If you want to really parse one-to-two-point shifts one way or the other, then I suppose if you squint very hard, you can convince yourself that he [Biden] bumped up one or two, and now he’s lost one of that,’ Shaw said.

Shaw, who served as a top strategist on former President George W. Bush’s 2000 and 2004 campaigns, emphasized that ‘the race has been fairly steady over much of the past nine months.’

Veteran pollster Chris Anderson, another member of the Fox News Election Decision Team, and the Democratic partner on the Fox News Poll, said that any bump was a small one.

‘There seemed to be, at the very least, a stabilization after the State of the Union,’ which tempered earlier perceptions of a Trump advantage.

And showcasing recent Fox News polls in the crucial swing states of Michigan, Wisconsin, Pennsylvania and Georgia, Anderson noted, ‘There were signs in there of a little bit of progress for Biden, but again it’s really small.’ 

While national surveys garner plenty of attention, the race for the White House is a battle for the states and their electoral votes, which places a spotlight on battleground state polling.

Analysts argue over how much the State of the Union address fueled the slight rise in the polls by Biden.

‘Simply Democrats coming home naturally, which they’ll probably do, versus State of the Union stuff,’ Shaw argued. ‘The main thing about the State of the Union was that it sort of stopped a conversation that was corrosive to Biden, that he’s too old and too feeble and not up to the task. That’s still there, but at least there are not daily stories about it. That was, I think, the success of the State of the Union.’

The CNN poll was followed a couple of days later by a Marist College survey for NPR and the PBS NewsHour that indicated Biden edging Trump by two-points in a head-to-head match-up, and tied with his GOP challenger in a five-candidate field.

A Quinnipiac University national survey in the field at the same time as CNN’s survey indicated Biden and Trump tied in both head-to-head and five-candidate showdowns, while an NBC News poll conducted a few days earlier put Trump up by two in a two-person race and Biden with a two-point edge when the third party and independent candidates were added.

With six months to go until Election Day, Shaw wondered whether the current polling dynamic would dramatically shift, baring major developments. 

Pointing to ‘an era of hyper-polarization where you’ve got two candidates who’ve already run against each other,’ Shaw noted that many voters already ‘know everything about both these two guys.’

‘So why would you expect much movement? What is it about this campaign that’s going to educate voters? Which is usually what’s happened in the past and why the numbers move around,’ he said.

Anderson agreed, spotlighting ‘that’s likely to be the story of this election as we go through, that the movement that we’re going to see is likely to be in the margins because so many people are locked in.’

Six months out, Anderson said, ‘it’s not looking good for Biden, but at the same time, you can see how his base comes home, and he pulls his coalition back together and is suddenly a couple of points higher than he is now.’

This post appeared first on FOX NEWS

House Democrats who furiously condemned attacks on police during the Jan. 6, 2021, riot at the U.S. Capitol are also speaking out against police being injured at the anti-Israel protests currently raging at universities across the country.

Fox News Digital reached out to all the remaining members of the now-defunct House select committee on January 6 as well as former Speaker Nancy Pelosi, D-Calif., and Rep. Eric Swalwell, D-Calif. – all Democrats who led criticism of how cops were treated in 2021 – to ask whether they would extend the same condemnation to those attacking police on college campuses. 

Rep. Zoe Lofgren, D-Calif., a member of the committee, told Fox News Digital that she condemned all attacks on law enforcement but panned comparisons to the Capitol riot.

‘I condemn attacks on police officers, full stop. At the Capitol and on campuses,’ Lofgren said. ‘It’s worth noting that what is happening on college campuses is not aimed at stopping the peaceful transfer of power or threatening our democratic system of government, so there is not a direct equivalency. Any attempt to sanitize the events on January 6th is a malicious one.’

Swalwell told Fox News Digital, ‘I condemn all violence against police officers.’

Similarly, a source familiar with the thinking of the former Jan. 6 committee chairman, Rep. Bennie Thompson, D-Miss., said he also condemns any form of violence.

It comes after reports of police officers being injured during anti-Israel protests at the University of Madison-Wisconsin, the University of Utah, and Emerson College in Boston, as well as violent clashes between students and police at the University of California at Los Angeles.

A report by the Government Accountability Office (GAO) published last year found that 114 Capitol Police officers were reported injured during the Capitol riot. One officer died on the scene of natural causes, and four more who were at the scene committed suicide in the seven months after the riot.

A spokesperson for Rep. Adam Schiff, D-Calif., would not directly weigh in on whether Schiff condemns the recent attacks against police specifically, but pointed Fox News Digital to earlier statements speaking out against attacks on Jewish students.

‘Over the past weeks, from Columbia University to UCLA and far too many campuses in between, many of those demonstrations have turned violent, and created unsafe and wholly unsustainable learning environments for all students. We’ve seen explicit, repeated targeting and intimidation of Jewish students – many of whom have been blocked from entering buildings or called unspeakable things on the basis of their faith and background. This is patently unacceptable and must end,’ Schiff said in one of the statements flagged.

Pelosi’s office did not respond to multiple requests for comment, nor did the offices of House Democratic Caucus Chair Pete Aguilar, D-Calif., or Rep. Jamie Raskin, D-Md., despite all three condemning attacks on police during the Jan. 6 riot.

In an October 2022 Jan. 6 committee hearing, Aguilar accused the pro-Trump protesters of ‘violently attacking the efforts of the brave men and women in law enforcement trying to resist the mob.’

Raskin said in a statement on the one-year anniversary of Jan. 6, ‘The attempted coup and insurrection left 150 law enforcement officers injured, wounded, traumatized or dead. Anyone who denies or minimizes this unprecedented assault on law enforcement can never call himself or herself ‘pro-law enforcement.’ That’s just political fraud.’

This post appeared first on FOX NEWS

All On The Same Track …. or?

The difference between equal-weighted sectors and cap-weighted sectors is obvious. The cap-weighted variant is much heavier and is impacted by the changes in some heavy-weight, often mega-cap, stocks.

Nevertheless, when you plot these sectors on Relative Rotation Graphs, you will often find that their tails generally move in the same direction and/or follow the same path.

When that does not happen, when the tails of the two versions of the same sector are on different paths or in completely different positions on the RRG, it’s time to investigate.

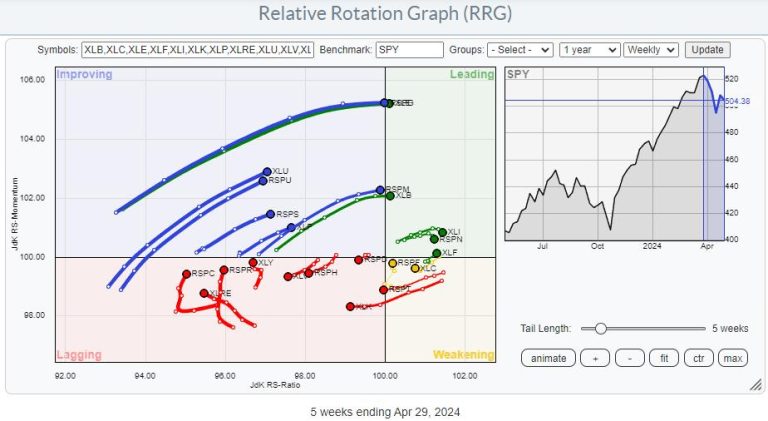
The RRG above shows the two universes, cap-weighted and equal-weighted, plotted on the same RRG and against SPY as the benchmark. Looking closely, you will find most sector pairs on the same trajectory. If you have a SC account, you can click on the graph, open the RRG in your own account, and do a closer inspection.

*You can save RRGs as bookmarks in your browser. By doing that, you can create your own custom RRGs and save them for later retrieval. Scroll to the bottom of the page, click “permalink,”

Zooming in

then save this link as a bookmark in your browser.

To get a better handle and a clearer picture, I have removed the sectors where bot tails are on similar trajectories and positions and only left the tails on the graph where they differ.

Two sectors remain. Consumer Discretionary and Communication Services.

Consumer Discretionary

Both tails are inside the lagging quadrant. However, that is as far as the comparison goes. XLY is moving higher on the RS-Momentum scale, indicating an improvement in relative momentum, while RSPD is moving lower and is on a negative RRG-Heading. Also, the tail on XLY is substantially longer than on RSPD, indicating the power behind the move.

Looking at the composition of the sector, it’s obvious which stocks inside Consumer Discretionary are causing the difference.

AMZN, TSLA, HD, and MCD comprise 50% of the index, while AMZN and TSLA are already 38%.

Looking at the performance over the last five weeks (tail length on the RRG), we can see how the sector’s performance has shifted to the large names. The table above shows the top 50 stocks in the discretionary sector. AMZN and TSLA are in the upper end of the range, and MCD is just above XLY, which is at position 17 out of 50…

This implies that most stocks are performing worse than that sector index. Roughly the bottom half is at double-digit declines. And still, while AMZN and TSLA are “only” up 2.4%, they drag the sector index up to around 1/3 of the entire universe, even with HD showing a 12.5% decline over that period.

Now, look at the same table. Instead of using XLY as the benchmark, we are now using RSPD as the benchmark.

RSPD is showing up at position 27 / 50. Right, where you’d expect an equal weight benchmark. In the middle of the universe, balancing out all the performances.

The bottom line is that XLY has been picking up recently only because of TSLA, AMZN, and MCD. But under the hood, most discretionary stocks are going through a horrible correction.

From a trading perspective, such observations can offer great pair trading ideas, XLY:RSPD

Communication Services

The tails for XLC and RSPC are also far apart on the RRG. XLC is still inside the weakening quadrant and has just started to show the first signs of curling back up. RSPC is deep inside the lagging quadrant at a really low reading on the RS-Ratio scale overall and is picking up relative momentum but no relative trend (RS-Ratio) yet.

Over the five-week period, XLC lost 2.8%, while RSPC lost 4.3%

The composition for this sector is even more top-heavy than Consumer Discretionary

META is listed as the top holding in XLC at 21%. But when we add up the weights for Alphabet A and B it comes out at 26%. So together the top two stocks in XLC are a whopping 47% of the sector.

Looking at the same table for XLC we find Alphabet at the top of the list over the last five weeks. Meta is in the lower part at -9%. The sector (XLC) comes in at -2.8% which means that META is UNDERperforming (-9% + 2.8% =) -6.2%.

But Alphabet Class A is OUTperforming (10.4% + 2.8% = ) 13.2% and Alphabet Class C is OUTperforming (10.6% + 2.8% = ) 13.4%. This is a way stronger upward pull for the index than the drag caused by META.

Changing the benchmark to the EW version of Communication Services shows this table

Again we see the equal weight benchmark (RSPC) dropping to near the middle of the list, balancing out the return more evenly.

All in all, this provides a similar pair trading opportunity. XLC:RSPC

This relative trend is much more mature than the XLY:RSPD pair, but as long as the rhythm of higher highs and higher lows continues, buying the dips in this relative line offers opportunities.

Most of the time the cap-weighted and equal-weighted versions of a sector will move more or less in tandem. But when they don’t they’re worth investigating as they may offer interesting trading opportunities.

#StayAlert and have a great weekend, –Julius

Advanced Micro Devices (AMD) slightly topped Wall Street’s earnings and guidance expectations on Tuesday, but, instead of rallying, its stock tumbled 7%. AMD was at its 61.8% Fibonacci retracement level, which, for many traders, can present an ideal “buy low” opportunity or a “get-ready-to-exit” threshold for those who bought the stock near the bottom of the uptrend. 

AMD’s decline brings several questions to the fore: Is AMD a buy or a sell? What technical or fundamental factors might drive this decision? What are the key levels to watch?

The Fundamental Picture

AMD’s EPS (61 cents) and revenue ($5.47 billion) barely edged above analyst consensus; they were practically in line with what Wall Street expected. The company’s current quarter estimates also matched analyst forecasts. It’s nothing bad, but nothing great, either.

The immense potential growth driver, however, is AMD’s forecasted sales of AI chips—around $4 billion this year. Still, the stock came tumbling down. So, if AMD’s plunge was the market’s way of correcting an overvaluation, then is the company’s AI chip forecast already baked into the current price level?

Analyst price targets are mixed. But before that, let’s look at the technical picture.

AMD and the AI Revolution

Viewing AMD stock on a weekly chart, you can see it has been trending downward since hitting an all-time high of $227.30 in March.

CHART 1. CHART OF AMD STOCK. AMD’s relative performance against NVIDIA, the leader in AI chips, begins sinking after November 2022. AMD is also trailing the semiconductor industry. Chart source: StockCharts.com. For educational purposes.

Returning to the second week of November 2022 (see vertical blue line), you can see AMD’s slow but steady climb relative to the larger Tech sector (XLK). That line marks the onset of the current AI trend, sparked by OpenAI’s public launch of ChatGPT. This budding AI “revolution” has thrust chipmakers like AMD into the limelight, positioning the industry as a fertile ground for expansion and a fiercely competitive arena for semiconductor companies.

So, while AMD is still outperforming the general Tech sector by 21%, it’s trailing the larger semiconductor industry ($DJUSSC) by -25.85% and NVIDIA, the world’s leading AI chipmaker, by a whopping 70%.

AMD missed the AI boat and fell drastically behind. However, according to its forecasts, AMD’s prospects of catching up are rapidly improving. So, is this what’s driving indecision at the current levels?

In AMD’s daily chart (see below), the stock is trading at the 61.8% Fib retracement level. This is a make-or-break level for traders: for those looking to go long, it represents a deep pullback (a break below this level increases the prospect’s bearishness). It also represents the lowest level to exit a long trade for those who got in toward the bottom of the latest uptrend.

CHART 2. DAILY CHART OF AMD. The stock is at a critical juncture, and its next move can trigger either a strong buy or sell signal, depending on the outcome and the underlying momentum.Chart source: StockCharts.com. For educational purposes.

The Money Flow Index (MFI) is trending upward, creating a bullish divergence between price and the buying pressure it represents. The Chaikin Money Flow (CMF) indicates stronger selling pressure. If you plan on going long, you want to see both indicators trending in the same direction.

3 Levels to Watch

The 61.8% Fib retracement line: A close below this level would invalidate and possibly reverse the longer-term uptrend.The $133 price range: The low of 2024 and high of 2023 may serve as the next level of support.The $124 price range: A cluster of resistance and consolidation levels in 2023, this range may serve as an even lower area of support; however, a break below can signal further downside risk.

What Are Analysts’ Price Targets?

Analyst price targets for 2024 are fairly wide:

The highest price target is between $265 and $270.The median price target sits between $185 and $190.The lowest price targets range between $120 and $140.

This suggests that the current price is near the bottom of the target range and well below the average to high consensus.

The Takeaway

With AMD’s earnings and guidance satisfactory, its stock sits at a critical juncture. Technically, AMD is at an optimal buy level, but momentum doesn’t seem to favor the bulls. Meanwhile, it’s uncertain whether AMD’s AI chip prospects are baked-in or underestimated. While you won’t be able to predict the outcome of AMD’s AI performance in the near term, you can see the technicals levels that might trigger a bounce or a bust. Momentum and price action are critical, so watch them closely in the next few days.

Disclaimer: This blog is for educational purposes only and should not be construed as financial advice. The ideas and strategies should never be used without first assessing your own personal and financial situation, or without consulting a financial professional.

Note to the reader: This is the nineteenth in a series of articles I’m publishing here taken from my book, “Investing with the Trend.” Hopefully, you will find this content useful. Market myths are generally perpetuated by repetition, misleading symbolic connections, and the complete ignorance of facts. The world of finance is full of such tendencies, and here, you’ll see some examples. Please keep in mind that not all of these examples are totally misleading — they are sometimes valid — but have too many holes in them to be worthwhile as investment concepts. And not all are directly related to investing and finance. Enjoy! – Greg

Relative Strength

Back in the 1970s, we used to have an indicator that looked at the volume on the American Stock Exchange (AMEX), also known as the curb, and the volume on the New York Stock Exchange (NYSE), known as the big board. It was called The Speculation Index. The AMEX consisted of small, relatively illiquid issues, generally all that could not make the listing requirements of the NYSE. The ratio of AMEX volume to NYSE volume was thought to represent excessive optimism when it reached a certain level.

In perfect hindsight, I think if we had used it as a trend indicator, it would have been more valuable. Identify the rising path of speculation and as the volume of the AMEX increased relative to that of the NYSE, you would be in a good uptrend.

Note: In 2008, the AMEX was acquired by the NYSE Euronext, which announced that the exchange would be renamed the NYSE Alternext US. The latter was renamed NYSE Amex Equities in March 2009. These changes have made stand-alone AMEX trading volumes difficult to source and track, as a result of which, the speculation index has lost much of its relevance as a measure of speculative activity.

Small-Cap vs. Large-Cap Component

Small-cap participation is critical for sustained uptrends in the market because small-caps reflect speculation and speculation is a requirement for uptrends. For small capitalization issues, the Russell 2000 Index is used, and for large capitalization issues, the venerable S&P 500 Index is used. The math is simply to create the ratio of the small to large, then use technical analysis to provide a normalized trend measure.

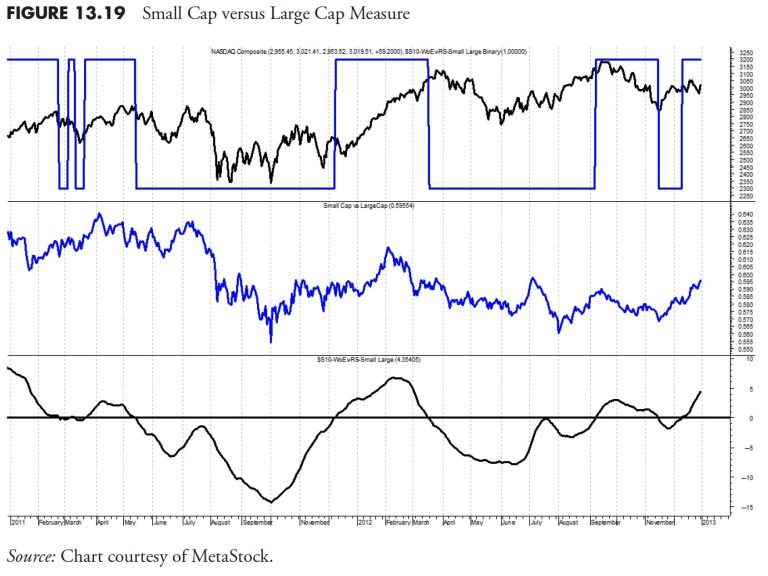
In Figure 13.19 the typical Nasdaq Composite is in the top plot, along with the small-cap large-cap binary. The middle plot is just the ratio of the small to large issues, and the lower plot is the small-cap large-cap weight of the evidence measure. In this example, you can see that small caps dominated the up move near the center of the chart, but have been relatively weak since. If you think about it, small caps also more closely relate to breadth.

Growth vs. Value Component

 This component of relative strength measures the difference between growth stocks and value stocks. Now this will shock most folks who have studied the markets, but I use small-cap issues for both the growth and value components. I was initially concerned that small cap value was almost an oxymoron, but the data has proved time and time again that it is perfectly valid. Figure 13.20 shows the growth value ratio in the middle, with the growth value weight of the evidence measure in the bottom plot and its binary overlaid in the top plot.

Breadth vs. Price Component

 There is only one more relative strength measure to view, the relationship between breadth and price. For breadth, a relationship between the advancing issues and the declining issues is used, while the Nasdaq Composite is used for price. The middle plot in Figure 13.21 shows the raw ratio of those two, with the price to breadth weight of the evidence measure in the lower plot and its binary in the top plot. This is an excellent example of how technical manipulation of the data can turn that noisy middle plot into something like the bottom plot, and a good trend measure.

Relative Strength Compound Measure

This compound measure (see the previous article) is designed to measure market sentiment. Are investors actively taking investment risk? Or are they behaving much more bearishly? Again, there are three indicators that drive this component and are shown above. These indicators look at the relationship between small-cap issues vs. large-cap issues, growth-oriented issues vs. value issues, and breadth measurements vs. price measurements.

For example, when small-caps are dominant (small-caps outperforming large-caps) it is generally a sign of more speculation taking place in the markets, as investors are willing to accept more risk. This is generally a good sign, and it is during these environments that the markets generally perform well historically. When large-caps are dominant, it is usually the result of a flight to quality, as investors are taking risk off the table. This type of investor sentiment usually results in less favorable market conditions.

A similar relationship exists between growth and value. When growth issues are outperforming, it is generally because the market is pricing in favorable growth estimates, and conversely, when value issues are dominating, it is because the market is no longer pricing in such optimistic positive growth estimates. The breadth vs. price measurement is similar to an equal-weighted measurement versus a capitalization-weighted measurement. Again, we are using three indicators in this component for confirmation purposes. When this relative strength component is on, it is adding value to the weight of the evidence of the model by letting me know that the sentiment in the markets is favorable and is viewed more as a trend confirmation measure versus a trend identification measure.

Figure 13.22 is a chart showing lots of data but includes all three components of the relative strength measure. The top plot is the Nasdaq Composite with the compound binary measure overlaid. The binary measure for each of the components is also shows overlaid on their respective plots.

Figure 13.23 is the same as the preceding figure, but with less data displayed.

Dominant Index

A concept known as the Dominant Index measures the relative strength between the Nasdaq Composite and the New York Stock Exchange (NYSE) Composite. The Nasdaq is generally dominated by small capitalization issues and the NYSE is dominated by large capitalization issues. Therefore, a measure that shows which is outperforming is also showing whether small cap issues are outperforming large-cap issues or vice versa.

Figure 13.24 shows the Nasdaq Composite and the NYSE Composite in the top plot, with the relationship between the two displayed in the bottom plot. Whenever the line is above the horizontal line, it means the Nasdaq is performing better than the NYSE. In the last decade, the Nasdaq has grown considerably with many more large-cap issues, which somewhat hampers this measure.

Trend Capturing Measure

This is a truly important compound measure, which can drive the weight of the evidence or hold it back. The trend capturing measure, like many compound measures, consists of three independent indicators of trend, and in this case two are based on breadth and one on price. Any two measures saying there is an uptrend will work.

Advance Decline Component

The advance decline component of the trend capturing measure uses the advances and declines difference and then mathematically puts that difference into a relationship similar to MACD (see Figure 13.25). The signals are given by the crossing of that formula with its shorter-term (10–18 periods) exponential moving average.

Up Volume/Down Volume Component

The up volume/down volume component of the trend capturing measure (see Figure 13.26) uses the up volume and the down volume in a similar manner as the advance and decline measure in Figure 13.25. One could assume that these would be very similar as they are tied to the same price movement, one by daily changes, and one by the amount of volume behind those changes. However, in the up volume/down volume, the parameters used are somewhat longer than in the advance decline component.

Price Component

The price component of the trend capturing measure (Figure 13.27), like the other two components, uses a similar relationship, but this one uses parameters that are longer than the other two.

Trend Capturing Compound Measure

This is a major component of my model, because it ties directly with the investment philosophy of identifying positive market trends that have a high probability of continuing into the future. I never predict; I only have an expectation that the identified trend will continue.

This component is a composite of three technical measurements. One is a price measure, and the other two are breadth measures, one of which uses up and down volume, and the other uses advancing and declining issues (see Figures 13.26 and 13.27). I use multiple indicators for confirmation purposes. For instance, when the first of these three indicators turns positive, it is telling us there is a positive price trend developing. When the second of these indicators turns positive, it provides confirmation of the trend, and if the third turns positive as well, I know I have a very solid trend in place. See Figure 13.28.

LTM—Long-Term Measure

Sometimes a good way to dampen things is to utilize a longer-term overlay measure, such as this Long-Term Measure (LTM). There are multiple ways to smooth out the noise in data, we’ve discussed one, the moving average, at length. The other, using weekly data, often does the same thing, sometimes even better.

The long-term measure uses only weekly data. It has many components, such as weekly advances and declines, weekly new high/new low data, weekly up volume and down volume data, plus a price component that measures the relationship among many market indices and tracks their position relative to their long-term moving average. All of that data is calculated and then put together in a fairly complex manner to give the binary indicator shown in the top plot of Figure 13.29. It has an intermediate level, sort of a transition zone so that, as the long-term components go from being on to off, they pause in the transition zone to ensure there is follow through. This is a fairly slow moving measure and is best used to identify cyclical moves in the market. The best place to find weekly breadth data is from Dow Jones and Company, in either Barron’s or The Wall Street Journal.

Figure 13.30 shows the long-term measure over a shorter time frame so you can better see the action of each measure.

Bull Market Confirmation Measure

The Bull Market Confirmation Measure is about as simple as it can get. (See Figure 13.31.) It just uses a 50 moving average and a filter to identify bull moves. It is calculated on the average price of the high, low, and close ((H+L+C)/3). The difference between the average price and its 50 period simple moving average is then adjusted to identifying only times when it is outside of the -5% and -10% range. As the average price drops below the -5% value it is a sell signal and when it rises above the -10% it is the buy signal. These crossover percentages are determined based on the price series you are using. They will probably be different for each one.

Figures 13.31 and 13.32 is the Bull Market Confirmation measure with less data, so that you can see the turning points easier.

Initial Trend Measures (ITM)

A significant enhancement to a trend following model is an early warning set of indicators. I call them Initial Trend Measures, or Early Trend Measures. They are designed to measure trends just like the weight of the evidence measure does, but use shorter term parameters in an attempt to pick up or identify the trend at an earlier stage in its development. You can use as many short-term trend measures as you need, but usually 3 is more than enough if you have them in different categories of trend measurement, such as price, breadth, and relative strength.

Figure 13.33 is one of the Initial Trend Measures that utilizes up volume compared to down volume. It can be either the Nasdaq data or the NYSE data. The top plot is the Nasdaq bar chart, with the indicator’s binary wave overlaid on the price bars. Recall that the binary is at the top when the indicator is above its moving average and at the bottom when it is below its moving average.

Figure 13.34 shows the Initial Trend Measure, which uses the advance decline data. Just like the other weight of the evidence measures, this uses an MACD approach.

Figure 13.35 is another ITM, this one using price, and in this case it is the Nasdaq Composite Index that is used. This measure is similar to the trend measure mentioned earlier, but using short-term parameters.

Figure 13.36 is a similar initial trend measure, but this one uses the NYSE Composite Index for price.

The Initial Trend Measures provide an alert mechanism for the weight of the evidence. You will also see their use in the next chapter when used along with the trade up rules.

Trend Gauge

This is a concept that was introduced to me by my friend Ted Wong (TTSWong Advisory), referring to the use of multiple market indices and measuring their relationship to their moving average.

Trend Gauge is comprised of Mega Trend Plus and Trend Strength. A concept that attempts to identify overall trendiness in the market is always going to be a valuable tool for a trend follower. For purposes of this example, I selected the ubiquitous 200-day exponential average, then smoothed the results with a three-day arithmetic average. There are a number of modifications one could do with this concept, including optimizing the moving average lengths for each of the market indices. I say that with this warning, optimization must be done properly to avoid curve fitting, and was discussed earlier in this chapter. I would start with moving average lengths that are closely tied to the trend lengths I want to focus on, and then use a short-term noise reduction smoothing like I did in this example.

Mega Trend Plus

Mega Trend Plus is constructed by selecting 11 major indexes with the longest historical database. One could easily make the case for more or less indices and which indices are to be included. I would suggest using enough indices to give you broad coverage over how you plan to make investments. The Mega Trend Plus is also used in the Long-Term Measure (LTM), but in that case it uses weekly data. Clearly if you are going to have a focus on international securities, you would want to include international indices. The list of indices used in this example is:

Nasdaq CompositeS&P 500S&P 100Russell 2000Russell 2000 GrowthRussell 2000 ValueNew York CompositeDow Jones IndustrialsDow Jones TransportsDow Jones UtilitiesValue Line Geometric

When the index is greater than its exponential moving average (EMA), it receives a +1; below its EMA, it receives a -1. Then the scores from all 11 indexes are summed and then normalized so the composite will have a range between 0% and 100%. An uptrending market is called when the composite is greater than or equal to 85%. A downtrending market is when the composite is less than or equal to 15%. Once a threshold is crossed, the market stance stays until the opposite threshold is penetrated. Hence Mega Trend Plus is a digital meter: either bull or bear.

Figure 13.37 shows the S&P 500 in the top plot, Mega Trend Plus in the lower plot, and the Mega Trend Plus binary overlaid on the S&P 500. The binary is at +1 when.ever Mega Trend Plus is greater than or equal to 85, at -1 whenever Mega Trend Plus is less than or equal to 15, and at zero when it is between 15 and 85. You can see that it does a reasonable job of trend identification. This is a weight of the evidence approach that is totally related to the concepts in this book.

Trend Strength

Trend Strength is a different composite, which is the sum of 11 ratios. For each market index, a ratio is calculated with this formula: (price/EMA–1) x 100 percent. The EMA lengths are identical to those used in Mega Trend Plus. The ratio depicts how far away (up or down) the index is positioned relative to its EMA. Hence, Trend Strength is an oscillating analog meter that measures the momentum of each of the 11 market indexes (see Figure 13.38).

Trend Gauge combines the readings from both the digital and analog meters (Mega Trend Plus and Trend Strength). It represents a weight of evidence approach in determining both the direction (digital) and the strength (analog) of the overall market trend. Figure 13.39 shows the S&P 500 in the top plot and Trend Gauge in the lower plot. Whenever the Trend Gauge is at +1, it has identified an uptrend; when at -1, it has identified a downtrend; and when at 0, there is neither an up- or downtrend (neutral).

Figure 13.40 is the same data as in Figure 13.39 , just over a much longer time frame. The beginning date in Figure 13.40 is 1992.

Measuring the market is a significant component to a good trend following, rules-based model. This article and the previous one have introduced many measures that can be used individually or in groups to assist in trend identification. Clearly, there were many measures introduced, and hopefully you can find a few that will fit your needs. Also, hopefully you will not use all of them, as many are similar with minor deviations in their concept.

Thanks for reading this far. I intend to publish one article in this series every week. Can’t wait? The book is for sale here.

In this edition of StockCharts TV‘s The Final Bar, Dave welcomes Adrian Zduńczyk, CMT of The ₿irb Nest. David recaps a busy earnings week, breaking down the charts of PTON, AAPL, and more. Adrian tracks the recent pullback for Bitcoin and why the long-term uptrend still remains the prevailing signal.

This video originally premiered on May 2, 2024. Watch on our dedicated Final Bar page on StockCharts TV!

New episodes of The Final Bar premiere every weekday afternoon. You can view all previously recorded episodes at this link.

Federal Reserve Chair Jerome Powell said Wednesday there was no sign of stagflation in the economy, even as inflation remains stubbornly high and some signs of slowing growth have started to emerge.

In remarks after the release of the Fed’s decision Wednesday to leave interest rates unchanged, Powell said he didn’t ‘really understand where talk of a stagflation scenario is coming from’ given the preponderance of solid economic data.

Historically, stagflation occurs when high unemployment, slow economic growth and high inflation all happen at the same time.

Powell compared today’s economy, with both inflation rates and the unemployment rate below 4%, to that of the 1970s, the decade when most economists consider stagflation to have taken root.

“I don’t see the stag, or the ’flation,” he said.

So far, most economists agree with Powell’s assessment. In a note to clients last week simply titled ‘No sign of ‘stagflation,” Bank of America analysts said the lower-than-expected gross domestic product report for the first quarter was mostly a function of accounting, not of softening underlying demand.

‘Consumer spending … remains resilient,’ the analysts said — though it is likely that the spending is helping keep inflation rights high, they added.

‘We think that view [of growing stagflation] is misguided,’ they wrote.

Pantheon Macroeconomics chief economist Ian Shepherdson likewise said in a recent note to clients that despite weaker manufacturing data, fears the U.S. could slip into stagflation should be ‘ignored’ given data points showing a slow but steady softening in price increases.

‘Stagnant manufacturing output has not stopped the overall US economy from growing at a very brisk pace on average over the past couple years,’ Shepherdson wrote.

Today’s U.S. economy does look much better than that of the 1970s, according to most data. The ’70s were marked by oil-supply shocks that caused gasoline prices to soar, alongside a confluence of other factors, including the impact of leaving the gold standard, more powerful unions that could demand higher wages and the winding down of government price control policies.

In 2024, in contrast, wage growth has largely kept pace with inflation — though it has not surpassed it. And the effect of the pandemic on the prices of food and other goods has also largely subsided.

Meanwhile, although interest rates are high, they are lower than where they stood 50 years ago.

As for fuel prices, the average cost of a gallon of gasoline in 1974 is not much different today on an inflation-adjusted basis.

In May of that year, it was 53 cents per gallon, the equivalent of $3.41 today, which is not far off from what the average price actually is right now, according to AAA: about $3.66.

In his news conference Wednesday, Powell said the central bank had ‘the luxury of strong growth and a strong labor market” to keep rates at their current level of 5.25% to 5.5% to give inflation a chance to subside — and he ruled out further rate hikes.

What is less clear is how long inflation will remain above the Fed’s 2% target.

‘Mostly, it is shelter that has been keeping monthly increases in inflation on the high side,’ Moody’s economist Matt Colyer wrote in a note Wednesday.

‘However, as the list of contributors has grown to include components like auto insurance and healthcare, it becomes harder to look past them. For that reason, the Fed will need to see a sustained period of disinflation before it announces its first rate cut.’

This post appeared first on NBC NEWS