Archive

2024

Browsing

Internal communications of executives from Big Tech companies reveal ‘damning discoveries’ of the Biden administration’s attempt to muzzle the platforms, a new House committee report published this week revealed.

Following House Judiciary Chairman Jim Jordan’s (R-Ohio) subpoena last year, tech giants like Google-parent Alphabet, Amazon, Apple, Meta and Microsoft were investigated regarding their communications with the federal government. Jordan said at the time that he wanted to ‘understand how and to what extent the Executive Branch coerced and colluded with companies and other intermediaries to censor speech.’ 

The House Judiciary Committee’s 800-page report, titled ‘The Censorship-industrial Complex: How Top Biden White House Officials Coerced Big Tech to Censor Americans, True Information, and Critics of the Biden Administration,’ included several instances where the platforms censored information relating to COVID-19 due to top-down pressure.

The emails also revealed the Biden administration wanted to crack down on ‘vaccine misinformation,’ while some executives were unwilling to cave to the pressure. Other executives did give in, to limit bigger issues.

‘Now, having obtained and reviewed tens of thousands of emails and other relevant nonpublic documents, the Committee and Select Subcommittee can provide a more complete picture of how and the extent to which the Biden White House coerced companies to suppress free speech,’ the report noted.

Big Tech altered their content-moderation policies in 2021, the report said. Facebook, YouTube and Amazon all adjusted their policies to censor information ranging from COVID-19 ‘misinformation’ to what kinds of books were permissible on the Amazon Marketplace.

‘Indeed, both Facebook and Amazon referred to the Biden White House’s efforts as ‘pressure,” the report said.

The Biden White House’s censorship campaign also targeted true information, satire and other content not violating platform policies, according to the report. Internal emails from Facebook executives in July 2021 show that Facebook understood the Biden White House’s position as wanting ‘negative information on or opinions about the vaccine’ removed as well as ‘humorous or satirical content that suggests the vaccine isn’t safe.’

Facebook executive Nick Clegg questioned in July 2021 via email why the company censored the lab-leak theory of COVID-19. An employee replied, ‘Because we were under pressure from the [Biden] administration and others to do more…. We shouldn’t have done it.’

Another instance in July 2021 revealed Facebook executives attempting to appease the Biden administration. Clegg emailed colleagues in the company that ‘[g]iven the bigger fish we have to fry with the [Biden] Administration,’ Facebook should try to figure out ‘how we can be responsive to [the Administration’s] concerns.’

The report comes as big tech companies have been under fire by both Republicans and Democrats in recent months. The Supreme Court heard arguments in March challenging the Biden administration’s alleged coordination with Big Tech to censor certain political messages. 

This post appeared first on FOX NEWS

President Biden honored 19 individuals with the United States’ highest civilian award on Friday, many of whom are Democratic allies.

The White House announced the roster for the annual Presidential Medal of Freedom ceremony, with notable recipients including former Speaker of the House Nancy Pelosi, former New York City Mayor Michael Bloomberg, former Vice-President Al Gore, and former Secretary of State John Kerry.

Democratic Rep. Jim Clyburn of South Carolina, who gave Biden a critical endorsement in the 2020 primary, also received the medal.

‘The Presidential Medal of Freedom, our nation’s highest civilian award — we the people doing what we can to ensure the idea of America, the cause of freedom, shines like the sun to light up the future of the world,’ Biden said of the medal in a video promoting the latest recipients.

Civil rights leaders are well-represented among the recipients, including: LGBTQ activist Judy Shepard, Juneteenth recognition advocate Opal Lee, lawyer Clarence Jones, and Mississippi civil rights leader Medgar Evers. 

United Farm Workers president Teresa Romero received the award — as well as Catholic priest Fr. Greg Boyle, an anti-gang ministry organizer.

Other recipients include long-time talk-show host Phil Donahue, Olympian Katie Ledecky, Malaysian actress Michelle Yeoh, astronomer Jane Rigby, and former NASA Johnson Space Center director Ellen Ochoa.

The first American Indian Olympic gold medalist, Jim Thorpe, received a posthumous award — as did the late Democratic Sen. Frank Lautenberg of New Jersey.

The only Republican lawmaker recognized is former Sen. Elizabeth Dole, who served in the cabinets of Presidents Ronald Reagan and George H.W. Bush.

The Presidential Medal of Freedom was established in 1963 by President John F. Kennedy. It replaced the Medal of Freedom established by President Harry S. Truman in 1945, which honored individuals who rendered significant aid to the U.S. in World War II.

It is the highest civilian award in the nation and is intended to recognize ‘any person who has made an especially meritorious contribution to (1) the security or national interests of the United States, or (2) world peace, or (3) cultural or other significant public or private endeavors.’

Biden himself received the medal from then-President Barack Obama while serving as his vice president on Jan. 12, 2017.

This post appeared first on FOX NEWS

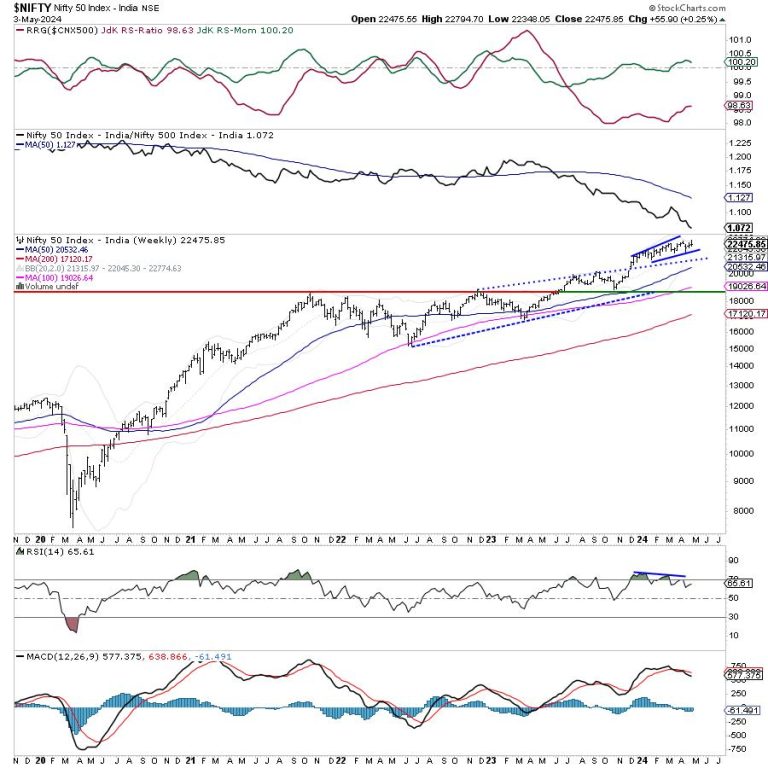
The markets traded in a much wider range in the past trading week. Over the past few days, we had seen the markets and the VIX inching higher, i.e., moving in the same direction. In the previous technical note, we had expressly mentioned this concern as instances of VIX and the Index rising higher simultaneously often end up showing a warning sign of an impending corrective move. The last trading day of the week saw the Index swinging wildly. During the week, the Nifty oscillated in a 446.65 range before closing the week on a flat note. The benchmark Index posted minor weekly gains of 55.90 points (+0.25%)

There is something more that needs to be noted from a technical perspective. While the Nifty has stayed flat, the volatility has shown a huge spike. This is evident from the India Vix spiking by a massive 33.80% to 14.62. This continues to show some quantum of uneasiness in the markets. More so, the rise in the VIX and the NIFTY over the past few days has made the markets vulnerable to profit-taking bouts like the one seen on Friday. Historical data shows that often through such behavior, VIX has ended up issuing prior warnings to any impending profit-taking bout. The NIFTY did mark its fresh lifetime high of 22794.70; however, the 22775 level still remains an immediate top for the markets as it was not taken out convincingly. In short, so long as Nifty stays below 22775, it is likely to consolidate in a broad trading range showing volatile moves on either side.

Monday is likely to see a stable start to the trade. The levels of 22650 and 22775 are likely to act as potential resistance levels. The supports come in at 22300 and 22050 levels.

The weekly RSI is 65.61; it stays neutral and does not show any divergence against the price. The weekly MACD stays bearish and trades below its signal line. A Doji has been formed on the candle; its emergence near the high point has the potential to disrupt the ongoing trend in the markets. Historically, Doji’s have been more potent comparatively to form reversals; however, they would need confirmation on the next bar.

The pattern analysis of the weekly chart shows that Nifty continues to trade in a small rising channel and the 20-week MA which is currently placed at 22045 happens to be the nearest support for the Index. If this level gets violated, then it would be the first sign of the markets likely taking some breather and the present trend getting temporarily disrupted.

All in all, the markets are likely to adopt some defensive bias in the future; we may see some defensive pockets doing well over the coming days. Some technical rebounds too can be expected. However, it is strongly recommended that we use these technical rebounds as and when they occur to protect the profits at higher levels. Fresh purchases should be made extremely carefully and only in the stocks that are developing or bettering their relative strength against the broader markets. A cautious approach is advised for the coming week.

Sector Analysis for the coming week

In our look at Relative Rotation Graphs®, we compared various sectors against CNX500 (NIFTY 500 Index), which represents over 95% of the free float market cap of all the stocks listed.

Relative Rotation Graphs (RRG) show that only Nifty Metal, Auto, and Consumption Indices are inside the leading quadrant. Among these, though the Auto group is seeing some paring of relative momentum, these groups are likely to relatively outperform the broader markets collectively.

The Nifty Commodities, Energy, Midcap 100, Realty, PSE, PSUBank, Infrastructure, and Pharma indices are inside the weakening quadrant. They are expected to slow down on their relative performance; individual stock-specific shows may be seen.

While Nifty IT continues to languish inside the lagging quadrant, the FMCG and Media Indices are seen improving on their relative momentum against the broader Nifty 500 index.

Banknifty, Nifty Financial Services, and Service Sector Indices are inside the improving quadrant; they are expected to continue bettering their relative performance against the broader markets.

Important Note: RRG™ charts show the relative strength and momentum of a group of stocks. In the above Chart, they show relative performance against NIFTY500 Index (Broader Markets) and should not be used directly as buy or sell signals.  

Milan Vaishnav, CMT, MSTA

Consulting Technical Analyst

www.EquityResearch.asia | www.ChartWizard.ae

In this edition of StockCharts TV‘s The Final Bar, Dave opens The Final Bar mailbag to answer viewer questions on the Nasdaq Bullish Percent Index, the value of long-term technical analysis techniques, how sentiment indicators relate to the market trend, and how the CMT program helped him improve his technical analysis approach.

This video originally premiered on May 3, 2024. Watch on our dedicated Final Bar page on StockCharts TV!

New episodes of The Final Bar premiere every weekday afternoon. You can view all previously recorded episodes at this link.

The weaker-than-expected jobs report gave the stock market some direction, a nice treat before the 150th Kentucky Derby. Job growth slowed, and the unemployment rate ticked up to 3.9%. If this trend continues, the market may price in more than one interest rate cut this year.

This week’s price action gives the impression that the stock market is still uncertain and can’t decide which way it wants to go. It’s unclear whether Friday’s move is enough to carry the market higher.

The broader equity market indexes moved higher on the news. The Dow Jones Industrial Average ($INDU) and S&P 500 ($SPX) reached their 50-day simple moving average (SMA) but didn’t close above that level. The Nasdaq Composite ($COMPQ) managed to move above its 50-day SMA as several tech stocks moved higher; however, the index didn’t show much upside conviction.

Tech Back in the Lead

View live chart here.

The daily chart of the Technology Select Sector SPDR ETF (XLK) below shows the breakout from the recent downtrend. It will be interesting to see if XLK can break through the resistance of its 50-day SMA. 

CHART 1. DAILY CHART OF XLK. The ETF broke its recent short-term downtrend, but a breakout above its 50-day SMA is critical.Chart source: StockCharts.com. For educational purposes.

The rotation back into the tech sector shows that investors are still gravitating toward technology stocks. Apple (AAPL) may have helped ignite interest when it reported better-than-expected earnings. Apple’s stock price experienced a steep downfall, which may have now reversed.

Follow the live chart.

Apple’s price shows strength after its significant gap up, following the earnings report (see chart below). The StockCharts Technical Ranking (SCTR) score (upper panel) is moving higher and is now shy of 50. Its Relative Strength Index (RSI) is also close to the 70 level. This would be a stock to add to your ChartList.

CHART 2. APPLE SOARS AFTER EARNINGS REPORT. Will the rise in Apple’s stock price have enough momentum and follow through to push it higher?Chart source: StockCharts.com. For educational purposes.

Shares of Nvidia Corp. (NVDA), Microsoft (MSFT), Amazon (AMZN), and Meta (META) are trading higher. If you want to add more tech stocks to your portfolio, you may want to wait to see some follow-through to the upside before jumping in.

The Big Picture

The market pretty much made up the losses for the week, but the broader equity indexes haven’t pushed through their resistance levels. They climbed higher in the early trading hours, but stalled and stayed relatively flat for most of the trading day. Anyone who was watching the markets will know it was like watching paint dry for most of the day. It is Friday, and investors may not want to add positions, especially since the market looked like it was in correction territory this week.

The Dow gapped up in the early trading hours, but hung out at its 50-day SMA. The S&P 500 broke out to the upside of what looks like a bear flag formation, but it also hung on to its 50-day SMA. The Nasdaq Composite is looking the most bullish of the three indexes, as it broke above its 50-day SMA but hung out there.

Follow the live chart.

Even bond prices were stagnant. The daily chart of the iShares 20+ Year Treasury Bond ETF (TLT) shows that bond prices rose, but didn’t move much for most of the trading day.

CHART 3. DAILY CHART OF TLT. Bonds prices rose on Friday, but still have a long way to go before showing signs of an uptrend.Chart source: StockCharts.com. For educational purposes.

The good news: The CBOE Volatility Index ($VIX) is back below 15 levels, an indication that investors aren’t necessarily fearful and the market didn’t fade at the close.

There’s not much economic data next week. There are a few earnings to pay attention to, but a big chunk is in the rear-view mirror. The market could continue its indecisive behavior next week. We’ll have to wait and see. It may be a good time to put your stock market thoughts aside and shift your focus to watching the Derby.

End-of-Week Wrap-Up

S&P 500 closes up 1.26% at 5127.78, Dow Jones Industrial Average up 1.18% at 38,675.88; Nasdaq Composite up 1.99% at 16,156.33$VIX down 7.97% at 13.51Best performing sector for the week: UtilitiesWorst performing sector for the week: EnergyTop 5 Large Cap SCTR stocks: Super Micro Computer, Inc. (SMCI); Vistra Energy Corp. (VST); Vertiv Holdings (VRT); MicroStrategy Inc. (MSTR); Coinbase Global Inc. (COIN)

On the Radar Next Week

Several Fed speechesEarnings from Berkshire Hathaway (BRK/B) reporting on Saturday, BioNTech (BNTX), Walt Disney (DIS), Palantir Technologies (PLTR), and Duke Energy (DUK), Uber (UBER), among others.

Disclaimer: This blog is for educational purposes only and should not be construed as financial advice. The ideas and strategies should never be used without first assessing your own personal and financial situation, or without consulting a financial professional.

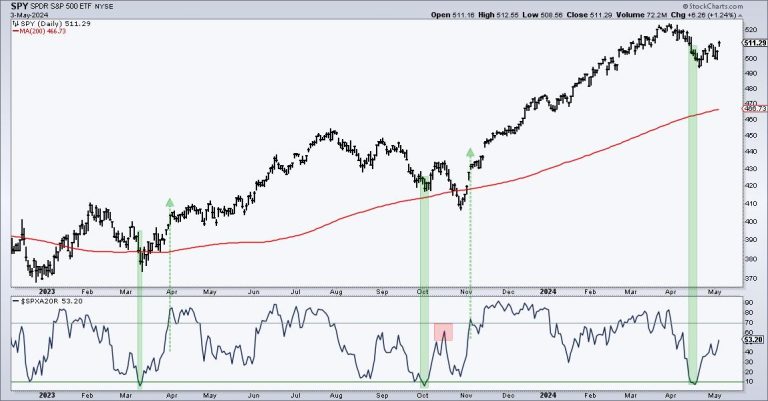
Stocks fell sharply into late April and then rebounded over the last two weeks. SPY fell 5.34% from March 28th to April 19th and then rebounded with a 3.26% gain the last two weeks. Does this bounce have legs? Chartists can separate serious bounces from dead-cat bounces using breadth. Today’s example will use the S&P 500 and the percentage of S&P 500 stocks their 20 day SMAs.  

There are two steps. First, the indicator needs to become oversold (setup). Second, we need to see a significant increase (breakout) in upside participation (signal). An oversold reading signals a significant decline and provides the setup for a bounce. Aggressive traders can trade the oversold condition. A subsequent move above the breakout level signals adequate participation to sustain the advance. Now comes the subjective part. We must choose our oversold and breakout levels. I am choosing 10 and 70 percent for SPX %Above 20-day SMA.

The green shading on the chart above shows when SPX %Above 20-day became oversold and the green arrow-lines mark the subsequent move above 70%. There were setup-signals in March-April and again in October-November. Both led to significant bounces. Notice the red shading where the indicator failed to clear 70% in mid October. This was a feeble bounce and SPY moved to a new low in late October. SPX %Above 20-day then surged above 70% in early November for a signal.  Recently, the indicator became oversold here in mid April for a setup and moved back above 50% this week. An oversold bounce is indeed underway, but I need to see a move above 70% to show a participation breakout.

We are monitoring the rebound in the S&P 500 and Nasdaq 100 at TrendInvestorPro (ChartTrader). Our 10 indicator composite indicator became oversold in mid April, but we have yet to see the required breadth thrust to signal a strong increase in participation. ChartTrader reports and videos provide broad market timing signals and trading setups for leading stocks and ETFs. This week we featured setups in the T-Bond ETF (TLT), the Biotech SPDR (XBI) and four Tech ETFs (IGV, SOXX, CIBR, SKYY). Click here for immediate access.

//////////////////////////////////////////////////

In this episode of StockCharts TV‘s The MEM Edge, Mary Ellen reviews the key drivers for this week’s volatile period, including Core PCE and GDP numbers. She takes a look at where the S&P 500 and NASDAQ closed for the week and whether it’s safe to put new money to work. Several stocks gapped up into base breakouts, and Mary Ellen covers these as well.

This video originally premiered May 3, 2024. Click here or on the above image to watch on our dedicated MEM Edge page on StockCharts TV.

New episodes of The MEM Edge premiere weekly on Fridays. You can view all previously recorded episodes at this link.

If you’re looking for stocks to invest in, be sure to check out the MEM Edge Report! This report gives you detailed information on the top sectors, industries and stocks so you can make informed investment decisions.

As investors flock to Omaha, Nebraska in their annual pilgrimage to learn from the great Warren Buffett, it seems an opportune time to reflect on the technical evidence for Berkshire’s biggest holding, Apple (AAPL).

Today, we’ll consider AAPL using “multiple time frame analysis”, in which we analyze the same stock from three different time frames. This allows us to think about how the short-term fluctuations relate the medium-term trend, and how the medium-term trend fits into the longer-term secular trends at play.

First, let’s consider the short-term time frame using the daily chart.

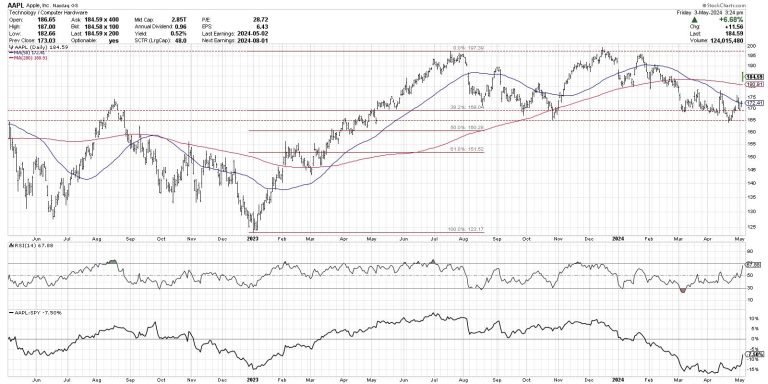
After an earnings release this week that disappointed investors on weaker iPhone sales, yet thrilled investors at the announcement of the largest buyback in Apple’s history, the stock gapped higher on Friday above the 200-day moving average. After the last two months of lower highs and lower lows, combined with RSI levels very consistent with bearish phases, the stock finally appears to have reversed that downtrend with higher prices and improved momentum.

For now, remaining above the 200-day moving average after the gap higher on Friday remains the most important factor on the daily chart. It will be very telling in the days and weeks to come if additional buyers are willing to step in and pay even more for this long-term market outperformer!

For the medium-term time frame, let’s consider the last ten months of price action, starting with the July 2023 high around $197. After achieving that peak, AAPL pulled back to a 38.2% retracement of the 2023 rally phase, finding support right around $169. Over the subsequent seven-to-eight months, Apple has been rangebound, bouncing between retests of the all-time high before returning down to test support in the $165-169 range.

This week’s gap higher appears to confirm that support in that range has once again held strong, giving a clear floor to the price action for the last year. With improving momentum, in the form of the RSI pushing above 60 on this rally, the stock appears to be strengthening. But until we see a confirmed break above the previous high around $197, I’m inclined to label the medium-term time frame as “neutral.”

Now let’s consider the long-term trend using the weekly chart.

Quite simply, the long-term picture for AAPL is exceptionally strong. Since the 2009 market low, the stock has experienced numerous tests of an ascending 150-week moving average. And in 100% of those tests, the stock has rebounded higher, eventually making a new all-time high soon after.

Note the RSI levels on the weekly chart, showing that the momentum remains in the bullish range since late 2018. This suggests that the long-term momentum is positive, and that pullbacks to moving average support should be considered opportunities to capitalize on short-term market weakness.

Do you think Apple provides a decent opportunity in Q2, after pulling back to test long-term moving average support? Watch the video below, and then drop a comment there with your vote!

RR#6,

Dave

P.S. Ready to upgrade your investment process? Check out my free behavioral investing course!

David Keller, CMT

Chief Market Strategist

StockCharts.com

Disclaimer: This blog is for educational purposes only and should not be construed as financial advice. The ideas and strategies should never be used without first assessing your own personal and financial situation, or without consulting a financial professional.

The author does not have a position in mentioned securities at the time of publication. Any opinions expressed herein are solely those of the author and do not in any way represent the views or opinions of any other person or entity.

Johnson & Johnson on Wednesday said it plans to pay $6.5 billion over 25 years to settle nearly all of the thousands of lawsuits in the U.S. claiming its talc-based products caused ovarian cancer, pending approval of the claimants.

Those cases have for decades caused financial and public relations trouble for J&J, which contends that its now-discontinued talc baby powder and other talc products are safe for consumers. About 99% of the talc-related lawsuits filed against J&J and its subsidiaries stem from ovarian cancer. 

The company recorded a charge of about $2.7 billion in the first quarter to raise its reserve for talc claims to about $11 billion.

The deal, pending approval by claimants, would allow J&J to resolve the lawsuits through a third bankruptcy filing of a subsidiary company, LTL Management. Courts have rebuffed J&J’s two previous efforts to resolve the lawsuits through the bankruptcy of that subsidiary, which was created to absorb the company’s talc liabilities.

J&J will begin a three-month voting period for claimants, in hopes of reaching a 75% support threshold needed for a bankruptcy settlement that would end the litigation entirely and prevent future lawsuits. Claimants did not have the opportunity to vote in LTL Management’s previous bankruptcy cases, J&J executives said on a call with investors on Wednesday.

J&J has the “significant support of the overwhelming majority of the claimants” based on conversations with their lawyers or representation, the executives added.

“We firmly believe this plan is in the best interest of claimants and should receive a favorable and immediate confirmation from the bankruptcy court,” said Erik Haas, J&J’s worldwide vice president of litigation, during the call.

He contended the settlement is a far better recovery for claimants than would be likely in a trial.

“As that track record shows, most of bearing claimants have not recovered, nor are they expected to ever recover anything at trial,” Haas said. “At the rate at which use cases have been tried, it would take decades to try the remaining cases meaning most claimants will never see their day in court.”

Still, litigation has resulted in some large verdicts for claimants. That includes a roughly $2 billion award in favor of 22 women who blamed their ovarian cancer on asbestos in J&J’s talc products.

Shares of J&J rose more than 2% in premarket trading Wednesday.

J&J said the remaining pending lawsuits relate to a rare cancer called mesothelioma and will be addressed outside of the new settlement plan. The pharmaceutical giant said it has already resolved 95% of mesothelioma lawsuits filed to date.

J&J noted on Wednesday that it has reached “final and comprehensive” settlements to resolve an investigation by a coalition of more than 40 states into claims the company misled patients about the safety of its talc baby powder and other talc-based products.

The company has also reached an agreement in principle to resolve claims brought by suppliers of its talc, which include Imerys Talc America, Cyprus Mines Corporation and their related parties.

This post appeared first on NBC NEWS

Just ahead of its blowout first-quarter earnings report on April 25, Google laid off at least 200 employees from its “Core” teams, in a reorganization that will include moving some roles to India and Mexico, CNBC has learned.

The Core unit is responsible for building the technical foundation behind the company’s flagship products and for protecting users’ online safety, according to Google’s website. Core teams include key technical units from information technology, its Python developer team, technical infrastructure, security foundation, app platforms, core developers, and various engineering roles.

At least 50 of the positions eliminated were in engineering at the company’s offices in Sunnyvale, California, filings show. Many Core teams will hire corresponding roles in Mexico and India, according to internal documents viewed by CNBC.

Asim Husain, vice president of Google Developer Ecosystem, announced news of the layoffs to his team in an email last week. He also spoke at a town hall and told employees that this was the biggest planned reduction for his team this year, an internal document shows.

“We intend to maintain our current global footprint while also expanding in high-growth global workforce locations so that we can operate closer to our partners and developer communities,” Husain wrote in the email.

Alphabet has been slashing headcount since early last year, when the company announced plans to eliminate about 12,000 jobs, or 6% of its workforce, following a downturn in the online ad market. Even with digital advertising rebounding recently, Alphabet has continued downsizing, with layoffs across multiple organizations this year.

Chief Financial Officer Ruth Porat announced in mid-April that the company’s finance department would undergo restructuring, entailing layoffs and moving positions to Bangalore and Mexico City. The company’s search boss, Prabhakar Raghavan, told employees at an all-hands meeting in March that Google plans to build teams closer to users in key markets, including India and Brazil, where labor is cheaper than in the U.S.

The latest cuts come as the company enjoys its fastest growth rate since early 2022, alongside improving profit margins. Last week, Alphabet reported a 15% jump in first-quarter revenue from a year earlier and announced its first-ever dividend and a $70 billion buyback.  

“Announcements of this sort may leave many of you feeling uncertain or frustrated,” Husain wrote in the email to developers. He added that his message to developers is that the changes “are in service of our broader goals” as a company.

The teams involved in the reorganization have been key to the company’s developer tools, an area Google is streamlining as it incorporates more artificial intelligence into the products. In February, Google announced a major rebrand of its chatbot from Bard to Gemini, the same name as the suit of AI models that power it.

Alphabet is gearing up for its annual developer conference, Google I/O, on May 14, where the company traditionally reveals new developer products and tools underway during the prior year. Husain said in a memo explaining the developer changes that generative AI is at an “inflection point.”

“Recent advances in Generative AI across the industry, including Google’s Gemini, are changing the very nature of software development as we know it,” Husain wrote.

In a separate email, Pankaj Rohatgi, Google’s security engineering vice president, told his team, “In order to optimize for our business goals, we are expanding work to other locations, which will result in some role eliminations and proposed role eliminations.”

The Core layoffs also include the governance and protected data group, which will be at the center of regulatory challenges facing the company, particularly as lawmakers across the globe focus more on developments in AI. The European Union’s Digital Markets Act, which went into effect in March, aims to clamp down on anti-competitive practices in tech.

Evan Kotsovinos, Google’s vice president of governance and protected data, addressed the upcoming changes last week.

Kotsovinos in an email said the team’s success means responding to “escalating regulatory focus” and is contingent on “moving faster.”

Raghavan, Google’s senior vice president overseeing search, recently referenced heightened competition, a more challenging regulatory environment, and slower organic growth as the company’s “new operating reality.”

When reached for comment, Google confirmed the Core reorganization and layoffs, and a spokesperson told CNBC that employees will be able to apply for open roles within Google and to access outplacement services.

“As we’ve said, we’re responsibly investing in our company’s biggest priorities and the significant opportunities ahead,” the spokesperson said in an email. “A number of our teams made changes to become more efficient and work better, remove layers and align their resources to their biggest product priorities.”

This post appeared first on NBC NEWS