Archive

2024

Browsing

In this video from StockCharts TV, Julius shares a rare RRG rotational pattern that he’s never seen before! He then follows up with a breakdown of the current sector rotation into offensive, defensive, and sensitive, and finds that only one sector is on a positive relative trajectory… which one would that be?

This video was originally broadcast on June 18, 2024. Click anywhere on the icon above to view on our dedicated page for Julius.

Past episodes of Julius’ shows can be found here.

#StayAlert, -Julius

We’re heading deeper into the summer months, which usually means higher demand for energy products, namely crude oil and gas. While demand tends to be seasonal, the entire crude complex is also sensitive to changes in macroeconomic and geopolitical environments.

In short, all traders and investors understand that it’s not a viable strategy to “go long” in energy commodities every June in anticipation of price increases. Still, the seasonal context is worth looking at and comparing to both the current price situation and fundamental forecasts.

What Are Analysts Saying?

Crude oil prices continue to rise, marking its best performance since April, following a three-week streak of declines. Analysts expect summer fuel demand to draw down inventories and tighten the market, with oil stockpiles projected to decrease by 850,000 barrels per day in the third quarter.

Despite mixed economic data from China and US consumer sentiment prompting analysts to forecast weakness in energy demand, the oil market still looks like it will tighten deeper into the summer months.

What Does Seasonality for the Crude Complex Look Like Relative to the S&P 500?

Summer doldrums in the broader stock market may exhibit seasonal consistency, but are not predictable. The same can be said for increasing energy demand. Still, let’s take a look at the crude complex over the last 10 years using StockCharts’ Seasonality charts.

Note: We’re comparing seasonal performance against the S&P 500 because it’s the benchmark against which you may adjust your portfolio.

WTI Crude Oil (USO as proxy)

CHART 1. 10-YEAR SEASONALITY CHART OF USO AGAINST THE S&P 500. Be sure to look at the higher-close rate (above the bars) and the average return (bottom of the bars).

Over the last 10 years, and relative to the broader market, July is USO’s second-to-worst-performing month in terms of average return (-5.5%) and worst month in terms of higher closes (only 22%). In August, its negative performance eased up a bit, leading to its best seasonal performance in September, with a higher-close rate of 56% and an average return of 3.5% against the S&P. So is August a favorable month to add positions if you’re looking to go long on crude oil?

Brent Crude Oil (BNO as proxy)

Brent crude (BNO) has a similar profile, but its September performance has a stronger higher-close rate (78%) than USO (which tracks WTI crude) and with a slightly higher average return of 3.9%.

CHART 2. 10-YEAR SEASONALITY CHART OF BRENT CRUDE OIL AGAINST THE S&P 500. Note that September is the BNO’s strongest month relative to the S&P.

RBOB Gasoline (UGA as proxy)

While most investors don’t deal much in gasoline futures, it’s a commodity that our wallets know quite well (with either pain or relief at the pump). As the seasonality chart below shows, gasoline prices tend to rise in the spring (see April) and summer (see September) due to shifts in gasoline blends (among other, less consistent factors such as refinery maintenance, crude oil prices, refining costs, etc.).

CHART 3. 10-YEAR SEASONALITY CHART OF RBOB GASOLINE AGAINST THE S&P 500. Take a look at April, September, and December. You’ll see how these look on the daily chart later in the article.

Relative to the broader market, UGA (United States Gasoline Fund) exhibits similarities to WTI and Brent. Its negative performance in July and August led to stronger performance in September, with a higher-close rate of 78% and an average return of 3.4%. Note, however, that its April and December performances are the strongest.

Natural Gas (UNG as proxy)

Natural gas has been the weakest-performing asset among the group, being the only one to exhibit negative year-over-year returns. However, it’s noteworthy that UNG holds exceptional seasonal performance (against the S&P) in August, setting it apart from the other three assets.

CHART 4. 10-YEAR SEASONALITY CHART OF NATURAL GAS AGAINST THE S&P 500. Natural gas spikes in August. Will this rally materialize this summer?

Over the last 10 years, UNG has had a higher-close rate of 89% and an average return relative to the S&P of 7.8%. What accounts for this? Increased demand for electricity, hurricane season, and lower storage levels during the summer are among the factors that tend to make natural gas jump in August.

Levels to Watch for USO, BNO, UGA, and UNG

USO

CHART 5. DAILY CHART OF USO. Price is rallying, but buying pressure is sinking.

USO is attempting to rally, but, despite the sharp price rise, momentum has given way to selling pressure, based on the Chaikin Money Flow reading. The bulls’ objective is to get USO past $81—a swing point coinciding with a cluster of 2022 resistance levels not shown in the chart above—to just above $83, marking the 2023 and 2024 highs. The bears aim to pressure prices back between $74 and $73, a formidable support level with tremendous volume concentration (based on the Volume by Price indicator reading), possibly down to $70, which marks the current swing low.

Overall, USO looks bearish in the near term, but, if it does fall between $70 and $73, that range might be a favorable entry point for those looking to take advantage of a potential seasonal surge in September.

BNO

CHART 6. DAILY CHART OF BNO. Note the divergence in momentum, which is similar to USO.

As Brent crude is correlated with WTI, BNO’s CMF reading is not that different from USO’s; both show dwindling momentum. However, the thick black dotted line highlights a long-term uptrend that can be traced back to 2022 (not shown in the chart above). While the bears’ objective is to see BNO’s price fall below support levels just under $30 and $29, the uptrend line, which would rise to around $28.50, would likely serve as a strong support level, particularly for those aiming to wager on a September seasonal price increase.

UGA

CHART 7. DAILY CHART OF UGA. Note the April, September, and December price spikes.

Assume that everyone is a bear when it comes to RBOB gasoline, as not even a bull would want to pay higher prices at the pump. Still, April, September, and December are UGA’s strongest seasonal months, and the green rectangles highlight these price spikes.

Momentum-wise, the CMF is deep into negative territory, indicating severe near-term weakness (a relief at the pump?). But September is just around the corner. If you’re looking to take advantage of this seasonal play, you can expect support at around $62 (see trendline), but keep an eye out for resistance at $68.5 and the $73–$74 range. The all-time high, reached in 2022, is at $80.

UNG

CHART 8. DAILY CHART OF UNG. Double top?

Natural gas, UNG, shows a clear break above the downtrend line, but is it double-topping (see blue arrows)? Supporting the likelihood of a near-term top is the decrease in buying momentum, as shown in the downsloping CMF.

UNG’s August seasonal surge hasn’t been as pronounced as it has been through most of the decade due to increased production, warmer weather, and high inventory levels. But if you want to position your portfolio for a potential rally in the next few months, the swing low at $17 (or the 2024 low at $14) might make for favorable entry points.

The Takeaway

As we move into the summer, energy demand usually increases, particularly for crude oil and gas. While seasonal plays can be attractive, they aren’t always reliable. And that’s why it’s best to look at the price action to seek potential tactical entry points when taking advantage of seasonal opportunities. Also, it’s important to consider the wider geopolitical and macroeconomic contexts, as those factors can significantly alter the supply and demand picture for these commodities.

Disclaimer: This blog is for educational purposes only and should not be construed as financial advice. The ideas and strategies should never be used without first assessing your own personal and financial situation, or without consulting a financial professional.

In this edition of StockCharts TV‘s The Final Bar, Dave breaks down an upside follow-through day for the S&P 500 and Nasdaq, and highlights the continued weakness in market breadth indicators. Dave identifies key levels to watch for GLD, FSLR, ENPH, TSLA, AVGO, and BIO. Focusing in on TSLA, Dave points out what we’d need to see to declare a clear bullish trend.

See Dave’s chart of cumulative advance-decline lines here.

This video originally premiered on June 17, 2024. Watch on our dedicated Final Bar page on StockCharts TV!

New episodes of The Final Bar premiere every weekday afternoon. You can view all previously recorded episodes at this link.

In early 2024, gold reached the price objective derived from the breakout of the large triangle that had evolved beginning in early 2022. Upon reaching the area of the objective, a classic buying climax halted the trend.

The subsequent trading range has been characterized by distribution. In the event of a breakout lower, the amount of distribution (cause) derived from the Point and Figure (P&F) count suggests a downside objective of 10–12% lower is reasonable. But will it reach this price objective?

In this article, we’ll make a technical assessment of the daily and weekly charts, provide evidence suggesting that the range is likely distribution (Wyckoff), and show how to assess potential price objectives using point and figure charts.

Weekly Chart of Gold

CHART 1. WEEKLY CHART OF CONTINUOUS GOLD CONTRACTS.

In November 2023, gold broke above lateral resistance developed along the $2079–$2085-per-ounce area.

The lateral resistance and rising support generated by the trendline (A) defined a large triangle.In anticipation of a breakout, it seemed appropriate to determine upside price objectives.I prefer to use multiple techniques to generate objectives. I particularly like Fibonacci extensions and retracements, point & figure chart projections, and price channels.I look for confluences of multiple techniques and combine them with traditional chart support and resistance to generate objectives.

Objectives are useful in three ways:

To ensure that reward exceeds risk to the stop by at least 3 to 1.To monitor for trend-ending action around those objectives.To adjust existing trades as those objectives are reached.

Importantly, the original breakout from the 2079–2085 triangle generated a price objective of 2540. That objective is derived thusly:

2079 (initial point of the triangle ) – 1618 (bottom of the pattern) = 461 points. 461 points added to the triangle top (2079 + 461) = 2540 objective.

I believe triangle price objectives are areas to monitor for resistance rather than discrete points.

Additional objectives can be derived using Fibonacci Objectives derived from the 1618 – 2085 – 1824 price sequence. 

1.382% = 2461 & 1.618% = 2570.Soon after the breakout from the triangle, a confluence of objectives could be calculated: 2461, 2540, and 2570.Potential objectives can also be derived by channelizing the price behaviors.I prefer overbought and oversold as defined by price channels than by momentum (i.e. stochastics, RSI or MACD).

In March, the market broke out of the triangle and, over the next several weeks, marked up to 2454.

The combination of overbought in the channels and the 1.382% Fibonacci objective (a bit short of the 1.618% objective), and in the area of the triangle objective, clearly defined an area of the chart where supply was likely to develop.As the price approached the objective confluence, it had already exceeded the two main channel tops at A1 (derived from trend line A) and B1 (derived from trend line B), and overbought conditions had developed in momentum measures, like RSI and stochastics.When I see resistance confluences of this nature, I begin to monitor for trend-ending action (for instance, a buying climax and secondary test pattern).Despite very bullish news and strongly bullish sentiment, a classic buying climax (BC) developed. Note the much higher than normal volume that occurred on a wide range bar that set a significant new high, but closed near the bar’s low.Buying climaxes typically resolve into trading ranges. Trading ranges can be distribution (marking a long term top) or re-accumulation (a pause before continuing higher).Over the next three weeks, the market pulled back to 2285, then rallied in a secondary test (ST). The secondary test was completed by a wide price spread bar that closed near its low. This is the juncture at which I became particularly interested in the pattern of price and volume and the potential downside objectives. The price-volume relationships should point toward either distribution or re-accumulation.

Generally speaking, there are only two outcomes to the range: either the buying climax is short-term, and the market will move higher after a period of re-accumulation, or the buying climax will offer a significant top, leading to a significant markdown once supply is completely distributed to weak hands.

This is when I shift attention to the daily perspective chart to closely monitor price spread and volume relationships.

Daily Chart of Gold

CHART 2. DAILY CHART OF CONTINUOUS GOLD CONTRACT.

Without going into a detailed Wyckoff price/volume analysis, I will make the case that it is likely that the range is one of distribution. Note the appearance of supply (inside the oval) just before the buying climax at 2449, the lower volume and angle of attack on the rally to 2454 (secondary test), and the expansion of volume and close near the low of the price spread (last arrow). Rallies inside the range are being aggressively sold as strong hands distribute to weak hands. Additionally, much of the price action has developed below the midpoint of the range.

With the assessment of distribution, I thus need to begin planning for a bearish breakout. The first part of the plan is to arrive at some estimation of how much downside potential exists.

One of Wyckoff’s main principles is “The Law of Cause and Effect.” Cause refers to the amount of accumulation or distribution that occurs inside a range. Effect is the extent of the move out of that range.The accumulation or distribution inside a range determines how far the breakout of the range will move. In other words, the time spent in the consolidation is related directly to the distance of the subsequent move. Point and figure (P&F) charts are used to determine the extent of the cause and generate initial price objectives out of the range.

Gold P&F One-point Boxes X 3 Box Reversal

CHART 3. POINT & FIGURE CHART OF GOLD CONTINUOUS CONTRACT.

Trading ranges represent areas of the chart where large numbers of shares change hands, often moving from strong hands to weak hands. This is why a consistent relationship exists between the length of a trading range and the size of the subsequent move. This is particularly true in very liquid, heavily-traded markets.

There is no end to the debate regarding which points should be used to define counts. I like to keep it simple. I look for the walls of the range, count across the two walls, and then project from the low. Others would use the smaller count derived from the two walls between the buying climax and the secondary test. After all, I mostly use the objectives to help define risk vs. reward and to help draw my attention to the chart as the area of the objectives is reached.

Assuming the current range does not extend and I am correct in my assessment of distribution, the count projects enough cause to suggest downside of 2010–2030. If the range extends, the count will lengthen, and the price objective grows greater. With this view, I should be able to fashion a trade well in excess of 3-1 (minimum) risk reward. I suspect that when a trade sets up, that risk-reward will be in excess of 10-1, as a stop versus my entry is likely to be less than 1%. If I am wrong and the range is one of re-accumulation, the same method can be applied to a breakout higher.

Please note that this is not a trading recommendation. Entry will be determined by price action and trade implementation techniques that I hope to present in future pieces.

Shared content and posted charts are intended to be used for informational and educational purposes only. The CMT Association does not offer, and this information shall not be understood or construed as, financial advice or investment recommendations. The information provided is not a substitute for advice from an investment professional. The CMT Association does not accept liability for any financial loss or damage our audience may incur.

Carl and Erin return to the trading room showing you the charts you need to see to start your week!

Carl covered the market trends and condition to start the program. He also covers Bitcoin, Dollar, Gold, Silver, Gold Miners, Bonds, Yields and Crude Oil.

Carl also gave us a read on the Magnificent Seven in both the short and intermediate terms as he covered weekly charts today as well as daily charts.

Carl and Erin discuss the new bearish double top that is making itself known on Natural Gas (UNG).

Erin gives us a read on Sector Rotation noting today’s strong rally in Consumer Staples (XLP). She looked at Real Estate (XLRE) which could find favor in a lower interest rate environment and she looks at the tepid participation in the Technology (XLK) sector.

They finish the program with symbol requests where they review not only daily charts, but weekly charts too!

01:15 DecisionPoint Signal Tables

04:28 Market Overview

14:23 Magnificent Seven

21:53 Natural Gas (UNG)

25:30 Sector Rotation

42:13 Symbol Requests

Watch the latest episode of the DecisionPointTrading Room on DP’s YouTube channel here!

Try us out for two weeks with a trial subscription!

Use coupon code: DPTRIAL2 at checkout!

Technical Analysis is a windsock, not a crystal ball. –Carl Swenlin

(c) Copyright 2024 DecisionPoint.com

Disclaimer: This blog is for educational purposes only and should not be construed as financial advice. The ideas and strategies should never be used without first assessing your own personal and financial situation, or without consulting a financial professional. Any opinions expressed herein are solely those of the author, and do not in any way represent the views or opinions of any other person or entity.

DecisionPoint is not a registered investment advisor. Investment and trading decisions are solely your responsibility. DecisionPoint newsletters, blogs or website materials should NOT be interpreted as a recommendation or solicitation to buy or sell any security or to take any specific action.

Helpful DecisionPoint Links:

Trend Models

Price Momentum Oscillator (PMO)

On Balance Volume

Swenlin Trading Oscillators (STO-B and STO-V)

ITBM and ITVM

SCTR Ranking

Bear Market Rules

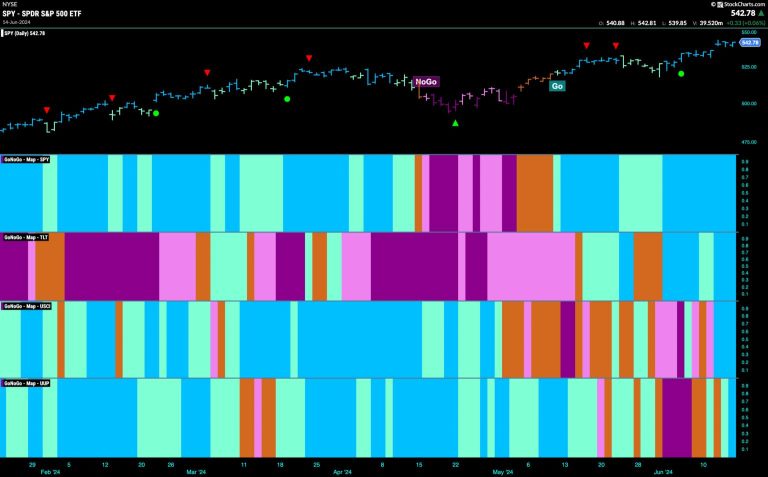
Good morning and welcome to this week’s Flight Path. Equities remained very strong this week as we saw a continued string of bright blue bars and a new price high. Treasury bond prices saw a surge in strength in the second half of the week as we see a return to bright blue bars. Commodities try to convince us that this time they’ve made up their mind and entered a “Go” trend on strong blue bars. Finally the dollar, after some uncertainty this week, closed with a strong blue “Go” bar as well.

$SPY Paints Strong Blue “Go” Bars at All Time Highs ( No Change this week!)

Not only did we see the “Go” trend continue this week but we saw price gap higher mid week and nothing but strength with GoNoGo Trend painting strong blue bars. When we turn our eye to the oscillator panel, we see that momentum is coming off an extreme of overbought. At a value of 5 but falling, we may well see a Go Countertrend Correction Icon (red arrow) appear above price informing us that it may struggle to go higher in the short term. We will pay attention to this and look to see if support is found at the gap.

The larger weekly chart shows that the “Go” trend remained very strong this week as we see a strong blue bar setting another higher weekly close.  GoNoGo Oscillator has climbed to its max of 6. We will watch closely to see if this market enthusiasm can be maintained or if there is any waning of momentum which would cause a Go Countertrend Correction icon to appear on the chart above price.

Treasury Rates Set new Lower Low in “NoGo” Trend

After a brief relief rally that set a new lower high, we saw price fall through the second half of the week. GoNoGo Trend returned to paint more strong purple “NoGo” bars and price made a new lower low. We were alerted to this trend continuation mid week as GoNoGo Oscillator rose to test the zero line from below and was turned away. Now, with the “NoGo” firmly in place, we see that momentum is resurgent in the direction of the underlying trend. The oscillator is at a value of -3, not yet oversold.

Dollar Makes a Move after Uncertainty

After a few “Go Fish” bars, amber bars that reflect market uncertainty, we saw the dollar paint a couple of aqua bars this week before a strong blue “Go” bar was painted on Friday. Thursday’s “Go” bar was impressive, with its trading range completely engulfing that of the day before. This is known as a bullish engulfing pattern, and suggests higher price moves over the near term. Friday’s gap higher is above prior high levels and it will be important to note if we can consolidate at these levels. GoNoGo Oscillator is in positive territory on heavy volume after bouncing off the zero line.

The weekly chart shows a return to strength this week. GoNoGo Trend painted a strong blue “Go” bar as price challenges prior highs. GoNoGo Oscillator bounced off the zero line last week giving us signs of Go Trend Continuation (green circle). Now, momentum is positive and moving higher at a value of 3.

The share of workers who say they get summer Fridays has dropped dramatically in recent years.

Just 11% of North American workers say they have access to summer Fridays, according to a November 2023 survey from Gartner of more than 1,100 people. In 2019, however, 55% of organizations offered the benefit, and until that point its popularity had been growing for years.

It’s possible companies are doing away with summer Fridays, the policy that allows workers to take a few hours or the entire day off during summer months, now that work-from-home Fridays are becoming more common in hybrid workplaces, says Caitlin Duffy, senior director in the Gartner HR practice.

But organizations should be cautious of seeing the different types of flexibility as having the same benefits, she says, especially during what she calls a “well-being crisis” when employee burnout and disengagement are high.

“Organizations may see them as interchangeable, but there’s something different about being completely off and disconnected than there is working remotely,” Duffy tells CNBC Make It.

Some companies have made headlines for scaling back on workplace flexibility that emerged during the pandemic. For example, Goldman Sachs came under fire last year when it mandated staff return to the office five days a week, effectively prohibiting the practice of staffers working remotely on Fridays and getting an early start on the weekend. JP Morgan Chase, Boeing and UPS have also increased RTO requirements for some parts of their workforce, though businesses mandating full-time office attendance make up a small share of the Fortune 500 companies.

Duffy says organizations should consider how reducing workplace flexibility will impact their employees before imitating what their competitors are doing.

“Leaders are looking to their peers to get a sense of what others are doing, especially if they’re competing for the same talent,” Duffy says. “But we have heard HR leaders still say they’re concerned about the impact of return-to-office on their ability to attract and retain talent.”

Kyle Lacy, 40, is part of a group bucking the summer Friday slide. Lacy is the chief marketing officer at Jellyfish, an engineering management platform, which introduced summer Fridays to his department for the first time this year.

The policy is pretty open-ended for the roughly 20 people who are eligible, Lacy says — starting at 2 p.m. every Friday from June to August, employees are free to use their time for themselves. That might mean finishing a project for the company or learning a new skill for their job, but it could also mean jumpstarting their weekend, enjoying hobbies, traveling or spending time with friends and family.

“When a team is doing good work and meeting goals, then a couple hours [off] on a Friday isn’t going to affect that,” says Lacy, who notes that he’s previously worked at companies with summer Fridays.

“I’ve seen it [work] — I believe when you give people time to do things they enjoy, they’ll enjoy their work as well,” he adds.

Though Jellyfish, which has 200 employees, has an unlimited PTO policy, Stacy says explicit summer Fridays off, even for a few hours, can improve psychological safety and better support workers who have a hard time taking breaks.

“When you have high performers on your team, what I’ve found is they’re less likely to make time for life if they’re not told to. Anybody can say, ‘Oh, they’re hybrid, they’re going to [take off] anyway.’ But the reality is they won’t.”

Summer Fridays may be exclusive, but they’re in high demand: 41% of workers would most want a four-day workweek or full summer Fridays off, according to a June 2023 Monster survey of 523 people.

Among workers who receive summer benefits (like reduced hours or flexible schedules) 27% said they’d consider leaving their company if reduced workweeks were taken away.

And a majority of workers who get summer benefits say the perks don’t negatively impact their productivity, while 66% say these benefits help boost their productivity.

Meanwhile, support for a year-round four-day workweek has grown across businesses and lawmakers in recent years. Dozens of companies around the world have adopted permanent shortened workweeks after highly publicized trial runs that improved worker productivity, happiness and business outcomes. In Congress, Sen. Bernie Sanders, I-Vt., recently introduced legislation that would reduce the standard workweek to 32 hours without a pay cut.

On the employer side, Duffy isn’t concerned a decline in summer Friday offerings could diminish momentum around a four-day workweek. Roughly 10% of U.S. workers say they have a year-round four-day workweek, and that share has trended upwards over time, according to Gartner data.

Overall, a majority, 87%, of U.S. workers say they’d be interested in a four-day workweek, and 82% believe widespread adoption in the U.S. would be successful, according according to a 2023 survey of 1,047 people from Morning Consult.

This post appeared first on NBC NEWS

Stellantis is correcting what CEO Carlos Tavares described Thursday as “arrogant” mistakes by himself and the company in the automaker’s U.S. operations that led to sales declines, bloated inventories and investor concerns.

Tavares said the convergence of three factors led to the problems: not selling down vehicle inventory fast enough; manufacturing issues, specifically with two unnamed plants; and lack of “sophistication in the way to go to market.”

“We had a convergence of three things that should have triggered, from me and nobody else, an immediate task force to address those things,” he told media Thursday after the company’s investor day at its North American headquarters. “When I’m saying that you are arrogant, I’m talking about myself. I’m talking about the fact that I should have acted immediately recognizing that the convergence of those three problems was there.”

During the investor day, Tavares and his top lieutenants broadly updated investors on the company’s operations and how Stellantis plans to achieve ambitious financial targets amid industry and economic uncertainty. The company also reconfirmed its 2024 guidance and vowed to continue to return capital to shareholders going forward.

Tavares did not elaborate on the manufacturing or go-to-market problems, but Stellantis’ inventory of vehicles leads major U.S. automakers as the company has held back incentives and cut marketing budgets. Stellantis’ U.S. sales were off 10% during the first quarter, leading to notable declines in revenue.

In May, Cox Automotive reported days’ supply of vehicles at Stellantis’ Jeep and Ram brands were more than twice the industry average of 76 days. Stellantis was the only major automaker to report a decline in U.S. sales last year; its market share dropped below 10%; and Hyundai, including Kia, outsold Stellantis for the first time ever.

While sales have been down, the company remains among the most profitable automakers globally. Since merging Fiat Chrysler and PSA Groupe to form Stellantis in 2021, the automaker’s adjusted operating income rose by 31% from 2021 through last year. Its adjusted profit margin is also up, rising 0.4 percentage point during that time frame, to 12.8%.

Stellantis reported a 12% decline in revenue in the first quarter, citing lower sales and foreign exchange effects, even as net pricing held firm. Its average vehicle transaction price in the U.S. was $57,266, according to Cox Automotive. That compares to an industry average of $48,389.

As part of the event, Tavares said Stellantis has achieved 8.4 billion euros ($9 billion) in cost reductions from the merger of Fiat Chrysler and PSA Groupe that created the company in January 2021.

That amount is more than double initial expectations from when the merger was announced in 2019, and an increase from the updated 5 billion euros in expected reductions within five years of completion of the merger, which formed one of the world’s largest automakers.

Tavares said the largest reduction was achieved in the sharing and consolidation of engineering assets for the company’s vehicles, followed by purchasing.

Cost-cutting has been a critical mission of the veteran automotive executive. Other cost-saving measures have included reshaping the company’s supply chain and operations, as well as head-count reductions.

Since the merger was agreed to in December 2019, Stellantis has reduced head count by 15.5%, or roughly 47,500 employees, through 2023, according to public filings. Additional job cuts this year involving thousands of plant workers in the U.S. and Italy have drawn the ire of unions in both countries.

Several Stellantis executives described the cuts to CNBC as difficult but effective. Others, who spoke on the condition of anonymity due to potential repercussions, have described them as grueling to the point of excessiveness.

The cuts are part of Stellantis’ strategic plan to increase profits and double revenue to 300 billion euros by 2030. The plan also includes targets such as achieving adjusted operating profit of more than 12% and industrial free cash flow of more than 20 billion euros.

“We are not looking for our way; we know where we are going,” Tavares said, referring to the automaker’s 2030 “Dare Forward” strategic plan.

Stellantis reconfirmed its 2024 guidance that included a double-digit adjusted operating income (AOI) margin, positive industrial free cash flow and at least 7.7 billion euros in capital return to investors in the forms of dividends and buybacks.

The automaker anticipates that Jeep will be a main driver for the company globally. Stellantis expects to grow sales of Jeep vehicles globally by 50% in the next three years, as the automaker attempts to leverage the quintessential American SUV brand for increased profits.

The trans-Atlantic automaker on Thursday said it will expand production and sales to roughly 1.5 million units by 2027. To do so, the company will grow its vehicle and powertrain offerings.

“The Jeep brand can be a local hero anywhere,” Tavares said. “We are going to reinforce the manufacturing footprint of Jeep.”

This post appeared first on NBC NEWS

What makes a happy camper this summer? S’mores, sing-alongs and — lately — streaming.

The pandemic nudged millions of people toward outdoorsy trips and experiences, and many are now hooked. But they’re increasingly demanding a decent Wi-Fi connection wherever they pitch their tents or park their RVs, and campsites are providing it.

Wi-Fi at campgrounds has become “the fourth utility behind water, sewer and electric,” said Tim Rout, founder and chief solutions officer at AccessParks, a San Diego-based broadband provider for RV parks and campgrounds.

“Six or seven years ago it was a ‘nice to have’ service so people could load their email or check their bank account,” said Rout. “Now people expect the same quality of service in RV parks that they get at home.”

About 40% of campers say Wi-Fi availability influences where they decide to camp, said David Basler, chief strategy officer for the Outdoor Hospitality Industry trade group. “Generationally, this increases to 65% in Gen Z and millennials and 45% in Gen X campers,” he said.

Now people expect the same quality of service in RV parks that they get at home.

AccessParks Founder Tim Rout

Searches for Wi-Fi-equipped U.S. properties on the campsite booking platform Hipcamp are up 110% year over year, according to founder and CEO Alyssa Ravasio, who said the number of such sites grew by 30% over the past year. Most Hipcamp hosts that provide Wi-Fi don’t charge guests extra for it, Ravasio added.

Wi-Fi is now offered at 82% of U.S. campsites, OHI estimates, slightly ahead of laundry and even shower facilities. It was the most commonly provided amenity last year among privately operated camping properties surveyed recently by The Dyrt. The camping information app found Wi-Fi being added at a faster rate (nearly 16% of campsites added it from 2022 to 2023) than pickleball courts (12%), dog parks or kayaks and canoes (each at 10%).

“Good, solid Wi-Fi at the campsite is the No. 1 priority,” said Catherine Stifter, 67, citing her wife’s love of movies and streaming services.

But Stifter needs a good connection, too. The couple lives and travels in their van full time, and when Stifter, a fitness instructor, leads her twice-weekly online qigong practice group, reliable service is a must-have.

Catherine Stifter and her wife live and work from their van, making campsite Wi-Fi a priority.Courtesy Catherine Stifter

When it isn’t available, she said, “I might end up using the signal up at the lodge.”

The Dyrt found 29% of campers worked while camping last year, up from less than 24% in 2022 and 2021, even as more employers mandated a return to in-person work. Some campers may have been “quiet vacationing” — working from a remote destination rather than taking off to fully unplug.

Rout said AccessParks’ business was already growing before the pandemic. “But since more people flocked to the outdoors and RV sales accelerated, there is a younger, more professional demographic in campgrounds — more families, more Zoom calls with work, distance learning, etc.,” he said. “Since then, our growth has dramatically increased due to the demand for fast broadband Wi-Fi.”

At least one Montana campground relies on Wi-Fi for a camera system that monitors the area for grizzly bears, Rout added.

Marley Behnke said Wi-Fi was already installed at the campground in Grayling, Michigan, that she bought in late 2022. In addition to letting guests stay connected and share details from their adventures with loved ones, “there are apps that provide real-time updates for activities, facilitate food delivery, organize scavenger hunts and enable interactive games,” she said.

The campground, which is part of the Jellystone Park network, currently pays about $700 a month for Wi-Fi. Behnke said she’s looking to add fiber service by this fall.

Wiring a campsite for high-speed broadband comes with challenges like ensuring the signal can make its way through uneven terrain, trees and metal RV bodies and withstand extreme weather. Depending on property size and the type of service offered, installation might run anywhere from $50,000 to $500,000, Rout said, though campgrounds can typically recoup the expense by raising prices by little more than $1 a night.

One factor that could be driving demand for Wi-Fi in the wilderness: the influx of newbie and higher-end campers who may prefer a less rustic experience.

I’ve got kids who have not grown up camping consistently, so I definitely need a posher camping experience.

Sommer Nyte, 46, Bellingham, Wash.

The share of first-time and less-experienced campers hit 32% this year, down from a peak of 41% in 2022 but far higher than pre-pandemic — when that rate didn’t surpass 18% from 2015 to 2019, according to the campground operator KOA.

While middle- and lower-income travelers are especially keen to camp this summer, Deloitte researchers say, camping demand is up 7% in a year when high-income travelers comprise a greater share of this season’s leisure travelers overall. The “glamping” (glamorous camping) sector is forecast to grow by more than 15% each year through 2029, according to Arizton market research.

“I’ve got kids who have not grown up camping consistently, so I definitely need a posher camping experience,” said Sommer Nyte, 46, a Bellingham, Washington, realtor who recently bought a new pop-up tent trailer. Wi-Fi is on her wish list alongside pools, boat rentals and programming for families with children.

Internet connectivity isn’t sweeping every campsite, though. It’s available at 65% of those listed on Airbnb, a spokesperson said, up only modestly from 61% in 2019. That’s despite sharper increases in bookings of camping vehicles (22% higher than last summer) and camping properties (up 10%).

However, Hipcamp’s Ravasio noted, “there’s an increasing number of campers — especially with RVs, adventure vehicles and overlanding rigs — that are equipped with their own devices to be self-sufficient for Wi-Fi, like Starlink or hotspots.”

And then there are those who still go camping to get away from it all.

“There used to be a curtain of isolation between campers and the outside world,” said John Stark, a 73-year-old retired broadcaster from Tucson who just returned from camping at Bandelier National Monument in New Mexico — which doesn’t offer public Wi-Fi. “Now campgrounds are extensions of our living rooms.”

“I blame cell towers,” he added.

One way analog campers like Stark can stay offline is to stick to publicly operated campgrounds. While the RV Industry Association found about 60% of private sites offered Wi-Fi as of 2022, only 3% of public ones did.

This post appeared first on NBC NEWS

The share of workers who say they get Summer Fridays has dropped dramatically in recent years.

Just 11% of North American workers say they have access to Summer Fridays, according to a November 2023 survey from Gartner of more than 1,100 people. In 2019, however, 55% of organizations offered the benefit, and until that point its popularity had been growing for years.

It’s possible companies are doing away with Summer Fridays, the policy that allows workers to take a few hours or the entire day off during summer months, now that work-from-home Fridays are becoming more common in hybrid workplaces, says Caitlin Duffy, senior director in the Gartner HR practice.

But organizations should be cautious of seeing the different types of flexibility as having the same benefits, she says, especially during what she calls a “well-being crisis” when employee burnout and disengagement are high.

“Organizations may see them as interchangeable, but there’s something different about being completely off and disconnected than there is working remotely,” Duffy tells CNBC Make It.

Some companies have made headlines for scaling back on workplace flexibility that emerged during the pandemic. For example, Goldman Sachs came under fire last year when it mandated staff return to the office five days a week, effectively prohibiting the practice of staffers working remotely on Fridays and getting an early start on the weekend. JP Morgan Chase, Boeing and UPS have also increased RTO requirements for some parts of their workforce, though businesses mandating full-time office attendance make up a small share of the Fortune 500 companies.

Duffy says organizations should consider how reducing workplace flexibility will impact their employees before imitating what their competitors are doing.

“Leaders are looking to their peers to get a sense of what others are doing, especially if they’re competing for the same talent,” Duffy says. “But we have heard HR leaders still say they’re concerned about the impact of return-to-office on their ability to attract and retain talent.”

Kyle Lacy, 40, is part of a group bucking the Summer Friday slide. Lacy is the chief marketing officer at Jellyfish, an engineering management platform, which introduced Summer Fridays to his department for the first time this year.

The policy is pretty open-ended for the roughly 20 people who are eligible, Lacy says — starting at 2 p.m. every Friday from June to August, employees are free to use their time for themselves. That might mean finishing a project for the company or learning a new skill for their job, but it could also mean jumpstarting their weekend, enjoying hobbies, traveling or spending time with friends and family.

“When a team is doing good work and meeting goals, then a couple hours [off] on a Friday isn’t going to affect that,” says Lacy, who notes that he’s previously worked at companies with Summer Fridays.

“I’ve seen it [work] — I believe when you give people time to do things they enjoy, they’ll enjoy their work as well,” he adds.

Though Jellyfish, which has 200 employees, has an unlimited PTO policy, Stacy says explicit Summer Fridays off, even for a few hours, can improve psychological safety and better support workers who have a hard time taking breaks.

“When you have high performers on your team, what I’ve found is they’re less likely to make time for life if they’re not told to. Anybody can say, ‘Oh, they’re hybrid, they’re going to [take off] anyway.’ But the reality is they won’t.”

Summer Fridays may be exclusive, but they’re in high demand: 41% of workers would most want a four-day workweek or full Summer Fridays off, according to a June 2023 Monster survey of 523 people.

Among workers who receive summer benefits (like reduced hours or flexible schedules) 27% said they’d consider leaving their company if reduced workweeks were taken away.

And a majority of workers who get summer benefits say the perks don’t negatively impact their productivity, while 66% say these benefits help boost their productivity.

Meanwhile, support for a year-round four-day workweek has grown across businesses and lawmakers in recent years. Dozens of companies around the world have adopted permanent shortened workweeks after highly publicized trial runs that improved worker productivity, happiness and business outcomes. In Congress, Sen. Bernie Sanders, I-Vt., recently introduced legislation that would reduce the standard workweek to 32 hours without a pay cut.

On the employer side, Duffy isn’t concerned a decline in Summer Friday offerings could diminish momentum around a four-day workweek. Roughly 10% of U.S. workers say they have a year-round four-day workweek, and that share has trended upwards over time, according to Gartner data.

Overall, a majority, 87%, of U.S. workers say they’d be interested in a four-day workweek, and 82% believe widespread adoption in the U.S. would be successful, according according to a 2023 survey of 1,047 people from Morning Consult.

This post appeared first on NBC NEWS