Archive

2024

Browsing

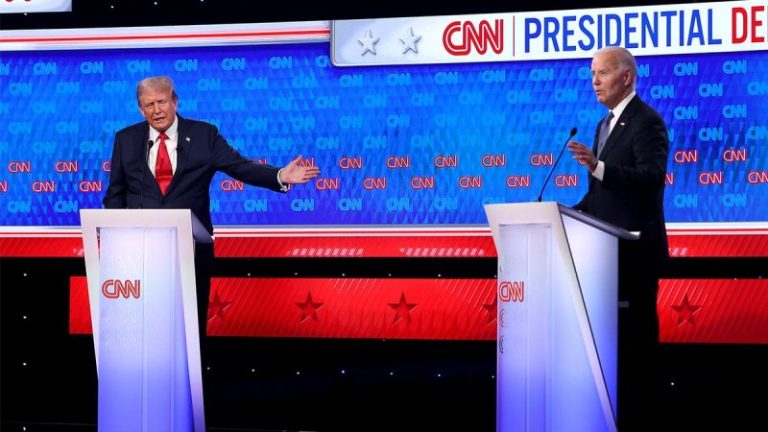
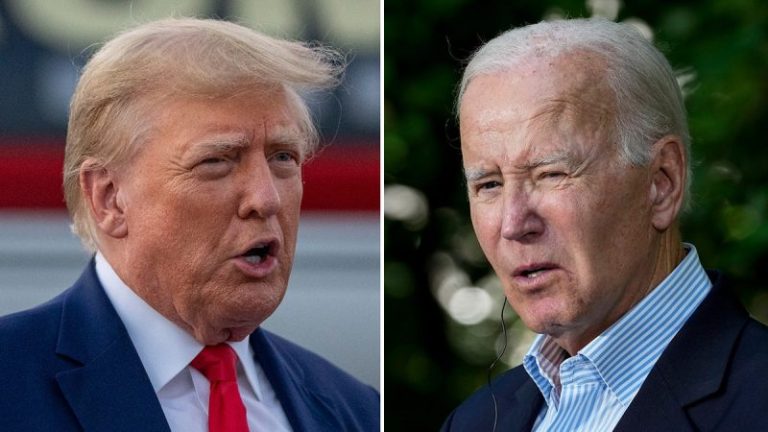
Not a single voter who participated in a Fox News Digital focus group said they felt better about President Biden after watching his performance at the CNN Presidential Debate on Thursday.

Democrats, independents and Republicans who gave their real-time reaction to the debate said that former President Trump appeared stronger than Biden when it came to effective communication and the ability to appear like a leader.

‘He got off to a horrible start,’ a male voter told focus group leader Lee Carter, president of Maslansky and Partners. ‘At the beginning he couldn’t even put a sentence together at the opening statement.’ 

One woman expressed disappointment in the debate, noting that Biden and Trump spent more time attacking each other’s records than discussing the problems facing the country.

‘I think they’re just battling each other, like, head on and not addressing the real problems. Like, they’re just trying to be on top of each other. It just felt like, I don’t know, a fist fight to me,’ she said. 

A man who said he was ‘okay’ with Biden’s performance suggested the president would have been helped if his microphone was closer to his mouth. Biden’s voice appeared raspy during the debate and at times he did not project at the level of his opponent, Trump.

But another woman interjected, saying that Biden, as an executive, should be able to project and communicate his points.  

‘Given that he was one of the earliest, as you mentioned, senators and has been in politics for decades, I don’t think that is an excuse,’ she said. 

Another male voter compared the physical presence of the two candidates and said Trump had an edge over the 81-year-old Biden. 

‘Okay, you just take Trump versus Biden on the physical and the ability to communicate: Trump is 78 years old also, but he is communicating as if he was 55 years old, and he’s getting his points across, and he’s acting like a leader,’ a male voter said.

At the onset of the discussion, about half of the focus group indicated they had concerns about Trump going into the debate. Voters said they were worried he would not act presidential, or that he would be too ‘aggressive’ in going after Biden. 

More than half of the focus group later said Trump exceeded their expectations. Several said the debate format, in which a candidate’s microphone was muted when it wasn’t their turn to speak, ultimately helped Trump maintain composure and control.

‘I think they meant to help Biden but they ended up helping Trump,’ one voter said. 

‘Because they shut him up.’ 

This post appeared first on FOX NEWS

Former President Trump blasted President Biden in CNN’s presidential debate on Thursday for not firing any of the generals who oversaw the chaotic withdrawal from Afghanistan that left 13 U.S. soldiers dead. 

‘He was so bad with Afghanistan,’ Trump said during the CNN presidential debate on Thursday night. ‘It was such a horrible embarrassment. Most embarrassing moment in the history of our country that when Putin watched that and he saw the incompetence.’

‘He should have fired those generals like I fired the one that you mentioned and so he’s got no love lost but he should have fired those generals,’ Trump continued. ‘No general got fired for the most embarrassing moment in the history of our country, Afghanistan, where we left billions of dollars of equipment behind. We lost 13 beautiful soldiers and 38 soldiers were obliterated.’

Trump went on to say that the world is ‘blowing up’ under President Biden.

‘You ever heard so much malarkey in my whole life?’ Biden responded.

Biden went on to defend his pullout of Afghanistan and blasted Trump for his positions on the war in Ukraine and comments made about Russian President Vladimir Putin.

‘This guy hasn’t fired anybody,’ Trump said at another point in the debate.

‘He should have fired every military man that was involved with the Afghan horror show,’ Trump said. ‘The most embarrassing moment in the history of our country. He didn’t fire. Did you fire anybody? Did you fire anybody that’s on the border? That’s allowed us to have the worst border in the history of the world. Did anybody get fired for allowing 18 million people, many from prisons, many from mental institutions?’

Fox News Digital reached out to the Biden campaign for comment but did not receive a response.

This post appeared first on FOX NEWS

“It takes 10 years to learn from the vineyard, and another 10 years to learn the wine from that vineyard.” — James Molesworth

Metaphors and analogies are powerful teachers and offer behavioral adhesiveness. In other words, the ideas and lessons they present stick in our memory, and can thus more easily become part of our routines. Sports metaphors are everywhere, but I believe this analogy of investors and winemakers is also extremely powerful.

James Moleworth’s perspective introductory quote is based on his career over three decades in the wine industry. Similarly, my own decades as a full-time investor yield a similar axiom. Not as frighteningly long term as his ten-and-ten perspective, but nevertheless, mine is perhaps closer to five-and-five.

If a winemaker can take two decades to hit a really consistent stride and produce top tier wines, investors who aspire to produce consistent out-performance and profits must also embrace a willingness to play the long game. Hence, keep in mind these three essential lessons:

Investors should accept that their initial learning and growing phase will take years. Achieving mastery is worth the effort, but you don’t get vaccinated with that ability in a one-day seminar. You must experience the seasons of the market and appreciate how you react to bullish, neutral, and bearish scenarios. During these years, you are blending disciplines, tinkering with your methodology, and beginning to demonstrate competence. Yes, you are mastering the vineyard. A vineyard of your investments.Next, you move into the winemaker phase. You are harvesting what you learned. Like fine wine, successful investors can only be replicated with age. Of course, you need appropriate grapes to provide your foundation. But with each passing season in the markets, your wine (aka your skill set) will age and mellow, and you’ll begin bottling out-performance and consistent profits. This is very akin to the passage of top-tier winemakers. If you aspire to consistent outperformance as an investor, you too must be willing to take a similar journey. I often paraphrase this quote: “I worked all those years to become an overnight success.”As both an investor and connoisseur of fine wines, I want to assure you that both passages are worth the effort — truly!The third and final lesson is really the umbrella beneath which all this resides. The axiom is simple. Play the long game. Your portfolio will be healthier. Life will indeed be better.“An investor who has all the answers doesn’t even understand the questions. Success is a process of continually seeking answers to new questions” — Sir John Templeton

Sir Templeton certainly played an exquisite long game. Now, here’s a bonus addendum that’s totally separate from the three essential lessons above. Writing this blog has put me in a wine frame of wine! I’ve always maintained that wine journalists such as James Molesworth should teach college literature classes, because they are some of the best wordsmiths out there. These are a few hypothetical examples of how talented writers might describe bottles of vino:

This wine is broad in feel but not lacking in cut.It’s lushness doesn’t sacrifice it’s racy edge.It’s bracing with hints of youthfulness buried there.Expressive waves harnessed in this elixir.A plump kiss inlaid seamlessly within the bottle.It’s overt personae glistens with purity yet lurking beneath is a polished sophisticated racy element.It forms a tensile matrix steep in feel yet laced with bravado.It’s taut and coiled with much energy in reserve.The vibrant bristling core that hasn’t unwound yet.It sings beguiling notes expressing a hedonistic overall manner.

Waiting for a perfect setup—technically or fundamentally—can sometimes be a perfect way to miss an opportunity. The disruptor is market sentiment, as it jumps the gun on an opportunity hoping to be validated well after pulling the trigger.

Case in point: NVIDIA (NVDA) in March 2023. The article NVDA Stock: Waiting For a Big Plunge? warned against buying into strength, as technical indicators signaled a potential pullback while also warning that the depth of a pullback is always unpredictable.

Instead of pulling back to $230 (or $23 after its recent 10-for-1 split), it pulled back to $250 ($25) before market sentiment, again the disruptor, snatched the opportunity that later would be validated by fundamentals.

Viewing a weekly chart, here’s what happened. Take a look at the blue arrow. That was the week of the “dip.”

CHART 1. WEEKLY CHART OF NVDA. See the blue arrow? That was the buy signal last time around.Chart source: StockCharts.com. For educational purposes.

You have to squint to see the blue arrow, which seemed like a significant decision point for bulls and bears at the time. But as investor sentiment wagered on the upside, AI demand clarified that a new “era” of artificial intelligence far outweighs a short-term market opportunity. And so you see what happened.

Is NVDA a Buy Now, or Is the AI Trade Over?

NVDA share prices have fallen hard following the euphoria driven largely by the stock split. Wall Street analysts see limited upside for Nvidia in the near term and have been known to revise their targets.

In the long term, NVDA’s outlook remains positive, due to the growing importance of AI and NVDA’s dominant position in the AI hardware market. So, while short-term gains may be modest, the chipmaker is expected to outperform the market in the long run.

But corrections can turn into downtrends. So, if you are bullish on NVDA, here are the levels to watch. Take a look at NVDA’s daily chart below.

CHART 2. DAILY CHART OF NVDA. NVDA shares are falling. But will the decline remain a dip, or might it cascade into a much stronger downtrend?Chart source: StockCharts.com. For educational purposes.

While the Chaikin Money Flow (CMF) indicates that buying pressure remains positive, it also shows bullish momentum in a steep decline. The Money Flow Index (MFI), a volume-weighted RSI, confirms this reading, showing prices declining from overbought levels alongside a bearish divergence between the indicator and NVDA.

The chart plots an Ichimoku Cloud (kumo) to map out a wider context to anticipate potential support. Here’s what to keep an eye on:

The cloud coincides with the 50% and 61.8% Fibonacci Retracement levels, which generally serve as favorable buying levels if you want to go long.The 50-day simple moving average (SMA), also commonly viewed as a potential support level, is also looking to converge with the 50% Fib level.The 50% and 61.8% Fib levels, along with the top and bottom end of the cloud, also match the two Runaway Gaps, which, if filled, tend to serve as support levels.

In short, the actionable buying range sits between $105-ish and $110. Of course, ultra-bullish market sentiment can disrupt this setup (as it did in March 2023) and send NVDA prices higher and sooner.

On the bearish side, if NVDA falls below $100, there’s a possibility the correction will become an intermediate-term downtrend. What can trigger this scenario? Unimpressive earnings in the next few quarters (its next earnings is in August).

The Takeaway

While NVDA’s long-term outlook remains bright thanks to its stronghold in the AI hardware market, expect near-term weakness. The key levels to watch for potential support are around $105 to $110, with ultra-bullish sentiment potentially pushing prices up sooner. However, if NVDA drops below $100, we could see a longer downtrend, especially if upcoming earnings disappoint. So, keep an eye on those levels and market sentiment to time your moves wisely.

Disclaimer: This blog is for educational purposes only and should not be construed as financial advice. The ideas and strategies should never be used without first assessing your own personal and financial situation, or without consulting a financial professional.

In this edition of StockCharts TV‘s The Final Bar, Dave shares charts for Palo Alto Networks, Arista Networks, Adobe Systems, and Fortinet, four tech stocks that are all pushing higher despite major indexes remaining sideways going into Friday’s economic releases. He also breaks down the chart of gold, shares a new way to use the MarketCarpet feature, and analyzes technical patterns for MU, CMG, JBL, and V.

See the new MarketCarpet in fantastic vanilla color scheme here!

This video originally premiered on June 27, 2024. Watch on our dedicated Final Bar page on StockCharts TV!

New episodes of The Final Bar premiere every weekday afternoon. You can view all previously recorded episodes at this link.

How well can the country’s biggest lenders hold out in an economic catastrophe? The Federal Reserve’s annual bank stress test reveals the answer.

On Wednesday (June 26, 2024), the results of the bank stress tests were released. All 31 participating banks, which included big banks, credit card companies, and regional banks, passed the test. That’s good news, especially for those who own big bank stocks; you could get a little bonus in the way of dividends. But there’s more to stress tests than dividend payouts. Let’s dive in.

What Are Bank Stress Tests?

The S&P 500 ($SPX) declined 56.8% during the 2007–2009 financial crisis (see chart below). If the S&P 500 were to decline that much again, consider what that would do to your portfolio.

CHART 1. BANK STRESS TESTS WERE IMPLEMENTED TO AVOID ANOTHER FINANCIAL CRISIS. During the 2007-2009 financial crisis, the S&P 500 declined 56.8%. A similar percentage drop would bring the S&P 500 to around 2400.Chart source: StockChart.com. For educational purposes.

To prevent such a scenario from occurring, the Federal Reserve (Fed) has been conducting stress tests on the country’s biggest lenders every year since 2011. The Fed sets up a hypothetical scenario of a major economic collapse and evaluates a bank’s balance sheet against this scenario. This determines if the bank has enough assets to endure an economic collapse.

No two years are alike. Each year brings a new set of challenges. To accommodate these changes, the stress tests are modified. When the tests began in 2011, many banks failed. Over time, however, more banks have shown their capability to withstand potential economic stresses.

The test was based on a pass/fail model in the early years. That’s no longer the case. Banks must stay above a minimum capital ratio of 4.5% to pass the test. In addition, each bank has a buffer added to that 4.5%, which varies from bank to bank depending on its hypothetical loss. In 2024, a 40% decline in commercial real estate prices, a 36% decline in home prices, and a 10% unemployment rate were factored into the test.

So, if all banks pass the stress test, does it mean everything is hunky-dory? Banks have challenged the accuracy of these tests. After the 2024 test results were revealed, JPMorgan Chase (JPM) stated that, based on its estimates, losses should have been higher than what the test determined. A couple of big banks made similar statements last year.

Another point to keep in mind is that even though all banks passed the test, their capital levels dropped by about 2.8 percentage points. One reason for this is the increase in credit card loans, which all investors should keep on their radar.

Why Should Investors Pay Attention to the Stress Tests?

If the largest lenders—JPM, Wells Fargo (WFC), Citigroup (C), Bank of America (BAC), Goldman Sachs (GS), and Morgan Stanley (MS)—pass the test, their shares could trend higher, and investors could receive dividend payouts. But that doesn’t always happen.

For one example, the Financial Select Sector SPDR ETF (XLF) didn’t move much the day after the test results. In the daily chart of XLF below, Fibonacci retracement levels have been applied to its most recent upward move.

CHART 2. FINANCIAL SELECT SECTOR SPDR ETF (XLF) DAILY CHART. If XLF bounces off its 50% Fibonacci retracement level and clears the 38.2% level, XLF could trend higher. It’s best to confirm the move with other indicators. For example, if XLF’s relative performance against the S&P 500 improves, it would be another checkmark to confirm an upward trend.Chart source: StockCharts.com. For educational purposes.

XLF is hovering around its 50% retracement level and is also underperforming the S&P 500. There’s not a lot there to convince anyone to go long XLF, but that could change. If XLF reversed at the 50% level, moved higher, and cleared the 38.2% level, that may be a good time to lock in some positions. If XLF’s relative performance against the S&P 500 improved, that would be further confirmation that XLF could move higher.

The Bottom Line

Nothing is guaranteed in the stock market, but bank stress tests indicate the bigger economic picture. It’s also comforting to know that big lenders will likely endure a financial shock of a large magnitude. And if you own bank shares in your portfolio, a dividend payout can be something to look forward to, although it may take a couple of months before it shows up.

Disclaimer: This blog is for educational purposes only and should not be construed as financial advice. The ideas and strategies should never be used without first assessing your own personal and financial situation, or without consulting a financial professional.

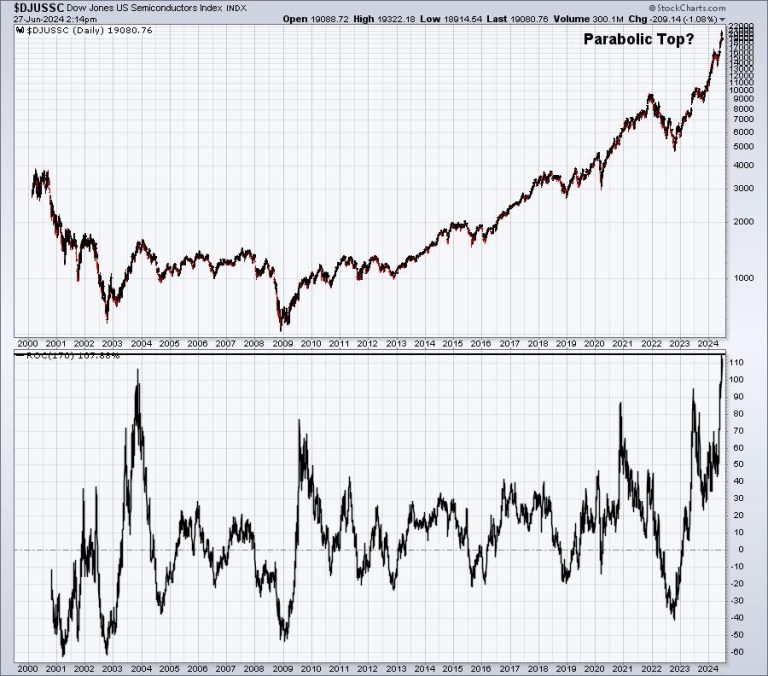
One hallmark of secular bull markets is rotation. When leading stocks, sectors, and industry groups falter, there needs to be others that grab the baton and help to keep the bull market intact. Semiconductors ($DJUSSC) have been the clear leader in the stock market for years, but especially since the end of October 2023, when the group embarked on its most powerful rally of the 21st century. Below is a 25-year chart of the DJUSSC. Pay particular note to the bottom panel, which reflects a 170-day rate of change (ROC), or roughly 8 months. Compare this most recent 8-month rally to other 8-month periods throughout this century:

The 8-month ROC recently hit 115%, which is the biggest rally EVER on this index. And if you look at the price chart, we should at least CONSIDER the possibility that this is a parabolic top. This is how these form – with tremendous amounts of positivity and what could end up being unsustainable revenue and EPS growth. The entire group is being priced off of record revenue and earnings growth and for perfection. Should traders even get a HINT that future growth might be lower than what we’ve been experiencing the past couple quarters, the semiconductor trade could be weak for months, possibly quarters.

In a secular bull market, however, it’s rotation that keeps our major indices in uptrends. Where might the new leadership emerge from if semiconductors do in fact weaken? Well, I think it’s already showing here:

XLC:

A breakout has already been made here. Yes, we’re a bit overbought, but nothing like how overbought technology (XLK) has been. One industry that typically revs up when the XLC is hot is internet ($DJUSNS). This group remains in the midst a major rally:

$DJUSNS:

The red-shaded area highlights the fact that, on relative basis, internet hasn’t been leading the past couple months. The breakout this week, though, might indicate renewed relative strength. It’s also noteworthy that since the financial-crisis low in 2009, internet stocks have been leaders during July, rising in 14 of the past 15 years:

The average July return has been 6.8%, more than double any other calendar month since 2009.

There’s one other key sector, consumer discretionary (XLY), that could play a big leadership role over the second half of 2024. This group has been a drag on U.S. equities, but it really hasn’t been felt that much, because the XLK has been so strong. NOW is the time, however, when U.S. equities could be looking for rotation to and leadership from this sector:

XLY:

Relative strength has begun to turn higher over the past two weeks and this relative strength could be fueled much further by an absolute breakout in the price of the XLY near the 184-185 level.

It’s been amazing what a stock like NVIDIA Corp (NVDA) has done for semiconductors, technology, and our major indices. But if NVDA struggles on a relative basis, which it certainly deserves, I see 3 critical stocks not named Apple (AAPL) and Microsoft (MSFT) that could swoop in and “save the day” for our major indices, especially the NASDAQ 100.

TAG, You’re It!

Ok, so if we’re going to need a replacement, temporary or otherwise, for a leadership stock like NVDA, which stock(s) might we look to for future leadership?

GOOGL:

Relative to its peers, GOOGL hit rock bottom in early March. Since then, GOOGL has been significantly outperforming its internet peers and is currently awaiting another one. From mid-May to mid-June, GOOGL didn’t go anywhere. Semiconductors were flying, but GOOGL took a back seat. Now that it’s latest breakout to all-time highs have occurred, it certainly appears as though GOOGL is well-prepared to take the baton for the next leg of this secular bull market.

AMZN:

I don’t know if there’s a better stock anywhere right now. AMZN is absolutely one of my favorites. Discretionary stocks have been lagging most of the year and AMZN is the top holding in the XLY. AMZN just broke out, after consolidating, on excellent volume and I expect the stock to be a leader during the 2nd half of 2024. AMZN’s best calendar month during this secular bull market (since 2013) has been July – check it out:

AMZN has climbed more often in November, but its actual average monthly performance in July (+7.3%) easily surpasses all other months. So we have technical conditions turning bullish just as we move into, arguably, AMZN’s best month.

TSLA:

Ok, I get it. TSLA’s been disappointing for sure. But there are improvements on the chart that suggest TSLA could be on the verge of a much bigger run. We do need to see one more key price level cleared to give me more confidence of a big rally:

I see rather significant improvement in momentum (PPO), volume trends, and relative strength. TSLA, relative to its auto peers, just hit nearly a 4-month high. This, combined with other technical improvements, tells me that we could just be getting started here. I do want to see gap resistance near 208 cleared, because after that, I don’t see any major resistance until 265 or so.

There’s one more thing to like. Over the past 6 years, June, July, and August have posted AMAZING average returns. This time of the year is when TSLA has really shown extreme absolute and relative strength. Check out this seasonality chart:

The average return during June, July, and August has been a STAGGERING and BLISTERING 43%!!! That’s the AVERAGE since 2019. So if TSLA is going to get the job done, history tells us that NOW is the time.

Remember, the sustainability of secular bull markets is not much different than the game we all played as kids. Hey AMZN, GOOGL, and TSLA! You’re IT!!!!

I published my first StockCharts YouTube video in quite awhile and it’s great to be back! I spent a lot of time discussing the beauty of secular bull markets and how rotation keeps them alive, providing areas to keep a close eye on for future leadership. Please be sure to check out the video HERE and also be sure to hit that “Like” button and “Subscribe” to the StockCharts YouTube channel! I’d really appreciate the support!

Happy trading!

Tom

It’s a key question on voters’ minds heading into Thursday night’s presidential debate: How far does my dollar go in 2024?

The short answer: further than they might think.

Since February 2020, the Consumer Price Index has climbed a cumulative 20.8%, according to Bureau of Labor Statistics data. Over that same period, average hourly earnings rose 22.3%.

The chart below shows the result: Inflation-adjusted hourly earnings (the yellow line) have increased 1.5% since December 2019, indicating a net gain for workers’ average spending power.

This post appeared first on NBC NEWS

Amazon plans to launch a new section on its site dedicated to low-priced fashion and lifestyle items that will allow Chinese sellers to ship directly to U.S. consumers, CNBC has learned.

The storefront, announced at an invite-only conference for Chinese sellers on Wednesday, would mark Amazon’s most aggressive attempt yet to fend off growing competition from e-commerce upstarts Temu and Shein, which both have ties to China, the world’s second-largest economy.

Temu and Shein have expanded their presence in the U.S. in recent years, luring an increasing share of American shoppers with their rock-bottom prices on clothing, electronics, home goods and other products.

Amazon’s storefront will feature a range of unbranded items, many priced under $20, according to a presentation to Amazon sellers viewed by CNBC. A mock-up of the storefront showed a gua sha facial massaging tool, arm weights and phone cases, among other items for sale.

Amazon will ship the products directly from China to the U.S., with the goal of delivering them to shoppers within nine to 11 days, the presentation shows. In the past, Amazon sellers in China have relied on the company’s fulfillment services, called Fulfillment by Amazon, to send goods to warehouses in the U.S. before they are dispatched to customers.

The company pitched the arrangement as cost savings for Amazon sellers in China, and said merchants would be able to test new items through small-batch production. Shein uses a similar model, referred to as on-demand manufacturing, producing a limited quantity of goods and manufacturing more as demand increases.

In a statement to CNBC, Amazon spokesperson Maria Boschetti said, “We are always exploring new ways to work with our selling partners to delight our customers with more selection, lower prices, and greater convenience.”

Boschetti declined to comment further on the company’s plans, which were first reported by The Information. It is unclear when Amazon intends to debut the storefront, but the presentation notes it will start accepting products this fall.

China-based merchants have made up a sizable contingent of Amazon’s marketplace for many years, but the company is making a renewed push to court sellers there as it faces growing competition. In December, Amazon announced a new “innovation center” in Shenzhen, a popular technology and manufacturing hub, and it also slashed the fees it charges merchants selling clothing priced below $20.

Amazon said in 2023 the number of items sold by Chinese sellers on its site grew more than 20% year over year, while the number of Chinese merchants with sales upward of $10 million increased 30%.

This post appeared first on NBC NEWS

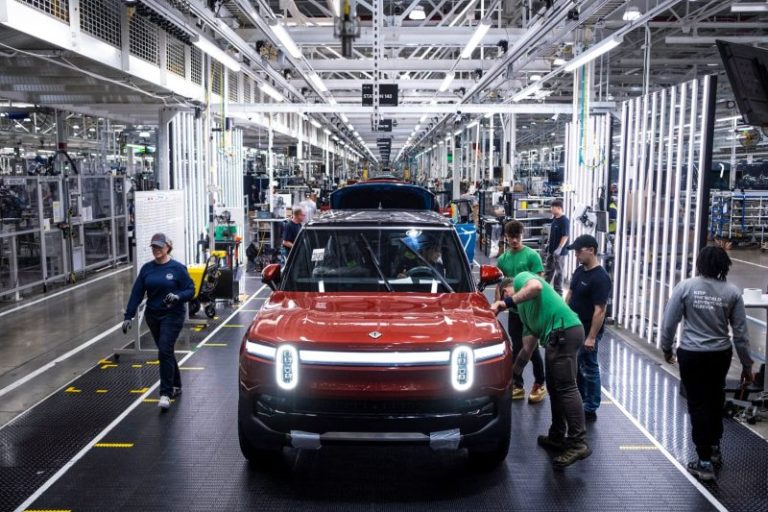
Volkswagen plans to invest up to $5 billion in electric vehicle startup Rivian, starting with an initial investment of $1 billion.

The additional $4 billion is expected by 2026. It includes plans for $1 billion each in 2025 and 2026, followed by $2 billion in 2026 related to an expected joint venture to create electrical architecture and software technology, according to a release by the automakers Tuesday.

Shares of Rivian soared roughly 40% during after-hours trading Tuesday, two days ahead of an investor event for Rivian, which has been under pressure from Wall Street due to its cash burn and significant losses. Rivian stock closed Tuesday at $11.96 a share, down roughly 49% in 2024.

The initial $1 billion from Volkswagen will be in the form of a convertible note, which could be converted to Rivian shares on or after Dec. 1, the release said.

Rivian will host an investor call to discuss the tie-up at 6 p.m. ET Tuesday.

Volkswagen is now the second legacy automaker to take a stake in the California-based company. Ford Motor was among Rivian’s largest stakeholders, at roughly 12%, alongside Amazon when Rivian went public in 2021. The Detroit automaker exited Rivian in 2023 after walking back a plan to codevelop EVs with the company.

The Volkswagen-Rivian partnership comes as automakers shift strategies amid slower-than-expected adoption of EVs. It was not immediately clear what, if any, effect the deal will have on Volkswagen’s plans to build a $2 billion EV plant for its new Scout Motors trucks and SUVs in South Carolina.

Rivian has been on a cost-cutting mission for months. It has trimmed staff, retooled its Illinois plant to increase efficiencies and paused construction of a new multibillion-dollar factory in Georgia. That last measure is expected to save more than $2.25 billion in capital spending, including the impact of starting production of Rivian’s next-generation R2 vehicle at its plant in Illinois.

The EV maker reported a loss of $1.45 billion during the first quarter of this year, as it retooled its plant in Normal, Illinois, to launch updated versions of its R1T pickup and R1S SUV EVs ahead of its next-generation vehicles in 2026.

Rivian reported $7.86 billion in cash, cash equivalents and short-term investments to end March, with more than $9 billion in total liquidity.

This post appeared first on NBC NEWS