Archive

2024

Browsing

Top 5 Stocks in “Go” Trends

Trend Continuation on Rising Momentum

GoNoGo Charts® highlight low-risk opportunities for trend participation with intuitive icons directly in the price action. The resurgence of momentum in the direction of the underlying price trend is an excellent entry opportunity, or the chance to scale up positions.

GoNoGo Icons® illuminate these events on the chart with green solid circles (or red circle to highlight continuation of NoGo trends). When GoNoGo Trend® is painting blue or aqua bars, a green solid circle will appear below price each time GoNoGo Oscillator® finds support at zero.

Below are the top 5 stocks/ETFs in “Go” trends with surging momentum by volume in the S&P 500 as of the daily closing price action:

Uber Technologies, Inc. (UBER)

§ GoNoGo Icons signaled a trend continuation on Friday (06/28/24).

§ After a sharp reversal in early June, price climbed higher finishing the week on strong “Go” conditions painting blue bars.

§ GoNoGo Oscillator found support at the zero line twice this week, before rising positive on Friday.

§ Uber has traded on light relative volume for the past six weeks.

J. P. Morgan Chase & Co. (JPM)

§ GoNoGo Trend returned to “Go” conditions this week following a period of corrective No Go and amber neutral conditions.

§ GoNoGo Icons signaled a trend continuation on Friday (06/28/24).

§ GoNoGo Oscillator ended the week in positive territory after breaking out of a GoNoGo Squeeze.

§ Volume was heavy throughout the rally.

Williams Cos., Inc. (WMB)

§ GoNoGo Trend sustained “Go” conditions, though it softened to weak form aqua bars to end the trading week.

§ GoNoGo Icons signaled a trend continuation on Friday (06/28/24).

§ GoNoGo Oscillator ended the week in positive territory after testing the zero line on heavy relative volume.

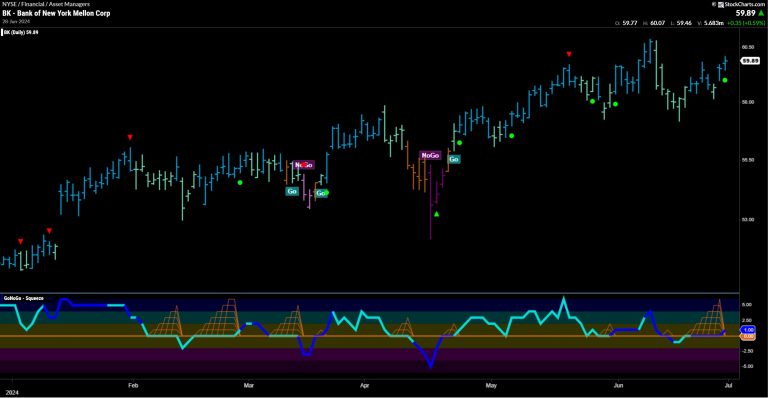
Bank of New York Mellon Corp (BK)

§ GoNoGo Trend returned to strong blue “Go” conditions to end this trading week.

§ This recovery follows weakening trend conditions and corrective price action in early June.

§ GoNoGo Icons signaled a trend continuation on Friday (06/28/24).

§ GoNoGo Oscillator ended the week in positive territory after breaking out of a GoNoGo Squeeze.

§ Momentum broke to positive territory on Friday, rallying on heavy relative volume.

International Business Machines (IBM)

§ GoNoGo Trend ended the trading week on weaker form aqua “Go” conditions.

§ GoNoGo Icons signaled a trend continuation on Friday (06/28/24).

§ GoNoGo Oscillator broke out of a max squeeze, before retesting zero this week and breaking back into positive territory again on Friday.

§ IBM is trading on heavy relative volume.

GoNoGo Charts Plug-In Available for StockCharts ACP

In this StockCharts TV video, Mary Ellen recaps last week’s market activity and the factors influencing market movements. She highlights two names, PANW and ADSK, as two bright spots in an otherwise rough preview of earnings season.

This video originally premiered June 28, 2024. You can watch it on our dedicated page for Mary Ellen on StockCharts TV.

New videos from Mary Ellen premiere weekly on Fridays. You can view all previously recorded episodes at this link.

If you’re looking for stocks to invest in, be sure to check out the MEM Edge Report! This report gives you detailed information on the top sectors, industries and stocks so you can make informed investment decisions.

In this edition of StockCharts TV‘s The Final Bar, join Dave and Grayson as they run through top 10 charts to watch in July 2024! They’ll cover breakout strategies, moving average techniques, relative strength, and much more. You don’t want to miss these insights into market dynamics and chart patterns that could impact your trading decisions.

This video originally premiered on June 28, 2024. Watch on our dedicated Final Bar page on StockCharts TV!

New episodes of The Final Bar premiere every weekday afternoon. You can view all previously recorded episodes at this link.

The stock market’s theme this week seems to be indecision. This could continue until Chairman Powell speaks and the June payrolls number comes out next week. You’d think the May Personal Consumption Expenditures (PCE) report showing slowing inflation would boost equities, but while it technically did, it was brief.

Choppy Equities

If you look at a daily chart of the S&P 500 ($SPX), your first thought may be that the market didn’t do much to end the trading week. But if you pull up an intraday chart, you’ll see a lot of price movement. Initially, stocks rose, as did bond prices. But the rally was short; bonds quickly sold off, and equities stayed higher for over an hour before retreating. The S&P 500 ($SPX) touched a new record high, but the momentum quickly reversed. Equities remained flat for most of the trading day and sold off at the close.

This may be disappointing for bulls as the trading week, month, quarter, and first half of the year ends. But, overall, the year’s first half has been a great ride for equities. Maybe investors are getting nervous about the second half of the year, which may be why the stock market is stalling.

The S&P 500 hasn’t been doing much since last Thursday. It pulled back mainly due to NVIDIA’s selloff, and then it slowly tried to make its way back up (see chart below). But selling pressure came in quickly when it moved too much higher and took the index back down.

CHART 1. CHOPPY STOCK MARKET. The S&P 500 index has been moving sideways for over a week. Will next week present a different picture?Chart source: StockCharts.com. For educational purposes.

The S&P 500 has been moving within a relatively narrow range, and when it tried to break out of this range, it quickly returned. It feels as if bearish pressure quickly jumps in when things get a little too bullish.

Friday’s price action suggests that the market may have hit an exhaustion level, given that the bullish pressure couldn’t hold. The candlestick bar shows that bearish sentiment dominated the day’s trading. The Nasdaq Composite ($COMPQ) shows similar price action.

If you pull up the weekly chart of the S&P 500 (see below), it’s clear the week reflected indecision.

CHART 2. WEEKLY CHART OF S&P 500 INDEX. The week ends on a note of indecision.Chart source: StockCharts.com. For educational purposes.

Next week is a short trading week, but there are some key data points on deck. There’s the June PMI and the June jobs report. More importantly, we’ll hear from Fed Chair Jerome Powell. Will he say something that will make the stock market more decisive? We’ll have to wait and see, but, hopefully, something more exciting happens next week.

It’s All About Interest Rates

Investors continue to focus on interest rate cuts. When will that first rate cut happen? There’s speculation it could be as early as September, but that’s iffy given that we’re in an election year. It could be after the election, taking it to the November meeting.

The Fed has suggested one rate cut this year, which is what the stock market has priced in. Yet, there’s still uncertainty among investors. The 10-year Treasury yield ($TNX) closed higher despite a PCE that indicated inflation is slowly coming down. However, it isn’t at levels to be concerned about.

The daily chart of $TNX below shows that the 10-year yield is hitting a resistance level of its February and March highs. It’s also close to its 100-day simple moving average (SMA). It’ll take a lot for it to break above this level.

CHART 3. DAILY CHART OF 10-YEAR TREASURY YIELDS. While the 10-year yield rose, it’s at a resistance level.Chart source: StockCharts.com. For educational purposes.

The Bottom Line

Despite this week’s sideways move, the uptrend in the S&P 500 and Nasdaq Composite is still in play. Overall market volatility is still low, as reflected by the CBOE Volatility Index ($VIX). There’s a chance we could get some decisiveness creep into the market next week, but don’t be surprised if the choppiness continues. Next week could be slow. Happy Fourth of July!

End-of-Week Wrap-Up

S&P 500 closed down 0.08% for the week, at 5460.48; Dow Jones Industrial Average down 0.08% for the week at 39,118.86; Nasdaq Composite closed up 0.24% for the week, down 0.23% at 17,732.60.$VIX down 5.76% for the week closing at 12.44Best performing sector for the week: EnergyWorst performing sector for the week: UtilitiesTop 5 Large Cap SCTR stocks: NVIDIA (NVDA); Super Micro Computer, Inc. (SMCI); Vistra Energy (VST); Applovin Corp (APP); MicroStrategy Inc. (MSTR)

On the Radar Next Week

June ISM Manufacturing PMIMay JOLTs ReportJune US Jobs ReportFed Chair Powell SpeechJune FOMC Meeting Minutes

Disclaimer: This blog is for educational purposes only and should not be construed as financial advice. The ideas and strategies should never be used without first assessing your own personal and financial situation, or without consulting a financial professional.

2024 has been a year marked by exceptional returns for a relatively small number of high-flying growth stocks. In recent weeks, top performers like Nvidia (NVDA) have pulled back, and Super Micro Computer (SMCI) remains well below its all-time high from earlier this year. So can the major equity benchmarks continue their Q2 strength if these stocks are not breaking out?

First, let’s review the market conditions as defined by the performance of the S&P 500 index.

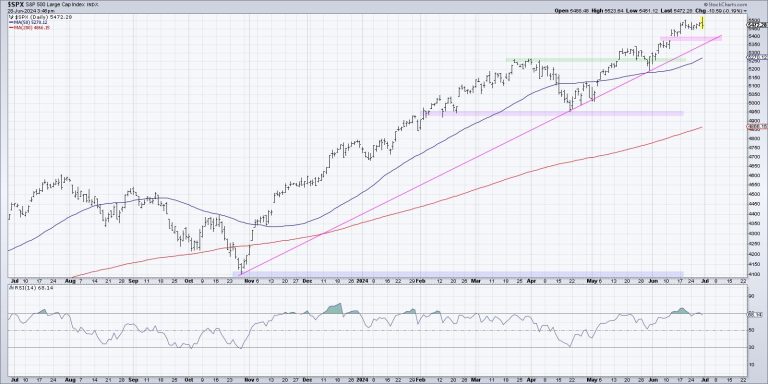
Friday’s session, which initially showed a strong upside reaction after the release of the latest data for the Fed’s favorite measure of inflation, ended up showing weakness as the S&P failed to close above the 5500 level. We remain constructive on the SPX as long as it remains above our “line in the sand” of 5400, which lines up well with trendline support using the major market lows back to October 2023.

I’m meeting up with my Market Misbehavior premium members on Tuesday, July 2nd, to conduct our virtual Monthly Chart Review of key charts to watch in Q3. I’d love for you to join us in this interactive discussion of market conditions! Find more info HERE and use code STOCKCHARTS at checkout for 20% off your first 12 months.

Looking a little closer at some of the top performers in 2024, we can see that some names have dramatically outperformed the SPX in the first half of the year. SMCI is up almost 200% year-to-date, Nvidia has gained around 150%, and the rest of the top ten are all over 50% compared to the S&P 500’s +15% return.

A small number of these strong performers are still pounding out new highs. For example, Eli Lilly (LLY) closed above $900 for the first time this month, continuing a run of incredible strength off its April low. But the real story is that many of these top performers are actually well off their 2024 highs.

NVDA spent this week about 10-15% below its all-time high earlier in June, while Super Micro Computer is still about 30% below its peak above $1200 in March. So the “best of the best” performers are not necessarily screaming strength going into Q3.

So which charts should we be watching going into July, which has traditionally been a very strong month for the S&P 500?

I hereby present the three charts I’ll be focused on, which I call the “MAG” stocks: Meta Platforms (META), Amazon.com (AMZN), and Alphabet (GOOGL). All three are at key technical moments, and all three have the opportunity to either confirm a new market uptrend or raise a red flag of caution. Let’s break them down one by one.

The question for META is whether it can trade not just to resistance but through resistance. Meta Platforms first reached $125 in March, then retested that resistance level again in April and once again in June. When price reaches a key resistance level, it’s all about whether an influx of willing buyers can push the price to new highs. This increase in buying power is what could propel META to new highs, which would certainly help the S&P 500 and Nasdaq achieve further highs.

Amazon.com has already broken to new highs earlier in the week, but Friday’s session saw this leading consumer name pullback toward the breakout level at $190. For a chart like AMZN, it’s all about whether we can remain above the breakout level. Amazon over $190 is a strong chart with a recent breakout, but Amazon below $190 would represent a failed breakout and lack of upside follow-through.

In Alphabet, we see a stock very clearly in a primary uptrend of higher highs and higher lows. Can GOOGL sustain the strong bull phase from Q2 into Q3? With this sort of technical configuration, I’m watching the pullbacks to see if GOOGL can keep making higher lows. My mentor Ralph Acampora would remind me to focus on higher lows in an uptrend, because, as long as the lows keep getting higher, the uptrend appears to be in good shape.

I’m also watching the RSI, which has been above 50 since mid-March. Strong charts have strong momentum, and RSI remaining above 50 would tell me that Alphabet is still in a position of strength among the largest US stocks.

So even though top performers like Nvidia have pulled back, our major equity benchmarks can certainly drive higher. But it will fall to charts like the MAG stocks to demonstrate that investors remain optimistic, and that the optimism is reflected in rising stock prices. Because as long as leading growth names keep leading, this market has plenty of upside potential.

RR#6,

Dave

P.S. Ready to upgrade your investment process? Check out my free behavioral investing course!

David Keller, CMT

Chief Market Strategist

StockCharts.com

Disclaimer: This blog is for educational purposes only and should not be construed as financial advice. The ideas and strategies should never be used without first assessing your own personal and financial situation, or without consulting a financial professional.

The author does not have a position in mentioned securities at the time of publication. Any opinions expressed herein are solely those of the author and do not in any way represent the views or opinions of any other person or entity.

Join Tyler Wood, CMT, in this insightful tutorial where he demonstrates how to effectively scan for GoNoGo conditions using StockCharts.com. GoNoGo Charts, a powerful method developed by Alex Cole and Tyler Wood, blend foundational tools in technical analysis into a powerful and clean data visualization tool, providing traders and investors with a unique perspective on market trends.

Scanning for GoNoGo Criteria in Stockcharts

In this video, Tyler Wood, a seasoned CMT and co-founder of GoNoGo Charts, guides you through the process of setting up scans on StockCharts.com to identify stocks and ETFs that meet specific GoNoGo criteria. Whether you’re looking for trending opportunities, reversals, or confirmation signals, Tyler breaks down the steps clearly and concisely.

Discover how to leverage StockCharts.com’s robust scanning tools to streamline your trading strategies and uncover potential trades aligned with GoNoGo principles. Whether you’re a novice exploring technical analysis or an experienced trader seeking to refine your approach, Tyler’s insights and practical tips will help you navigate the markets with confidence.

Don’t miss out on this opportunity to enhance your trading skills and learn from one of the leading authorities on GoNoGo Charts. Watch now and take your trading to the next level with Tyler Wood, CMT, on StockCharts.com!

An important economic measure for the Federal Reserve showed Friday that inflation during May slowed to its lowest annual rate in more than three years.

The core personal consumption expenditures price index increased just a seasonally adjusted 0.1% for the month and was up 2.6% from a year ago, the latter number down 0.2 percentage point from the April level, according to a Commerce Department report.

Both numbers were in line with the Dow Jones estimates. May marked the lowest annual rate since March 2021, which was the first time in this economic cycle that inflation topped the Fed’s 2% target.

Including food and energy, headline inflation was flat on the month and also up 2.6% on an annual basis. Those readings also were in line with expectations.

“It is just additional news that monetary policy is working, inflation is gradually cooling,” San Francisco Fed President Mary Daly told CNBC’s Andrew Ross Sorkin during a “Squawk Box” interview. “That’s a relief for businesses and households who’ve been struggling with persistently high inflation. It’s good news for how policy is working.”

The Fed focuses on the PCE inflation reading as opposed to the more widely followed consumer price index from the Labor Department’s Bureau of Labor Statistics. PCE is a broader inflation measure and accounts for changes in consumer behavior, such as substituting their purchases when prices rise.

While the central bank officially follows headline PCE, officials generally stress the core reading as a better gauge of longer-term inflation trends.

Outside of the inflation numbers, the Bureau of Economic Analysis report showed that personal income rose 0.5% on the month, stronger than the 0.4% estimate. Consumer spending, however, increased 0.2%, weaker than the 0.3% forecast.

Prices were held in check during the month by a 0.4% decline for goods and a 2.1% slide in energy, which offset a 0.2% increase in services and a 0.1% gain for food.

However, housing prices continued to rise, up 0.4% on the month for the fourth straight time. Shelter-related costs have proven stickier than Federal Reserve officials have anticipated and have helped keep the central bank from reducing interest rates as expected this year.

Stock market futures were modestly positive following the report while Treasury yields were negative on the session.

Investors have been trying to handicap the Fed’s intentions on rates this year and have had to scale back expectations. Whereas traders earlier in 2024 had been expecting at least six rate cuts this year they are now pricing in just two, starting in September. Fed officials at their June meeting penciled in just one reduction this year.

“The lack of surprise in today’s PCE number is a relief and will be welcomed by the Fed,” said Seema Shah, chief global strategist at Principal Asset Management. “However, the policy path is not yet certain. A further deceleration in inflation, ideally coupled with additional evidence of labor market softening, will be necessary to pave the way for a first rate cut in September.”

The Fed targets 2% inflation and began raising interest rates in March 2022 after a year of dismissing rising prices as transitory effects from the Covid pandemic that likely would fade. The central bank last raised rates in July 2023 after taking its benchmark overnight borrowing level to a range of 5.25%-5.50%, the highest in some 23 years.

Recent economic data has painted a picture of an economy that has withstood the Fed’s aggressive monetary tightening. Gross domestic product rose at a 1.4% annualized rate in the first quarter and is on pace to increase 2.7% in the second quarter, according to the Atlanta Fed.

There have been some slight cracks in the labor market lately, with continuing jobless claims hitting their highest level since November 2021. However, the unemployment rate is still 4%, low by historical means though also rising at a slow pace.

This post appeared first on NBC NEWS

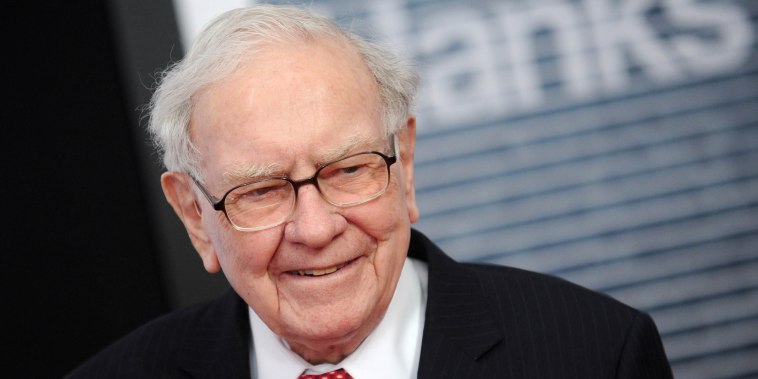
Warren Buffett on Friday made his biggest annual donation to date, giving $5.3 billion worth of Berkshire Hathaway shares to five charities.

The legendary investor, who’s turning 94 in August, converted 8,674 of his Berkshire Class A shares to donate more than 13 million Class B shares, according to a statement Friday. A total of 9.93 million shares went to the Bill & Melinda Gates Foundation, with the rest going to the Susan Thompson Buffett Foundation, named for his late first wife, and the three charities led by his children Howard, Susan and Peter Buffett.

The “Oracle of Omaha” has pledged to give away the fortune he built at Berkshire, the Omaha, Nebraska-based conglomerate he started running in 1965. Buffett has been making annual donations to the five charities since 2006.

After Friday’s donations, Buffett owns 207,963 Berkshire A shares and 2,586 B shares, worth about $130 billion.

In an interview with The Wall Street Journal, Buffett clarified that after his death, the enormous fortune he amassed from building the one-of-a-kind conglomerate will be directed to a new charitable trust overseen by his three children.

“It should be used to help the people that haven’t been as lucky as we have been,” he told the Journal. “There’s eight billion people in the world, and me and my kids, we’ve been in the luckiest 100th of 1% or something. There’s lots of ways to help people.”

Buffett has previously said his three children are the executors of his will as well as the named trustees of the charitable trust that will receive 99%-plus of his wealth.

He told the Journal that the Bill & Melinda Gates Foundation will no longer receive donations after his death. Buffett resigned as a trustee at the Gates Foundation in June 2021 in the midst of Bill and Melinda Gates’ divorce.

At Berkshire’s annual meeting in May, Buffett spoke candidly to shareholders about a future when he’s no longer at the helm, appearing solemn at times as he pondered his advanced age and reflected on his late friend and business partner Charlie Munger.

Greg Abel, vice chairman for noninsurance operations at Berkshire, has been named Buffett’s successor and has taken on most of the responsibility at the conglomerate.

Buffett previously said his will will be made public after his death.

“After my death, the disposition of my assets will be an open book — no ‘imaginative’ trusts or foreign entities to avoid public scrutiny but rather a simple will available for inspection at the Douglas County Courthouse,” Buffett said in November.

This post appeared first on NBC NEWS

Walgreens is planning potentially sweeping store closures as it faces what its CEO called a “challenging” environment for pharmacies and U.S. consumers.

The pharmacy chain announced quarterly earnings Thursday morning that fell short of Wall Street expectations. Walgreens’ stock price dropped 22% on the day.

In an interview with CNBC, CEO Tim Wentworth said the company now forecasts weaker consumer spending for the rest of the year.

″We assumed … in the second half that the consumer would get somewhat stronger,” but “that is not the case,’ Wentworth said. 

‘The consumer is absolutely stunned by the absolute prices of things, and the fact that some of them may not be inflating doesn’t actually change their resistance to the current pricing,’ he added. ‘So we’ve had to get really keen, particularly in discretionary things.’

Last month, Walgreens, following Target’s lead, announced plans to slash prices on 1,300 items to better serve customers it said were increasingly under ‘financial strain.’

Wentworth didn’t state an exact number of closures, but it implied it could be as much as 25% of the chain’s approximately 8,600 stores.

“Seventy-five percent of our stores drive 100% of our profitability today,” he said. “What that means is the others we take a hard look at, we are going to finalize a number that we will close.”

Walgreens has contended with difficulties for years.

Its share price has declined steadily for about a decade, dropping from a peak of more than $95 a share in 2015 to less than $15 today. It has reported reduced revenues from prescription drugs, and its retail offerings remain under pressure from both big-box chains and Amazon.com. And it already announced a plan to close 150 U.S. stores last summer.

Today, Walgreens is about one-third the size of its chief rival, CVS, which has also been under pressure over the past two years.

Since the Covid 19 pandemic, Walgreens has gone through a period of executive leadership turmoil: Wentworth was named CEO in October after his predecessor, Starbucks and Walmart veteran Rosalind Brewer, unexpectedly announced her departure less than three years into the job.

A bright spot was its health care segment, which topped revenue estimates. Walgreens views on-site medical services and specialty pharmacy offerings as critical to its push to transform from a major drugstore chain into a large health care company. 

This post appeared first on NBC NEWS