Archive

2024

Browsing

Sen. Bernie Sanders, I-Vt., said Sunday that while President Biden had a ‘terrible’ debate against former President Trump, he recently spoke to Biden and continues to support him in his quest for re-election.

Sanders – who at 82 is older than Biden – said people should look beyond age, despite increasing concerns from both parties over the president’s mental fitness.

‘Biden is old,’ Sanders told host Robert Costa of the 81-year-old president. ‘He’s not as articulate as he once was. I wish he could jump up the steps on Air Force One. He can’t. What we have got to focus on is policy, whose policies have and will benefit the vast majority of the people in this country.’

The senator said he believes the American people want a president with the ‘guts to take on corporate America.’ Someone who will expand Medicare, raise and extend the life of Social Security benefits, and talk about a ‘permanent child tax credit to cut childhood poverty in America by 50%.’ 

Sanders said 60% of Americans are living paycheck to paycheck, and that 25% of ‘elderly people’ are trying to live off $15,000 a year or less.

‘The American people want an agenda for the next four years that speaks to the needs of the working class of this country,’ Sanders said. ‘He has got to say, ‘I am prepared to take on corporate greed, massive income and wealth inequality and stand with the working class in this country.’ He does that, he’s going to win and win big.’

Sanders wrapped up the interview by saying he is running for re-election as senator from Vermont. 

This post appeared first on FOX NEWS

President Biden, reeling from a disastrous debate performance and calls to step aside, addressed a Black church service in Pennsylvania on Sunday, acknowledging the ‘world’s looking to America.’

Speaking from a stage at Mount Airy Church of God in Christ in northwest Philadelphia, the 81-year-old Biden laughed off concerns about his age, joking, ‘I know I look 40’ but ‘I’ve been doing this a long time.’

‘I, honest to God, have never been more optimistic about America’s future if we stick together,’ Biden said.

The president, later on in his remarks, also addressed the upcoming NATO summit in Washington, D.C.

‘I’m about to host the NATO nations in Washington. We put them together,’ Biden said. ‘The world’s looking to us. Not a joke. The world is looking to America not to carry their burden, but to lead their hopes.’ 

‘When I ran for the first time for president, I said something basic. I said, we have to bring back dignity and hope in America, number one,’ the president added, wrapping up his remarks. 

‘Number two, we have to give working class and middle class people, like the family I came from, a shot and build the economy from the middle out and the bottom up, not the top down,’ Biden said. ‘And thirdly, we must unite America again. That’s my goal. That’s what we’re going to do. God bless you all and may God bless our troops.’ 

NATO Secretary-General Jens Stoltenberg was asked during an appearance on CBS’ ‘Face The Nation’ about whether Sen. Lindsey Graham, R-S.C., was accurate in voicing concerns that world leaders don’t trust Biden to be in command of the job. 

‘I think it’s important for NATO to stay out of that kind of domestic discussion,’ Stoltenberg said. ‘They’re of course important for the United States, but NATO should not be part of it. What matters for NATO is the decisions. What to do together. And just for instance, on defense spending, which has been a big issue for the United States for many years under different presidents. When we made the pledge 10 years ago to increase defense spending, only three allies spent 2% of GDP on defense. This year, it’s 23 allies.’ 

Biden and his NATO counterparts are meeting in Washington this week to mark the 75th anniversary of the world’s biggest security organization just as Russia presses its advantage on the battlefield in Ukraine.

The three-day summit, which begins Tuesday, will focus on ways to reassure Ukraine of NATO’s enduring support and offer some hope to its war-weary citizens that their country might survive the biggest land conflict in Europe in decades. NATO’s day-to-day work is led by Stoltenberg, the former prime minister of Norway, until he is replaced as secretary-general on Oct. 1 by outgoing Dutch Prime Minister Mark Rutte.

The Associated Press contributed to this report. 

This post appeared first on FOX NEWS

The White House announced on Sunday that Second Gentleman Doug Emhoff recently tested positive for COVID-19. 

In a statement, the office of the Second Gentleman noted that Emhoff tested positive on Saturday ‘after experiencing mild symptoms.’

‘He is fully vaccinated and three times boosted,’ the statement read. ‘He is currently asymptomatic, continuing to work remotely, and remaining away from others at home.’

The press release also noted that Vice President Kamala Harris recently tested negative for the virus.

‘Out of an abundance of caution, yesterday, the Vice President was tested for COVID-19,’ the release added. ‘She tested negative and remains asymptomatic.’

Emhoff and Harris were photographed standing near President Biden and First Lady Jill Biden on Thursday during the White House’s Fourth of July celebration. 

Fox News Digital asked the White House if Biden was tested for the illness, but did not receive an immediate response.

The second gentleman’s diagnosis comes nearly three-and-a-half years after the COVID-19 pandemic began. Earlier in June, the Centers for Disease Control and Prevention (CDC) warned that coronavirus infections are ‘growing or likely growing’ in 44 states and territories.

Dr. Marc Siegel, physician, clinical professor of medicine at NYU Langone Medical Center and a Fox News medical contributor, recently spoke to Fox News Digital about the uptick in recent cases.

‘There has been an upsurge in certain areas, including California — fueled by the so-called FLiRT variants, KP.3, KP.2 and KP.1,’ he explained. ‘It could spread to more states.’

Siegel explained that the new COVID1-10 variants are still ‘immunoevasive,’ meaning that they impact people with prior immunity.

‘[Like] all respiratory viruses, it spreads further in low humidity,’ he said. ‘Having said that, it has not shown itself to be seasonal, meaning that it can spread in warm weather easily as well.’

Fox News Digital’s Melissa Rudy contributed to this report.

This post appeared first on FOX NEWS

A far-left political coalition that unexpectedly assembled ahead of France’s snap elections is projected to win the majority of parliamentary seats up for grabs and the country’s prime minister has announced his intention to resign – leading the country into unforeseen territory and possible turmoil.

As the election results came in, French Prime Minister Gabriel Attal announced he will be turning in his resignation on Monday. 

President Emmanuel Macron’s centrist alliance was projected to take the second most seats, while the far right was projected to come in third.

Macron called the snap election just four weeks ago, after the right-wing National Rally (RN) scored enormous success in the European Parliamentary elections in June. Polling before the first round of voting indicated RN would continue to dominate. However, more recent polling ahead of the runoff indicates those returns have diminished and RN will fall short of a clear majority. 

The first round occurred on June 30 and resulted in just 76 of the 577 constituencies in the French National Assembly determining their representative. Candidates who did not receive an outright majority in the first round of voting went on to a second-round runoff, which happened on Sunday.

Going into the election, France was set to elect the RN as the largest party in government, though it was possible no party might emerge with a clear majority in the tightly contested election.

When the results started to come in, projections changed toward the left, signifying a lack of majority for any single alliance, which threatened to plunge France into economic and political turmoil.

The final results of the election are not expected until late Sunday or early Monday.

Macron made a huge gamble when he called for the snap election, and the projections show the gamble may not have paid off for the unpopular president and his alliance, which lost control of parliament.

While the far-right RN greatly increased the number of seats it now holds in parliament, the results fell short of the party’s expectations.

Far-left leader Jean-Luc Mélenchon urged Macron to invite the leftist New Popular Front coalition to form a government, given projections that put it in the lead.

Macron’s office said the president would ‘wait for the new National Assembly to organize itself’ before making any decisions.

A hung parliament with no single bloc coming close to getting the 289 seats needed for an absolute majority in the National Assembly, the more powerful of France’s two legislative chambers, would be unknown territory for modern France.

France doesn’t have a tradition of lawmakers from rival political camps coming together to form a working majority.

The projections, if confirmed by official counts, will spell intense uncertainty for a pillar of the European Union and its second-largest economy, with no clarity about who might partner with Macron as prime minister in governing France.

Fox News Digital’s Peter Aitken and The Associated Press contributed to this report.

This post appeared first on FOX NEWS

France is set to elect the right-wing National Rally (RN) as the largest party in government, yet no party may emerge with a clear majority in this tightly contested election as the second round of voting kicks off this weekend. 

The first round, which occurred June 30, resulted in just 76 of the 577 constituencies in the French National Assembly determining their representative. Any candidate who did not receive an outright majority in the first round of voting heads on to the second-round runoff, which is set for July 7.

Those few contests that concluded in the first round revealed a lot about voter sentiment and indicated trouble for the current government after RN took one-third of the vote, the most by any party.

The current government is an ‘ensemble,’ a coalition of parties, including French President Emmanuel Macron’s Renaissance (RE), Democratic Movement, Horizons, En Commun and the Progressive federation. Despite the assembly election results, Macron will retain his mandate as president until the 2027 election. 

Macron called the snap election after RN scored enormous success in the European Parliamentary elections in June. Polling before the first round of voting indicated RN would continue to dominate, but more recent polling ahead of the runoff indicates those returns have diminished and RN will fall short of a clear majority. 

Wednesday’s poll indicates RN will end up taking between 190 and 220 seats, but it would need 289 seats to control the assembly, according to Reuters. Additionally, its closest ally, the Republicans, are projected to win – at most – around 50 seats, ruling out some kind of right-wing coalition to take control of the assembly.

The next largest share would go to the New Popular Front alliance, which could net between 159 and 183 seats, leaving Macron’s ensemble third with around 110 to 135 seats. Macron has already ruled out making a new alliance with the left-wing party France Unbowed (LFI), according to French daily Le Figaro.

Many candidates from Macron’s alliance who reached the runoff have already stood down in an effort to focus voters and support behind the strongest non-RN candidate in any given constituency. Former French Prime Minister Edouard Phillippe told French network TF1 TV he would vote for a Communist candidate to stop RN from winning the seat. 

Macron insisted, however, that ‘withdrawing today for left-wing elected officials in the face of National Rally does not mean governing tomorrow with LFI.’

French Prime Minister Gabriel Attal last month blasted LFI as equally extreme and just as dangerous to French society as RN, writing on social media platform X that ‘Insoumise France fuels the National Rally and the National Rally fuels Insoumise France.

‘They fuel hatred, fears and divisions between the French,’ Attal added. ‘On June 30 and July 7, against the extremes and for the Republic, vote!’ 

Opposition to RN stems from its roots as National Front, headed up by Marine Le Pen’s father Jean-Marie Le Pen, who was repeatedly convicted for racist and antisemitic remarks, including elements of Holocaust denial, such as when he referred to Nazi gas chambers as a ‘detail’ of history.

But Marine Le Pen has found support among some of France’s Jewish voters as antisemitism continues to grow in Europe.

Her anti-Islam views and comments, however, have raised concerns among other voters, as well. In 2017, she suggested France expel any foreigners convicted of a crime or suspected of being radicalized and said convicted extremists with dual nationality should be stripped of their French passports, Radio France Internationale reported. 

‘The measures that I want to put in place would mean that many of these people (Islamist attackers) would not have been on our territory or living freely,’ she said in an interview with BFM TV. 

In the event the votes should fall as the polls predict, the most likely outcome for France will be a hung parliament with some kind of begrudging alliance created to get a leader in place. The Conservative Party in Britain regained power from Labour in 2010 through a hung parliament alliance with the Liberal-Democrats, ultimately establishing an outright majority in the following election.

But, at that time, the Conservatives had 306 of 650 seats, making it far easier to broker such a deal. For France, RN would need support from two other parties or would need to form some kind of alliance with a direct rival. 

The government has urged voters to do what they can to continue diminishing RN’s chances of achieving control of the assembly, with Attal arguing voters had a ‘responsibility’ to block RN from victory. 

‘On Sunday evening, what’s at stake in the second round is to do everything so the extreme right does not have an absolute majority,’ Attal said during an appearance on France Inter radio as reported by Voice of America.

‘It is not nice for some French to have to block … by using a vote that they did not want to,’ he added, clarifying that he ‘did not speak about a coalition. I do not want to impose on the French a coalition they did not choose.’ 

This post appeared first on FOX NEWS

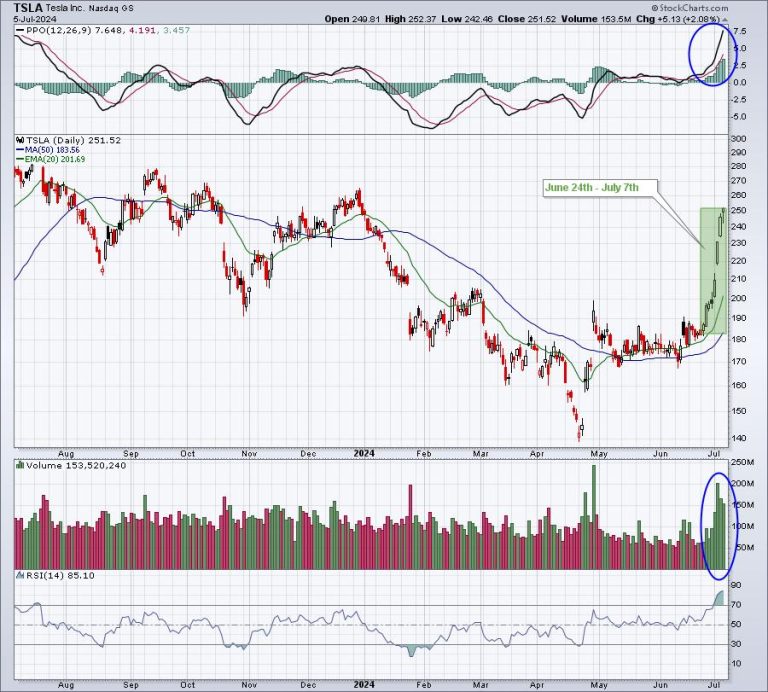
We’re approaching Q2 earnings season, so I’m getting ready for all the short-term trading opportunities that await. But, in the meantime, there are plenty of other earnings opportunities right now – pre-earnings advances. Several of the large cap names (think Mag 7) are already starting powerful advances. Look no further than Tesla, Inc. (TSLA), which reports its results in just a little more than two weeks on July 23rd. TSLA has exploded higher, seemingly out of nowhere, but if you’re a passionate historian, then you know better. TSLA is on our Top 16 list of stocks, where you MUST know seasonal trends. TSLA, throughout this secular bull market, has performed as follows:

24th through 7th: +70.08%8th and 9th: -81.09%10th through 17th: +79.17%18th through 23rd: -26.14%

The latest 24th to 7th period (June 24th – July 7th) is now complete since the 6h and 7th fall on a weekend. Check out how this period just performed:

Does history work this well every time? Of course not. History only provides us tendencies, not guarantees. However, if you know TSLA’s historical tendencies and you see a breakout above key resistance at 208 on massive volume on July 3rd, that seasonal knowledge can help you pull the trigger. Also, June 24th began this bullish period and TSLA was trading just above its 20-day EMA at the time. Further historical tendencies supported TSLA’s advance as well. The first month of calendar quarters (Jan, Apr, Jul, Oct) has easily been TSLA’s strongest, which makes perfect sense to me as TSLA reports quarterly results in the first month of each calendar quarter. Pre-earnings advances are common for TSLA and many other large cap stocks.

Want another? Check out Meta Platforms (META). On Friday, META soared and broke out to another all-time high. Historians weren’t surprised. First, check out the chart:

Technically, META’s breakout and long-term relative strength are quite bullish. But knowing its seasonal tendencies provides even more confidence to trade META. For instance, check out how META performs during its pre-earnings months:

Month 1 (Jan, Apr, Jul, Oct): +54.29%Month 2 (Feb, May, Aug, Nov): +16.21%Month 3 (Mar, Jun, Sep, Dec): +8.40%

These are annualized returns since 2013, when the secular bull market was confirmed. META typically reports its quarterly results late in the first month of each calendar quarter. Its next quarterly report is July 31st, as an example. This current breakout is likely the start of an upside move prior to reporting solid results on the 31st. That is NOT a guarantee, just simply an observation based on history. To further drive home this bullish period for META, consider how it’s traded during the first half of calendar quarters (Jan 1-Feb 15, Apr 1-May 15, etc) vs. the second half (Feb 16-Mar 31, May 16-Jun 30, etc):

First half calendar quarters: +43.11%Second half calendar quarters: +9.29%

I believe this historical knowledge is a critical component in becoming an excellent trader. Why not use all the advantages you can muster?

If you enjoy learning about historical tendencies, you need to first learn the tendencies of the S&P 500 in general. Do you know which 11-consecutive day period of the calendar month (roughly 35% of the calendar month) has produced more than 80% of the S&P 500 gains since 1950? You should. Doesn’t it just make good common sense that you might trade more successfully with this information? This is just one example of what you’ll learn after receiving our Bowley Trend Part 1 report. To claim your FREE copy right now, CLICK HERE. You will automatically be added as a FREE subscriber to our 2x per week (Monday-Wednesday) newsletter, EB Digest, and on Monday, I’ll discuss yet another large cap name with likely upcoming strength that you MUST be aware of.

I’ve also just posted my latest EB Weekly Market Recap video on YouTube. Simply follow this link, “S&P 500 Hits Record High Despite Economic Challenges”. If you enjoy our Weekly Market Recaps, please “Like” the video and be sure to “Subscribe” to our YouTube channel. Ring that bell to make sure you catch all of our YouTube videos.

Happy trading!

Tom

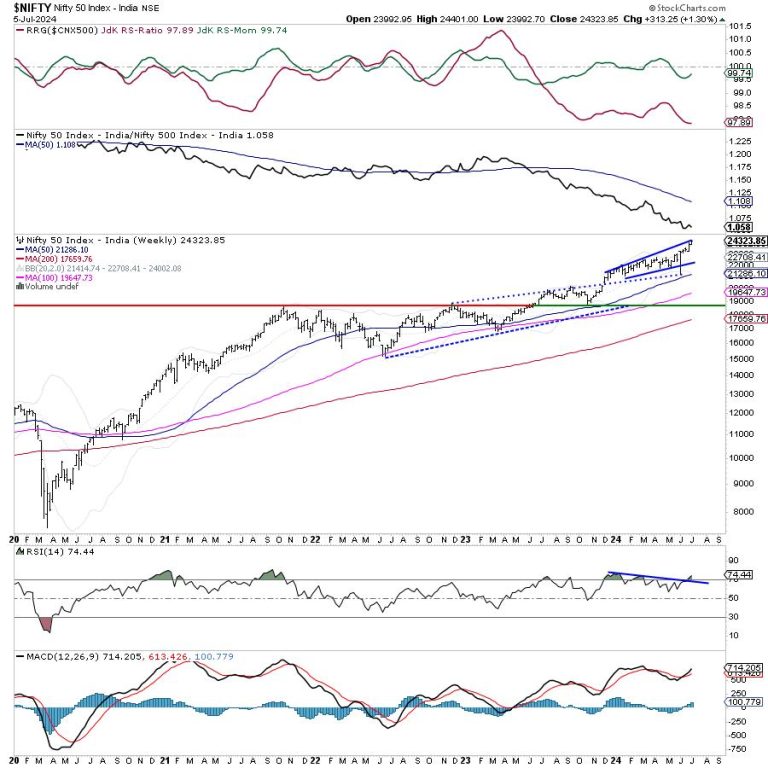
The markets continued with their unabated upmove in the week that went by and ended once again with net gains. While continuing with the advance the Nifty 50 Index extended its move higher. However, as compared to the previous week, this time, the trading range got narrower as the Index oscillated 408.30 points against 824 points. This can largely be attributed to the absence of volatility. Against an increase of 4.72% as compared to the previous week, this week, India VIX came off by 8.02% to 12.69 on a weekly basis. While staying tentative at higher levels, the headline index closed with net weekly gains of 313.25 points (+1.30%).

Despite the up moves getting extended, the markets also continue to show signs of an impending consolidation at higher levels. The 24350-24450 zone stays a strong resistance area for the markets as indicated by the options data. We may not see any major corrective moves taking place but this certainly makes some measured retracement or consolidation imminent at current or slightly higher levels.  Consistent Call OI addition at 24300 and higher strikes make this point more evident. This can also mean that if 24500 is taken out with conviction, the up move may further get extended but this would make the currently over-extended markets unhealthier than what they are now.

Monday is likely to see a quiet start to the week; the levels of 24450 and 24675 may act as immediate resistance levels. The supports come in lower at 24000 and 23735.

There is also a significant deviation from the mean that is observed as Nifty’s nearest 20-week MA and 50-week MA are as far as 1615 points and 2940 points respectively. This highlights the danger that the markets have even if they make even a little event to revert to their mean or even consolidate in a ranged manner. The weekly RSI is 74.44. It stays overbought and remains neutral without showing any divergence against the price. The weekly MACD is bullish and stays above the signal line.

The pattern analysis shows that the Index has ended once again above the upper Bollinger band. This is quite bullish but it also has a possibility of the price pulling themselves back inside the band. As mentioned earlier, the 20-week MA is the nearest support which is placed 1615 points below the current levels at 22708. However, before this, a pattern support exists at 23800.

All in all, the uptrend remains intact and there are no signs of any major corrective move taking place. The markets aren’t showing any signs of major weakness but they certainly look prone and stay vulnerable to measured retracement or ranged consolidation over the coming days. They stay quite overextended and remain deviated from their mean and this keeps them vulnerable at higher levels. As we travel with the trend, it is recommended that we also focus on guarding profits at higher levels. While keeping leveraged positions at modest levels, fresh purchases should be kept limited to defensive pockets and stocks showing improving relative strength. A cautious outlook is advised for the coming week.

Sector Analysis for the coming week

In our look at Relative Rotation Graphs®, we compared various sectors against CNX500 (NIFTY 500 Index), which represents over 95% of the free float market cap of all the stocks listed.

Relative Rotation Graphs (RRG) show that the Nifty Realty, Consumption, and Auto Indices are inside the lagging quadrant along with the Midcap 100 index; all these groups are seen taking a breather and giving up a bit on their relative momentum against the broader markets.

The Nifty Metal index has rolled inside the weakening quadrant. Nifty PSE, Infrastructure, PSU Bank, Commodities, and Energy groups are also inside the weakening quadrant.

The Nifty Services Sector Index and IT index are inside the weakening quadrant; however, both groups show improving relative momentum and may show better relative performance against the broader Nifty 500 index.

Banknifty, Nifty Media, Financial Services, and FMCG indices are placed inside the improving quadrant; the FMCG Index among these is seen giving up on its relative momentum against the broader markets.

Important Note: RRG™ charts show the relative strength and momentum of a group of stocks. In the above Chart, they show relative performance against NIFTY500 Index (Broader Markets) and should not be used directly as buy or sell signals.  

Milan Vaishnav, CMT, MSTA

Consulting Technical Analyst

www.EquityResearch.asia | www.ChartWizard.ae

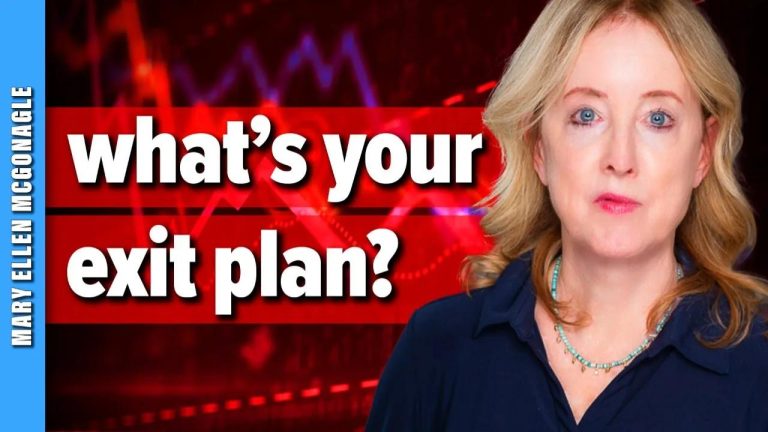
In this StockCharts TV video, Mary Ellen reviews where things stand after the markets close at another new high. She also shares what drove price action this week and how that may change the markets going forward. Finally, she highlights precise sell strategies in a shifting market.

This video originally premiered July 5, 2024. You can watch it on our dedicated page for Mary Ellen on StockCharts TV.

New videos from Mary Ellen premiere weekly on Fridays. You can view all previously recorded episodes at this link.

If you’re looking for stocks to invest in, be sure to check out the MEM Edge Report! This report gives you detailed information on the top sectors, industries and stocks so you can make informed investment decisions.

If you were taking time off from the stock market, since it wasn’t doing much in the last week or so, you’re in for a nice surprise.

July is considered a good month for stocks, and the first trading week of the month, albeit short, didn’t indicate otherwise. It may have been a short trading week, but a lot happened—ECB forum, Fed minutes, PMI data, a new UK Prime Minister, and the June jobs report—to help push the equity market out of its doldrums.

The S&P 500 ($SPX) and Nasdaq Composite ($COMPQ) have broken out of their sideways move and show directional bias toward the upside. Precious metals, i.e. gold ($GOLD) and silver ($SILVER), are moving higher after a pullback. Crude oil prices are consolidating after rising for about a month. The US Dollar Index ($USD) has pulled back and is trading close to a support level.

Looking at the daily chart of the S&P 500 and Nasdaq Composite below, you see a candlestick pattern resembling the three white soldiers. This is an indication that buying pressure remains strong.

CHART 1. BULLISH CHART PATTERN IN THE S&P 500 AND NASDAQ COMPOSITE. The indexes broke out of their sideways move and continued rising. A follow-through next week would mean further upside.Chart source: StockChartsACP. For educational purposes.

NVDA Still Strong

There was some concern that the broader market, especially technology stocks, would pull back after NVDIA’s stock price. But if you look at the daily chart of NVDA stock below, it’s trading well above its 50-day simple moving average (SMA).

CHART 2. DAILY CHART OF NVDA STOCK. Even though NVDA’s stock price pulled back, the overall trend is still up. However, momentum is slowing. This could change next week and is worth watching. Chart source: StockCharts.com. For educational purposes.

The overall trend is up, but that doesn’t mean NVDA’s stock price will hit new highs soon. If you look at the moving average convergence/divergence (MACD) indicator, the MACD line has crossed below the signal line and is trending lower. Volume also has declined. Both these indicators suggest that momentum is slowing. This type of price action is typical of a holiday weekend and shortened trading week, so it may not be an accurate representation. If there’s continued follow-through next week, it would be a more confirming signal.

Bitcoin: The Weak Link

While equities are trending higher, Bitcoin is facing headwinds. Investors are still coming to grips with Mt. Gox’s collapse and the news that it’ll repay its creditors $8.5 billion in crypto. This would mean those who receive coins in their crypto wallets will probably liquidate them, causing Bitcoin prices to fall further.

Looking at the daily chart of Bitcoin to US Dollar ($BTCUSD), it’s trading at its February levels. It’s also bouncing off the 38.2% Fibonacci retracement level (based on the September 2023 lows to March 2024 high).

CHART 3. DAILY CHART OF BITCOIN TO US DOLLAR. Bitcoin is trading at its February 2024 levels. Price could fall lower and hit the 50% and 61.8% Fibonacci retracement levels.Chart source: StockCharts.com. For educational purposes.

The MACD in the lower panel shows the cryptocurrency is losing momentum. If the weak momentum continues, Bitcoin could go as low as its 50% and 61.8% Fibonacci retracement levels. Keep an eye on these levels!

Bonds Prices On the Move

Treasury yields fell after a slightly cooler June jobs report. This increased bond prices (interest rates and bond prices move in opposite directions), a welcome reversal after the sharp July 1 decline. This price action can be seen in the iShares 20+ Year Treasury Bond ETF (TLT).

The chart below shows TLT coming close to breaking below a strong support level. That TLT has bounced off this support level and reversed, which is an indication of the high probability of a Fed interest rate cut by this year.

CHART 4. DAILY CHART OF ISHARES 20+ YEAR TREASURY BOND ETF (TLT). TLT held on to the support of the blue-dashed trendline and reversed.Chart source: StockCharts.com. For educational purposes.

If next week’s June CPI and PPI data suggest inflation continues to cool, interest rate cuts become more likely. Treasury yields could fall further, which means bond prices will rise.

According to the CME FedWatch Tool, the probability of a September interest rate cut sits at around 70%, as of this writing.

Stocks will likely get a boost from the increased probability of an interest rate cut in the September Fed meeting. Next week’s inflation data and Fed Chairman Powell’s statement could impact the stock market’s direction. There are some areas investors should watch.

Add the following two charts to your StockCharts ChartLists.

One shows the divergence between the price action in the Nasdaq Composite and its Advance-Decline line. The other shows the S&P 500 Equal Weighted Index in a consolidation pattern. The direction of these charts could give you a heads-up on the overall stock market direction.

CHART 5. NASDAQ DIVERGES FROM ADVANCE-DECLINE ISSUES LINE.

CHART 6. THE S&P 500 EQUAL WEIGHTED INDEX IS CONSOLIDATING.

End-of-Week Wrap-Up

S&P 500 closed up 1.95% for the week, at 5567.19; Dow Jones Industrial Average up 0.66% for the week at 39,375.87; Nasdaq Composite closed up 3.5% for the week at 18,352.76$VIX up 0.32% for the week closing at 12.48Best performing sector for the week: Consumer DiscretionaryWorst performing sector for the week: EnergyTop 5 Large Cap SCTR stocks: NVIDIA (NVDA); Super Micro Computer, Inc. (SMCI); Vistra Energy (VST); Applovin Corp (APP); Taiwan Semiconductor Mfg. (TSM)

On the Radar Next Week

June CPIJune PPIFed Chair Powell TestimonyTreasury Secretary Yellen TestimonyFed speeches from Barr, Powell, Goolsbee, and Bostic

Disclaimer: This blog is for educational purposes only and should not be construed as financial advice. The ideas and strategies should never be used without first assessing your own personal and financial situation, or without consulting a financial professional.

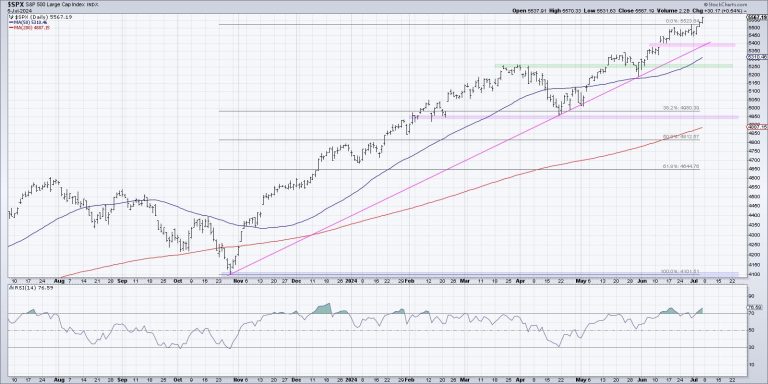
A thorough analysis of seasonal trends for the S&P 500 over the last 12 years provides two key takeaways: there is usually a major market top in the summer, and there is often a major market low in the fall. So, on top of simply analyzing the chart of the S&P 500, what else can we do to anticipate and validate a potential market top?

I would suggest that sector rotation could be key here, because the current uptrend is being driven by a very small number of sectors (actually just one, to be completely honest). Any adjustment to that configuration would constitute a “change of character” for this market, and most likely coincide with the summer market top many are expecting.

While the daily chart of the S&P 500 appears fairly consistent in 2024, aside from a two-week drop in early April, we have to remember that this market had a very different complexion before and after that market low. Before the April pullback, this was a broad advance, with most sectors thriving as the “everything rally” propelled the equity benchmarks higher. In May and June, and now into July, this has been more of a narrow rally, with a small number of mega-cap growth stocks thriving while most stocks have struggled.

I love the simplicity of the RRG graph in visualizing the rotation of the 11 S&P 500 sectors. The weekly RRG shows that it’s clearly been “the technology show” for weeks, as the XLK is the only sector in the Leading quadrant and moving up and to the right. Now, let’s take a deeper look at the relative performance of the S&P 500 sectors in three buckets: growth leadership, value leadership, and defensive sectors.

Defensive sector performance is one of the seven items on my Market Top Checklist. Want to see the other six, and get help navigating a potential summer market top? Check out our Market Misbehavior premium membership and use code STOCKCHARTS for 20% off your first 12 months!

Value Sectors Thrived in Q1, Struggled in Q2

In this series of charts, each line represents a simple ratio of the performance of one sector versus the S&P 500 index. If the line is going up, that means the sector has been outperforming. If the line is trending lower, that means the sector underperformed during that period.

We can see here that the Industrial, Financial, Materials, and Energy sectors have all underperformed the SPX since the April market low. While these sectors all were outperforming in Q1, all four of them are at or near new relative lows as we enter Q3. While the S&P 500 and Nasdaq have been pushing higher, these sectors have not been a part of that success story!

Technology is the Only Sector with Strong Relative Strength

From mid-April to early July, only one of the S&P 500 sectors has actually managed to outperform the benchmark in a meaningful way, that being Technology. While the Consumer Discretionary sector has popped higher in recent weeks driven by AMZN and TSLA, and Communication Services has basically performed in line with the S&P 500, Technology has had the strongest run of relative performance.

Given the dominance of the AI trade in 2024, it’s no surprise how Technology is clear outlier in terms of relative performance. And if there’s one thing I’ve learned from a career as a technical analyst, it’s to stick with winning trades as long as they keep winning!

Defensive Sectors May Be the Most Important to Watch

So that leaves us with three defensive sectors which don’t tend to attract flows unless investors are afraid to own anything else. And all three have underperformed over the last 12 months, reinforcing the bullish sentiment still evident in the stock market.

Utilities stocks had a brief rally in April and May, during a period when most of their earnings calls were focused on power needs for artificial intelligence. But it didn’t take long for that short-term phase to end, and Utilities once again lagged behind the major equity benchmarks.

This chart is one that I feature on my Market Top Checklist, because improvement in the relative strength of defensive sectors suggests that institutional investors are trying to hide out during a period of market uncertainty. And while these three sectors have occasionally outperformed during a bull market phase, their relative lines usually only turn higher during a bear market environment.

For now, the sector relative charts tell the story of a narrow market advance driven by Technology. I would argue that this same set of charts can tell you much of what you need to know to navigate a potential leadership rotation and even a likely market top in the summer months of 2024!

RR#6,

Dave

P.S. Ready to upgrade your investment process? Check out my free behavioral investing course!

David Keller, CMT

Chief Market Strategist

StockCharts.com

Disclaimer: This blog is for educational purposes only and should not be construed as financial advice. The ideas and strategies should never be used without first assessing your own personal and financial situation, or without consulting a financial professional.

The author does not have a position in mentioned securities at the time of publication. Any opinions expressed herein are solely those of the author and do not in any way represent the views or opinions of any other person or entity.