Archive

2024

Browsing

President Biden’s ghostwriter will not face charges despite deleting evidence of the sharing of classified material during the investigation.

Mark Zwonitzer — who collaborated with Biden on his memoir ‘Promise Me, Dad’ — erased audio files in his possession that contained ‘significant evidentiary value,’ according to a report published by Special Counsel Robert Hur. 

Zwonitzer admitted to the FBI that he ‘was aware that there was an investigation’ when he deleted the evidence. 

Hur began investigating Biden’s improper retention of classified records last year. 

Those records included classified documents about military and foreign policy in Afghanistan, among other records related to national security and foreign policy, which Hur said implicated ‘sensitive intelligence sources and methods.’ 

‘When asked whether he deleted the recordings to try and prevent investigators from obtaining them, Zwonitzer said that he did not,’ the report states.

It added, ‘Our investigation […] did not uncover any evidence that Zwonitzer had been in contact with anyone about his decision to delete the recordings.’

Hur will not recommend criminal charges against Biden for mishandling classified documents, despite finding ‘evidence that President Biden willfully retained and disclosed classified materials after his vice presidency when he was a private citizen.’

The materials included ‘marked classified documents about military and foreign policy in Afghanistan, and notebooks containing Mr. Biden’s handwritten entries about issues of national security and foreign policy implicating sensitive intelligence sources and methods.’ 

Hur said FBI agents recovered the materials from ‘the garages, offices, and basement den in Mr. Biden’s Wilmington, Delaware, home.’ 

The special counsel described Biden as ‘a sympathetic, well-meaning, elderly man with a poor memory.’ 

Fox News Digital’s Joe Schoffstall, Brooke Singman, David Spunt and Jake Gibson contributed to this report.

This post appeared first on FOX NEWS

An unidentified Biden official compared Special Counsel Robert Hur’s decision not to recommend criminal charges against the president to a similar decision made during investigations into former Secretary of State Hillary Clinton.

Hur did not recommend charges against President Biden after a monthslong investigation into the president’s alleged improper retention of classified records — despite finding ‘evidence that President Biden willfully retained and disclosed classified materials after his vice presidency when he was a private citizen.’

‘It felt like a Comey moment for me,’ the Biden official reportedly told Politico.

The official was comparing the Biden report to a similar document filed in 2016 by then-FBI Director James Comey.

Comey, investigating whether then-presidential candidate Hillary Clinton improperly handled classified document, did not recommend charges despite ‘evidence of potential violations.’

Both investigators cited the unlikelihood of successfully bringing charges against the individuals and the logistical nightmare of making the charges as reason not to act.

The Biden official speculated to Politico that Hur pushed his ‘thumb on the scale during an election season’ with his decision.

Biden lashed out Thursday night at reporters following an address where he remained defiant following the release of Hur’s damning report, which fueled more questions about his mental acuity.

Biden got into a combative exchange with CNN correspondent MJ Lee, who pressed him on his previous comments urging Americans to ‘watch me’ when he was asked about his age.

‘Many [of the] American people have been watching, and they have expressed concerns about your age,’ Lee said.

‘That is your judgment!’ Biden shouted at her. ‘That is your judgment! That is not the judgment of the press.’

Fox News Digital’s Joe Schoffstall, Brooke Singman, David Spunt, and Jake Gibson contributed to this report.

This post appeared first on FOX NEWS

After sweeping Nevada’s GOP presidential caucus, former President Donald Trump has his eyes on the next major contest on the 2024 Republican nominating calendar — South Carolina.

Trump’s convincing win in Nevada — where 26 delegates were at stake — came hours after he won a landslide victory in a presidential caucus run by the U.S. Virgin Islands GOP.

Here’s a snapshot of where the battle to lead the Republican Party stands. 

Trump: 62
Haley: 17
DeSantis: 9
Ramaswamy: 3

1,215 

2,338

1,968

3,843

Trump’s Nevada caucus victory on Thursday was never in doubt, as he was the only major candidate in a contest run by a friendly state party in which only registered Republicans could vote. His win came hours after he won a landslide victory in a presidential caucus run by the U.S. Virgin Islands GOP. ‘Is there anyway we can call the election?’ Trump said in his victory speech.

Thursday’s Nevada caucus came two days after Trump was a winner in Nevada’s state-run Republican presidential primary, even though he wasn’t on the ballot. Meanwhile, President Biden hit the jackpot in Nevada on Tuesday, with a third-straight ballot box victory in the 2024 Democratic presidential nomination race.

Haley hauled in $1.7 million during in-person fundraising events on Tuesday and Wednesday in California, the Haley campaign shared first with Fox News. While in California, the former two-term South Carolina governor held a pair of campaign events, her first in one of the 15 states that hold nominating contests on Super Tuesday in early March. 

Haley is reiterating her calls for Biden to take a mental competency test in the wake of a special counsel report that described the 81-year-old president’s memory as ‘hazy,’ ‘fuzzy,’ and ‘poor.’ Haley said in a statement Thursday that, ‘Joe Biden should take a mental competency test immediately, and it should be shared with the public.’ Her call came after Special Counsel Robert Hur announced he wouldn’t prosecute Biden, despite finding that the president ‘willfully’ retained classified information, posing ‘serious risks to national security.’


‘I’m well-meaning, and I’m an elderly man, and I know what the hell I’m doing.’

— Biden defends himself after Special Counsel Robert Hur’s report described him as a ‘sympathetic, well-meaning, elderly man with a poor memory.’

Fox News Digital’s Paul Steinhauser contributed to this report.

This post appeared first on FOX NEWS

A United Nations expert on torture is calling on the U.K. government to halt the possible extradition of Wikileaks founder Julian Assange to the U.S., citing concerns that he would be at risk of treatment amounting to torture or other forms of ill-treatment or punishment.

The U.N. Special Rapporteur on Torture, Alice Jill Edwards, said in a press release that Assange ‘suffers from a long-standing and recurrent depressive disorder’ and that he ‘is assessed as being at risk of committing suicide.’

The hearing for Assange’s possible final legal appeal challenging his extradition to the U.S. to face charges for publishing classified U.S. military documents will be held at the High Court in London on Feb. 20 and 21. If he is extradited to the U.S. after exhausting all his legal appeals, Assange would face trial in Alexandria, Virginia, and could be sentenced to up to 175 years in an American maximum-security prison.

‘If extradited, he could be detained in prolonged isolation while awaiting trial, or as an inmate. If convicted, he could be sentenced to up to 175 years in prison,’ Edwards said.

Assange, 52, is facing 17 charges for allegedly receiving, possessing and communicating classified information to the public under the Espionage Act, and one charge alleging a conspiracy to commit computer intrusion.

The charges were brought by the Trump administration’s Justice Department over WikiLeaks’ 2010 publication of cables leaked by U.S. Army intelligence analyst Chelsea Manning detailing war crimes committed by the U.S. government in the Guantánamo Bay, Cuba, detention camp, Iraq and Afghanistan. The materials also exposed instances of the CIA engaging in torture and rendition.

WikiLeaks’ ‘Collateral Murder’ video showing the U.S. military gunning down civilians in Iraq, including two Reuters journalists, was also published 14 years ago.

‘The risk of being placed in prolonged solitary confinement, despite his precarious mental health status, and to receive a potentially disproportionate sentence raises questions as to whether Mr. Assange’s extradition to the United States would be compatible with the United Kingdom’s international human rights obligations, particularly under article 7 of the International Covenant on Civil and Political Rights, as well as respective articles 3 of the U.N. Convention against Torture and the European Convention on Human Rights,’ Edwards said.

‘Diplomatic assurances of humane treatment provided by the Government of the United States are not a sufficient guarantee to protect Mr. Assange against such risk,’ Edwards said. ‘They are not legally binding, are limited in their scope, and the person the assurances aim to protect may have no recourse if they are violated.’

Assange, an Australian journalist and publisher, has been held at London’s high-security Belmarsh Prison since he was removed from the Ecuadorian Embassy on April 11, 2019, for breaching bail conditions. He had sought asylum at the embassy since 2012 to avoid being sent to Sweden over allegations he raped two women because Sweden would not provide assurances it would protect him from extradition to the U.S. The investigations into the sexual assault allegations were eventually dropped.

Last month, a group of Australian lawmakers wrote a letter to U.K. Home Secretary James Cleverly demanding Assange’s U.S. extradition be halted over concerns about his safety and well-being. The letter asked the U.K. government to make an independent assessment of Assange’s risk of persecution.

A cross-party delegation of Australian lawmakers also visited Washington, D.C., last year and met with U.S. officials, members of Congress and civil rights groups to demand the charges against Assange be dropped. Multiple bipartisan efforts were also made last year by U.S. lawmakers who demanded Assange’s release.

Australian Prime Minister Anthony Albanese has also repeatedly called on the U.S. in the last year to end the prosecution of Assange.

No publisher had been charged under the Espionage Act until Assange, and many press freedom groups have said his prosecution sets a dangerous precedent intended to criminalize journalism. U.S. prosecutors and critics of Assange have argued WikiLeaks’ publication of classified material put the lives of U.S. allies at risk, but there is no evidence that anyone was put in danger as a result of the documents being published.

The editors and publishers of the U.S. and European outlets that worked with Assange on the publication of excerpts from more than 250,000 documents he obtained in the Cablegate leak — The Guardian, The New York Times, Le Monde, Der Spiegel and El País  — wrote an open letter in 2022 calling for the U.S. to drop the charges against Assange.

The Obama administration elected not to indict Assange in 2013 over WikiLeaks’ 2010 publication of the classified cables because it would have had to also indict journalists from major news outlets who published the same materials. Former President Obama also commuted Manning’s 35-year sentence for violations of the Espionage Act and other offenses to seven years in January 2017, and Manning, who had been imprisoned since 2010, was released later that year.

But the Justice Department under former President Trump later moved to indict Assange under the Espionage Act, and the Biden administration has continued to pursue his prosecution.

‘I call on the Government of the United Kingdom to carefully review Mr. Assange’s extradition order with a view to ensuring full compliance with the absolute and non-derogable prohibition of refoulement to torture and other cruel, inhuman or degrading treatment or punishment and to take all the necessary measures to safeguard Mr. Assange’s physical and mental health,’ Edwards said.

Assange’s lawyer in the U.K., Jennifer Robinson, has previously said she fears he ‘would not survive if extradited to the U.S.’

Under the Trump administration, the CIA allegedly had plans to kill Assange over the publication of sensitive agency hacking tools known as ‘Vault 7,’ which were leaked to Wikileaks, Yahoo reported in 2021. The agency said the leak represented ‘the largest data loss in CIA history.’

The CIA was accused of having discussions ‘at the highest levels’ of the administration about plans to assassinate Assange in London and allegedly followed orders from then-CIA director Mike Pompeo to draw up kill ‘sketches’ and ‘options.’ The agency also had advanced plans to kidnap and rendition Assange and had made a political decision to charge him, according to the Yahoo report.

WikiLeaks also published internal communications in 2016 between the Democratic National Committee and presidential candidate Hillary Clinton’s campaign that revealed the DNC’s attempts to boost Clinton in that year’s Democratic primary.

This post appeared first on FOX NEWS

Costco (COST) stock has soared into uncharted heights, leaving its last all-time record in the dust. With a little under a month before the company is scheduled to open its earnings book, you’d think investors are expecting something of a blowout report, judging from the price action.

Costco Outperforming the Broader Market and the Staples Sector

CHART 1. WEEKLY CHART OF COST. Note COST’s strong outperformance in technical ranking and relative to a few key benchmarks.Chart source: StockCharts.com. For educational purposes.

Costco’s SCTR score crept up to 91, which it hasn’t seen since 2022, when it last broke record-high territory. This indicates that several technical indicators are flashing a bullish signal, supported by the “full sail” position of its 50-week and 200-week simple moving average (SMA). Strong bullish momentum? It sure appears so.

Plus, COST, on a longer-term scale, has outperformed the broader market ($SPX) and its sector, Consumer Staples, quite handsomely, clocking in a 69% and 77% gain over those respective benchmarks. As an aside, COST is among the several large cap stocks that came up on Thursday’s New All-Time Highs scan, on a day when the big three indices barely budged.

But is there sufficient tailwind to maintain its skybound momentum? One way to gauge this is to add an indicator, such as the Money Flow Index (MFI).

Plotting the Money Flow Index on SharpCharts

To add the MFI:

From Your Dashboard, click on Charts & Tools at the top left navigation bar;SharpCharts is the top left selection; enter your ticker symbol there;In the SharpCharts Workbench, select the Money Flow Index from the Indicators menu to view the indicator.

What’s Happening to the Tailwinds?

CHART 2. DAILY CHART OF COST. Note that all points to continued bullishness except for the MFI, which started showing a decline in buying pressure in December.Chart source: StockCharts.com. For educational purposes.

A quick recap: The Money Flow Index (MFI) is essentially a volume-weighted Relative Strength Index (RSI). When prices go up, more money flows in (buying pressure), and when prices go down, money flows out (selling pressure). The MFI is a momentum oscillator that uses volume and price movements to spot potential turning points and extreme price levels.

You can see COST rising steadily with a slight pullback. Meanwhile, the 50-day, 100-day, and 200-day SMAs are fully extended, indicating a strong uptrend.

In contrast, however, the MFI is declining (see blue arrow) from its last “overbought” level in mid-December, as price continued to rise. This divergence indicates that prices are going up, despite buying pressure declining. In short, a pullback is due, and the most recent candle hints that the market may also be getting the message.

Still, it’s too early to confirm that this is the start of a pullback. Typically, Fibonacci retracement levels would be helpful in measuring the pullback and determining a few good long entry points, but this isn’t possible just yet, as the pullback hasn’t been confirmed.

So instead, if you’re bullish on COST, set a price alert at $675, its last swing low (see blue horizontal line).  A break below this level would likely mean prices are heading further down. And from there, you’ll have several potential entry points:

A pullback confirmed would be the green light to use StockCharts’ Fib retracement tool, which can be used to identify an entry point;Look at the 50-day or 100-day SMAs for a potential bounce (especially if any enter confluence with other market support levels); and/orSet your sights at $640 (see red horizontal line), the next swing low, for a potential entry.

The Bottom Line

The StockCharts’ New All-Time High scan engine, coupled with the SCTR ranking, is a valuable tool for identifying strong stocks to trade. Of course, “all-time high” can often mean “too high” or overbought. Indicators like the MFI, among others, can help you understand whether there’s enough momentum to support the stock’s current trajectory or if it’s due for a pullback. Oftentimes, stocks hitting a record high are due for a pullback, and that’s where you select the technical tools to measure the pullback and identify potential entry points.

Disclaimer: This blog is for educational purposes only and should not be construed as financial advice. The ideas and strategies should never be used without first assessing your own personal and financial situation, or without consulting a financial professional.

In this edition of StockCharts TV‘s The Final Bar, Dave digs into The Final Bar Mailbag and answers questions on price patterns like bull flags, what price gaps actually represent on the chart, and why analyzing earnings trends could help you anticipate subsequent moves for stocks like META.

This video originally premiered on February 9, 2024. Watch on our dedicated Final Bar page on StockCharts TV!

New episodes of The Final Bar premiere every weekday afternoon. You can view all previously recorded episodes at this link.

With the release of the new Panels feature on the StockCharts dashboard, there are a lot of ways that users of RRG charts can take advantage! Let’s take a close look at one in particular.

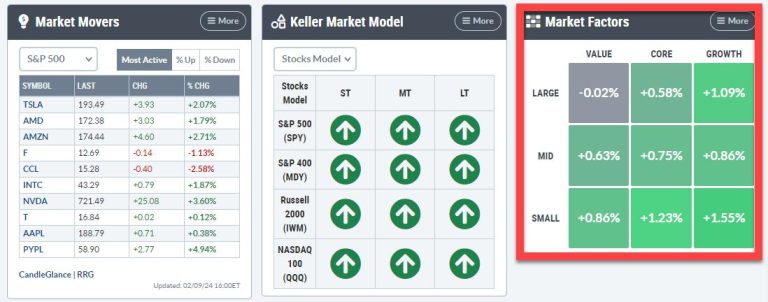
Market Factors Panel

One of the most significant new panels available for users is the “Market Factors” panel.

This panel slices the S&P 1500 into nine segments broken down by size-value-growth. It is very similar to the one used in the RRG dropdown.

The only difference, and there is quite a distinct difference (as you will see), is that this panel uses S&P indices and only covers the S&P 1500 segments. Meaning the S&P 400, 500, and 600, along with its growth and value brothers and sisters.

Two Key RRGs

Here is the RRG from the pre-defined list.

As you can see, I have ticked off the US Growth and US Value indexes, as they cover the entire market (all size segments) and the DJ US index, the benchmark on this graph.

This is the RRG for the market factors using the same underlying ETFs as the Market Factors panel.

The RRG is linked (just click the image) to a live version on the site, which you can then save as a bookmark in your browser for later retrieval. I will also add this to the group of pre-defined universes.

The benchmark for this group is the S&P Composite 1500 index ($SPSUPX).

Same Approach, Different Images

Looking at these two RRGs, you can see that they are quite different from each other but, in the bigger picture, send a similar message.

The differences are primarily caused by the different universes. The DJ groups hold 153 stocks in the large-cap index, 314 in the mid-cap index, and 610 in the small-cap index. So, especially in the large- and mid-cap segments, the S&P groups are much broader, which can have significant effects on the behavior of the indexes.

I use these “Big Picture RRGs” from a very high level. This means I pay much more attention to the general rotations of the various tails vis-a-vis each other than to their exact locations on the RRG.

One observation that I found quite interesting on the Market Factors Panel RRG is the location of the cluster of SPYG, SPY, and SPYV.

What you can learn from this cluster of tails is their positioning on the RRG and the relative positioning among the three of them.

First of all, these are all S&P 500, so large-cap indices, and they are positioned to the right of the benchmark (S&P 1500) and thus in a relative uptrend. You can also see that inside the S&P 500 segment, growth is rapidly improving against value. The preference started to turn around some 5 weeks ago, when the growth and value tails started to curl.

Much like the DJ version, albeit in a different location on the RRG, what you also see is that the mid- and small-cap groups for both the growth and value segments have started to roll over, some of them already at a negative heading. The only group still at a positive heading is large-cap Growth, and maybe mid-cap growth, though the latter is debatable as this tail is still inside the improving quadrant, but on flat momentum at the lowest RS-Ratio reading in the universe.

This is something to ponder over the weekend, as it means that, once again, the foundation of the rally is getting narrower after an attempt of the mid- and small-cap groups to start participating. This attempt seems to fail, while the market continues to climb….. a “Wall of Worry?” Only time will tell, but I believe there is reason enough to get more cautious, and risk is increasing every day.

#StayAlert and have a great weekend. –Julius

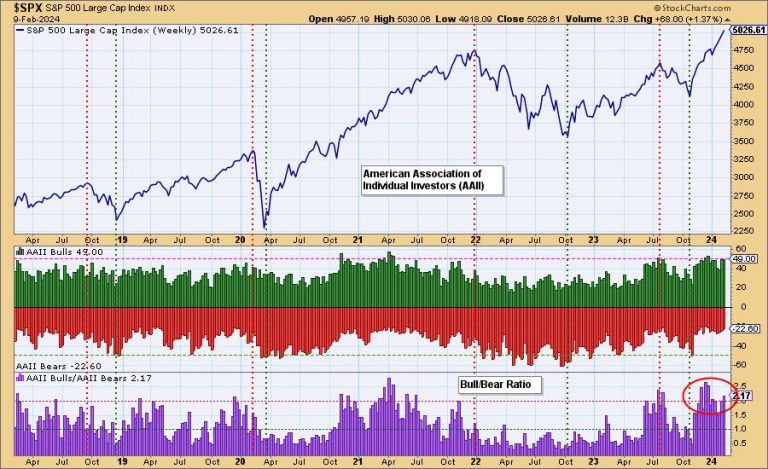
Periodically, we like to review sentiment charts, and today we have two for you. One is the poll results from the American Association of Individual Investors (AAII) and the other is the National Association of Active Investment Managers (NAAIM) Exposure level.

In both cases, we are starting to see sentiment lopsided to the bullish side. Not a surprise; given the rally out of the October lows, investors should be bullish. However, bullish sentiment becomes a problem if it hits extremes. Sentiment is contrarian. When investors get overly bullish and hop on the wagon, the wheels will eventually fall off from the weight. The reverse is also true with extreme bearish sentiment typically leading to higher prices. This is apparent when you look at key tops and bottoms in the market.

The Bull/Bear Ratio is where to focus on the AAII chart. The ratio is definitely showing strain to the upside, but it could get more overbought.

The NAAIM Exposure Index shows high readings of exposure. We would point out that during a strong bull market move, as we saw in 2020-2021, those readings can get very overbought and not lead to downside. We just note that last time readings got to this level, it was a problem.

Conclusion: Readings on sentiment indicators are lopsided to the bullish side. However, we do note that these readings can persist in a strong bull market move. That is likely the case right now, but we should be aware that current conditions are reading overbought for sentiment indicators. It will be worth watching further.

Watch the latest episode of the DecisionPointTrading Room on DP’s YouTube channel here!

Try us out for two weeks with a trial subscription!

Use coupon code: DPTRIAL2 at checkout!

Technical Analysis is a windsock, not a crystal ball. –Carl Swenlin

(c) Copyright 2024 DecisionPoint.com

Disclaimer: This blog is for educational purposes only and should not be construed as financial advice. The ideas and strategies should never be used without first assessing your own personal and financial situation, or without consulting a financial professional. Any opinions expressed herein are solely those of the author, and do not in any way represent the views or opinions of any other person or entity.

DecisionPoint is not a registered investment advisor. Investment and trading decisions are solely your responsibility. DecisionPoint newsletters, blogs or website materials should NOT be interpreted as a recommendation or solicitation to buy or sell any security or to take any specific action.

Helpful DecisionPoint Links:

Trend Models

Price Momentum Oscillator (PMO)

On Balance Volume

Swenlin Trading Oscillators (STO-B and STO-V)

ITBM and ITVM

SCTR Ranking

Bear Market Rules

In this episode of StockCharts TV‘s The MEM Edge, Mary Ellen reviews why the markets continue to hit new highs while also highlighting which areas are driving this strength. She then shares a low-risk, simple way to participate in the uptrend among these stronger areas.

This video originally premiered February 9, 2024. Click here or on the above image to watch on our dedicated MEM Edge page on StockCharts TV.

New episodes of The MEM Edge premiere weekly on Fridays. You can view all previously recorded episodes at this link.

If you’re looking for stocks to invest in, be sure to check out the MEM Edge Report! This report gives you detailed information on the top sectors, industries and stocks so you can make informed investment decisions.

The S&P 500 shall heretofore be known as an index that has broken the incredible 5,000 level. That alone is a pretty amazing milestone for a benchmark that was down around 3500 just over a year ago! But another significant signal may be developing as well, that being the dreaded Hindenburg Omen.

But what is the Hindenburg Omen, and what does it actually represent?

Today, we’re looking at a broad market indicator created years ago by Jim Miekka, and it essentially looks for conditions that are very common at major market tops. Does a valid signal guarantee a major market top? Of course not. But going back through market history, very few major peaks have occurred without the Hindenburg Omen dropping a bearish signal just beforehand.

You can break the Hindenburg Omen down into three components: a bullish market trend, an expansion in new highs AND new lows, and a bearish rotation in breadth. Let’s review each of these components in turn.

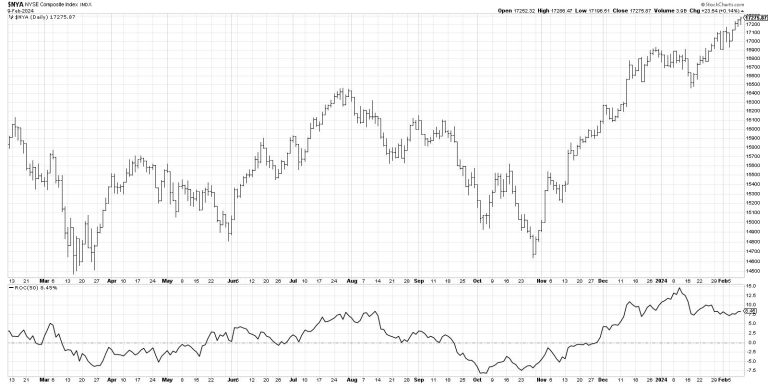
First, we need to confirm that the market is in an established uptrend, as this is an indicator designed to identify market tops. So we take a chart of the NYSE Composite index ($NYA) and look to make sure that the 50-day rate of change (ROC) is positive — i.e., the market is higher than it was ten weeks ago. If so, then the first condition is met.

Next, Miekka noticed that, at major market tops, there were not only plenty of stocks making new 52-week highs, but also a bunch of stocks making new 52-week lows. This implied a period of indecision, as stocks were both breaking out and breaking down around the same time. Technically, we’re looking for at least 2.8% of NYSE listings making a new high and 2.8% making a new low on the same day. This provides the second condition of the three.

Finally, we’re looking for a bearish rotation in market breadth, suggesting that the strength that pushed the benchmarks higher in the bullish phase are now starting to dissipate. Here we use the McClellan Oscillator on NYSE data, and, when the indicator breaks below the zero level, it constitutes a negative breadth reading.

When we put all three indicators together, you get a super busy chart like this!

The series at the bottom is a composite indicator that checks for the three conditions above. When all three conditions have been met, the indicator shows a value of +3. It’s important to note that just one signal is not enough. You need multiple triggers within a one-month period to complete a valid Hindenburg Omen signal.

In recent market history, we’ve seen three valid signals: August 2019, February 2020, and December 2021. Two of those signals occurred before significant drawdowns, which is why the initial signal we noted this week has us a bit skeptical of further market upside today. If we do see a confirmed Hindenburg Omen signal with another confluence of triggers over the next couple weeks, then we may be just peering over the precipice of a major market decline.

Indicators like the Hindenburg Omen don’t signal often, and they are certainly not 100% accurate at calling major market tops. But mindful investors know to pay attention when conditions look similar to previous market tops. Remember, all large losses begin as small losses!

RR#6,

Dave

P.S. Ready to upgrade your investment process? Check out my free behavioral investing course!

David Keller, CMT

Chief Market Strategist

StockCharts.com

Disclaimer: This blog is for educational purposes only and should not be construed as financial advice. The ideas and strategies should never be used without first assessing your own personal and financial situation, or without consulting a financial professional.

The author does not have a position in mentioned securities at the time of publication. Any opinions expressed herein are solely those of the author and do not in any way represent the views or opinions of any other person or entity.