Archive

2024

Browsing

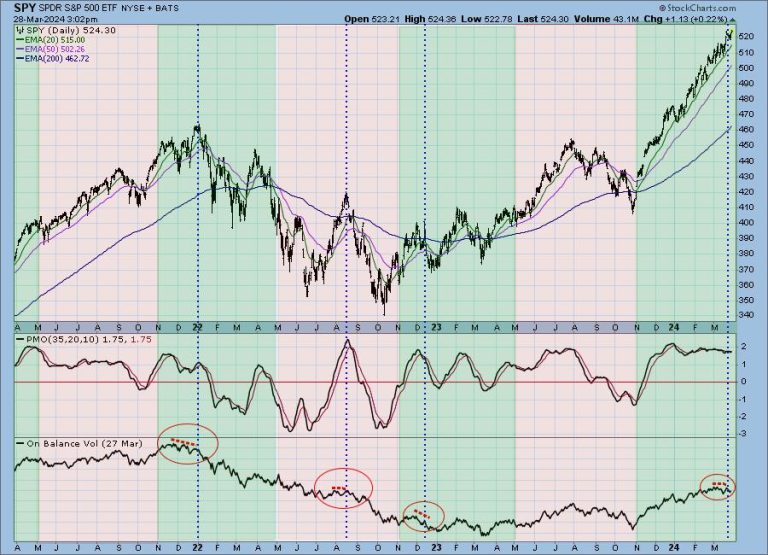
The late Yale Hirsch (Stock Trader’s Almanac) has long been known for identifying the six-month periods of positive and negative seasonality in the stock market. The positive period is November through April, and the negative period is May through October. We are currently in a positive period, which has one more month to go. Unfortunately, the OBV (On-Balance Volume) chart is saying that April may not be all that positive.

The chart below shows the positive periods (green), and the negative periods (pink), and we can see that the market rarely accommodates that rigid schedule. It loosely fits positive and negative behavior within those brackets, but those periods begin and end pretty much when they feel like it. The current positive period, however, has been exceptionally compliant, beginning at the end of October and continuing with unrelenting positivity through March. Can this possibly continue for another month? Of course it can, but there are signs on the OBV chart that say it may end sooner than that.

OBV (On-Balance Volume) is a cumulative line to (or from) which the day’s total volume is added or subtracted based upon whether price closes up or down. Normally, OBV will merely confirm price movement, making lows or highs that match price movement. Boring. What we look for are instances where OBV fails to confirm price. A good example of that on the chart is at the end of 2021 when SPY was making a series of higher tops, but OBV only made a series of lower tops, failing to confirm price movement. Basically, price moved higher, but volume began to thin out. I have marked three other instances where OBV failed to confirm price, and one of them is for the current period.

Conclusion: There are six-month periods of positive and negative seasonality that appear to influence the direction of prices. During the current positive period, beginning in November, the stock market has been unrelentingly positive, but the OBV chart shows that volume has been trending negatively. It could be that the rising trend in prices is about to end.

Learn more about DecisionPoint.com:

Watch the latest episode of the DecisionPointTrading Room on DP’s YouTube channel here!

Try us out for two weeks with a trial subscription!

Use coupon code: DPTRIAL2 at checkout!

Technical Analysis is a windsock, not a crystal ball. –Carl Swenlin

(c) Copyright 2024 DecisionPoint.com

Disclaimer: This blog is for educational purposes only and should not be construed as financial advice. The ideas and strategies should never be used without first assessing your own personal and financial situation, or without consulting a financial professional. Any opinions expressed herein are solely those of the author, and do not in any way represent the views or opinions of any other person or entity.

DecisionPoint is not a registered investment advisor. Investment and trading decisions are solely your responsibility. DecisionPoint newsletters, blogs or website materials should NOT be interpreted as a recommendation or solicitation to buy or sell any security or to take any specific action.

Helpful DecisionPoint Links:

Trend Models

Price Momentum Oscillator (PMO)

On Balance Volume

Swenlin Trading Oscillators (STO-B and STO-V)

ITBM and ITVM

SCTR Ranking

Bear Market Rules

This article (and the next) focuses on trends in the market—an explanation as to why markets trend, reasons why it is good to know that markets trend, then finally, a large research section into how much markets trend. This analysis will initially be shown on 109 market indices that involve domestic, international, and commodity sectors. Following that the full list of all S&P GICS sectors, industry groups, and industries are shown following the same format. There is a great amount of data in these two sections. I try to slice through it with simple analysis, keeping in mind that lots of data does not equate to information.

Why Markets Trend

Trends in markets are generally caused by short-term supply-and-demand imbalances with a heavy overdose of human emotion. When you buy a stock, you know that someone had to sell it to you. If the market has been rising recently, then you know you will probably pay a higher price for it, and the seller also knows he can get a higher price for it. The buying enthusiasm is much greater than the selling enthusiasm.

I hate it when the financial media makes a comment when the market is down by saying that there are more sellers than buyers. They clearly do not understand how these markets work. Based on shares, there are always the same number of buyers and sellers; it is the buying and selling enthusiasm that changes.

Trending is a positive feedback process. Even Isaac Newton believed in trends with his first law of motion, which stated that an object at rest stays at rest, while an object in motion stays in motion, with the same speed and in the same direction unless acted on by an unbalanced force. Hey, an apple will continue to fall until it hits the ground. Positive feedback is the direct result of an investor’s confidence in the price trend. When prices rise, investors confidently buy into higher and higher prices.

Supply and Demand

A buyer of a stock, which is the demand, bids for a certain amount of stock at a certain price. A seller, which is the supply, offers a certain amount at a certain price. I think it is fair to say that one buys a stock with the anticipation that they can sell it later to someone at a higher price. Not an unreasonable desire, and probably what drives most investors. The buyer has no idea who will sell it to him, or why they would sell it to him. He may assume that he and the seller have a complete disagreement on the future value of that stock. And that might be correct; however, the buyer will never know. In fact, the buyer just might be the seller’s person who buys it from him at a higher price.

The reasons for buying and selling stock are complex and impossible to quantify. However, when they eventually agree, what is it that they agreed on? Was it the earnings of the company? Was it the products the company produces? Was it the management team? Was it the amount of the stock’s dividend? Was it the sales revenues? As it turns out, it was none of those things; the transaction was settled because they agreed on the price of the stock, and that alone determines profit or loss. Changes in supply and demand are reflected immediately in price, which is an instantaneous assessment of supply and demand.

What Do You Know about This Chart?

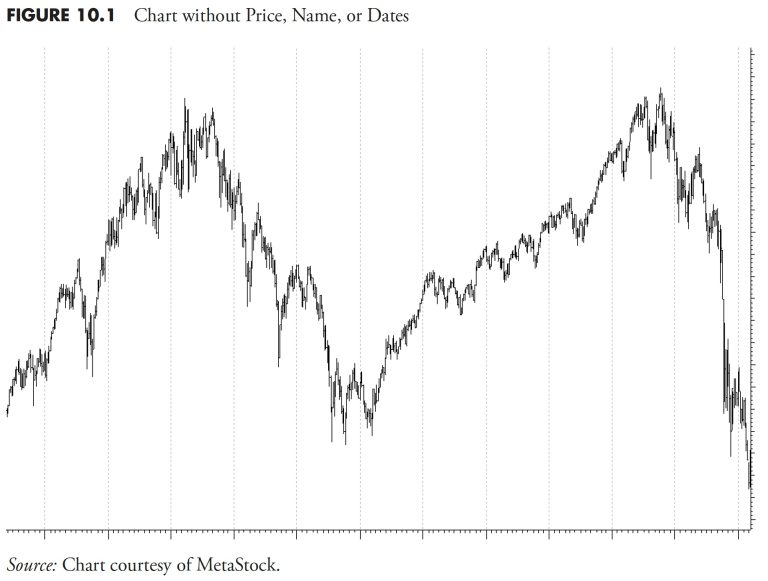
In Figure 10.1, I have removed the price scale, the dates, and the name of this issue; now let me ask you some questions about this issue.

Is this a chart of daily prices, weekly prices, or 30-minute prices?Is this a chart of a stock, a commodity, or a market index? (Okay, I’ll give you this much, it is a daily price chart of a stock over a period of about six years.)During this period of time, there were 11 earnings announcements. Can you show me where one of those announcements occurred and, if you could, whether the earnings report was considered good or bad?Also during the period of time for this chart, there were seven Federal Open Market Committee (FOMC) announcements. Can you tell me where one of them occurred, and whether the announcement was considered good or bad?Does this stock pay a dividend?Hurricane Katrina occurred during this period displayed on this chart; can you tell me where it is?Finally, would you want to buy this stock at the beginning of the period displayed and then sell it at the end of the period (right side of chart)?

I doubt, in fact, I know you cannot answer most of the above questions with any tool other than guessing. The point of this exercise is to point out that there is always and ever noise in stock prices. This noise comes in hundreds of different colors, sizes, shapes, and media formats. The bottom line is that it is just noise. The financial media bombards us all day long with noise. I do not think they do it maliciously; they do it because they believe they are giving you valuable information to help you make investment decisions. Nothing could be further from the truth.

Of course, question number 7 is the one question that most can answer, because from the chart a buy-and-hold investment during the data displayed clearly resulted in no investment growth.

However, let me tell you what I see as shown in Figure 10.2. I see two really good uptrends and, if I had a trend-following methodology that could capture 65 percent to 75 percent of those uptrends, I would be happy. I also see two good downtrends, and if I had a methodology that could avoid about 75 percent of them, I would also be happy. If you could do that for the amount of time shown on the chart below, then you would come out considerably better off than the buy-and-hold investor. I generally only participate in the long side of the market and move to cash or cash equivalents when defensive. However, a long-short strategy could possibly derive even greater profit.

Trend vs. Mean Reversion

I prefer to use a market analysis methodology called trend following. Sometimes it should be called trend continuation. Why? Trend analysis works on the thoroughly researched concept that once a trend is identified, it has a reasonable probability to continue. I know that is the case because, most of the time, markets are trending markets, and I see no reason to adopt a different strategy during a period of mean reverting, such as is experienced in the market from time to time.

You can think of trend following as a positive feedback mechanism. Mean reverting measures are those that oscillate between predetermined parameters; oftentimes the selection of those parameters is the problem. Mean reversion strategies are clearly superior during those volatile sideways times, but the implementation of a mean reverting process requires a level of guessing that I refuse to be a part of. You can think of mean reversion as a negative feedback mechanism.

In technical analysis, there are many mean reverting measures that could be used. They are the ones where you frequently hear the terms overbought and oversold. Overbought means the measurement shows that prices have moved upward to a limit that is predefined. Oversold means the opposite—prices have moved down to a predetermined level. The problem with that type of indicator or measurement is that a parameter needs to be set beforehand to know what the overbought and oversold levels are. Also, if you believe something mean reverts, you will probably have difficulty in determining the rate of reversion. For mean reversion to be relevant, there must be a meaning tied to average (mean) and, since most market data does not adhere to normal distributions, the mean isn’t as meaningful (sic). Kind of like charting net worth and removing billionaires to make the data less skewed and therefore a more meaningful average.

Clearly, mean reverting measurements would work better in highly volatile markets, such as we witness from time to time. One might ask the question: Why don’t you incorporate both into your model? A fair question, but one that shows the inquiry is forgetting that hindsight is not an analysis tool that will serve you well. When do you switch from one strategy (trend following) to the other (mean reversion)? Therein lies the problem.

Another question that might be asked is why not use adaptive measures to help identify the two types of markets. Again, another fair question! I think the lag between the two types of markets and the fact that often there is no clear period of delineation is the issue. It is a natural instinct to want to change the strategy in order to respond more quickly from one to the other. Natural instincts are what we are trying to avoid, simply because they are generally wrong, and painfully wrong at the worst times.

The transition from trend following to mean reversion can be difficult to see except with 20/20 hindsight. For example, when you view a chart which clearly has gone from trending to reversion, from that point, if we had used a simple mean reverting measurement, we would have looked like geniuses. However, in reality, periods like that have existed many times in the past in overall trending markets. Then the next problem becomes when to move away from a mean reverting strategy back to a trend following one. Again, hindsight always gives the precise answer, but in reality it is extremely difficult to implement in real time.

The bottom line is that with markets that generally trend most of the time, keeping a set of rules and stop loss levels in place will probably always win over the long-term. Sharpshooting the process is the beginning of the end. Trend following is somewhat similar to a momentum strategy except for two significant differences: one, momentum strategies generally rank past performance for selection, and two, often they do not utilize stop-loss methods, instead moving in and out of top performers. They both rely on the persistence of price behavior.

Trend Analysis

If one is going to be a trend follower, what is the first thing that must be done (rhetorical)? In order to be a trend follower, you must first determine the minimum length trend you want to identify. You cannot follow every little up and down move in the market; you must decide what the minimum trend length is that you want to follow. Once this is done, you can then develop trend-following indicators using parameters that will help identify trends in the market based on the minimum length you have decided on.

Figure 10.3 is an example of various trend-following periods. The top plot is the Nasdaq Composite index. The second plot is a filtered wave showing the trend analysis for a fairly short-term-oriented trend system. This is for traders and those who want to try to capture every small up and down in the market; a process that is not adopted by this author. The third plot is the ideal trend system, where it is obvious that you buy at the long-term bottom and sell at the long-term top. You must realize that this trend analysis can only be done with perfect 20/20 hindsight, and is probably even more difficult than the short-term process shown in the second plot. The bottom plot is a trend analysis process that is at the heart of the concepts discussed in this book. It is a trend-following process that realizes you cannot participate in every small up and down move, but try to capture most of the up moves and avoid most of the down moves.

There is a concept developed by the late Arthur Merrill called Filtered Waves. A filtered wave is the measurement of price movements in which only the movement that exceeds a predetermined percentage is counted. The price component used in this concept needs to be decided on as to whether to use just the closing prices for the filtered wave or use a combination of high and low prices. This would mean that, while prices are rising, the high would be used, and while prices are falling, the low price would be used. I personally prefer the high and low prices, as they truly reflect the price movements, whereas the closing prices only would eliminate some of the data.

For example, in Figure 10.4 , the background plot is the S&P 500 Index with both the close C and the high low H-L filtered waves overlaid on the prices. You can see that the H-L filtered wave techniques picks up more of the data; in fact, it shows a move of 5 percent in the middle of the plot that the Close only version did not show. In this particular example, the zigzag line uses a filter of 5 percent, which means that each time it changes direction, it had previously moved at least 5 percent in the opposite direction. There is one exception to this, and that is the last move of the zigzag line (there is a similar discussion in an earlier chapter). It merely moves to the most recent close regardless of the percentage moved so it must be ignored.

The bottom plot in Figure 10.5 shows the filtered wave by breaking down the up moves and down moves and then counting the number of periods that were in each move. There are three horizontal lines on that plot; the middle one is at zero, which is where the filtered wave changes direction. In this example, the top and bottom lines are at +21 and -21 periods, which mean that anytime the filtered wave exceeds those lines above or below, the trend has lasted at least 21 periods. Notice that, in this example, there was a period at the beginning (highlighted) where the market moved up and down in 5% or greater moves with high frequency, but never lasted long enough to exceed the 21 boundaries. Then, in the second half of the chart, there were two good moves that did exceed the 21 boundaries. This is a good example of a chart where there was a trendless market (first half) and a trending market (second half). I used the high-low filtered wave of 5 percent and 21 days for the minimum length because that is what I prefer to use for most trend analysis.

The following research was conducted using the high-low filtered wave using various percentages and various trend length measures. The research was conducted on a wide variety of market prices, such as most domestic indices, most foreign indices, all of the S&P sectors and industry groups; 109 issues in all. I offer commentary throughout so you can see that this was a robust process. Any indices or price series that is missing was probably because of an inadequate amount of data, as you need a few years of data to determine a series’ trendiness. The goal of this research was to determine that markets generally trend and if there are some markets that trend better than others. Following this large section, the trend analysis will be shown using the S&P GICS data on sectors, industry groups, and industries.

Table 10.1 is the complete list of indices used in this study along with the beginning date of the data.

I did multiple sets of data runs, but will explain the process by showing just one of them. Table 10.2 is the data run through all 109 indices for the 5% filtered wave and 21 days for the trend to be identified. The first column is the name of the index (they are in alphabetical order), while the next four columns are the results of the data runs for the total trend percentage, the uptrend percentage, the downtrend percentage, and the ratio of uptrends to downtrends.

The total reflects the amount of time relative to the amount of all data available that the index was in a trend mode defined by the filtered wave and trend time; in the case below, a trend had to last at least 21 days and a move of 5% or greater. The up measure is just the percentage of the uptrend relative to the amount of data. Similarly, the downtrend is the percentage of the downtrend to the amount of data. If you add the uptrend and downtrend, you will get the total trend.

The last column is the U/D Ratio, which is merely the uptrend percentage divided by the downtrend percentage. If you look at the first entry in Table 10.2, the AMEX Composite trends 71.18 percent of the time, with 56.16% of the time in an uptrend and 15.03% of the time in a downtrend. The U/D Ratio is 3.74, which means the AMEX Composite trends up almost 4 (3.74) times more than it trends down. You can verify the amount of data in the Indices Date table shown early to see if it was adequate enough for trend analysis. It is not shown, but the complement of the total would give you the amount of time the index was trendless.

At the bottom of each table is a grouping of statistical measures for the various columns. Here are the definitions of those statistics:

Mean. In statistics, this is the arithmetic average of the selected cells. In Excel, this is the Average function (go figure). It is a good measure as long as there are no large outliers in the data being analyzed.

Average deviation. This is a function that returns the average of the absolute deviations of data points from their mean. It can be thought of as a measure of the variability of the data.

Median. This function measures central tendency, which is the location of the center of a group of numbers in a statistical distribution. It is the middle number of a group of numbers; that is, half the numbers have values that are greater than the median, and half the numbers have values that are less than the median. For example, the median of 2, 3, 3, 5, 7, and 10 is 4. If there are a wide range of values that are outliers, then median is a better measure than mean or average.

Minimum. Shows the value of the minimum value of the cells that are selected.

Maximum. Shows the value of the maximum value of the cells that are selected.

Sigma. Also known as standard deviation. It is a measure of how widely values are dispersed from their mean (average).

Geometric mean. First of all, it is only good for positive numbers and can be used to measure growth rates, etc. It will always be a smaller number than the mean.

Harmonic mean. Simply the reciprocal of the arithmetic mean, or could be stated as the arithmetic mean of the reciprocals. It is a value that is always less than the geometric mean, and like the geometric mean, can only be calculated on positive numbers and generally used for rates and ratios.

Kurtosis. This function characterizes the relative peakedness or flatness of a distribution compared with the normal distribution (bell curve). If the distribution is “tall”, then it reflects positive kurtosis, while a relatively flat or short distribution (relative to normal) reflects a negative kurtosis.

Skewness. This characterizes the degree of symmetry of a distribution about its mean. Positive skewness reflects a distribution that has long tails of positive values, while negative skewness reflects a distribution with an asymmetric tail extending toward more negative values.

Trimmed mean (20 percent). This is a great function. It is the same as the Mean, but you can select any number or percentage of numbers (sample size) to be eliminated at the extremes. A great way to eliminate the outliers in a data set.

Trendiness Determination Method One

This methodology for trend determination looks at the average of multiple sets of raw data. An example of just one set of the data was shown previously in Table 10.2, which looks at a filtered wave of 5% and a minimum trend length of 21 days. Following Table 10.3 is an explanation of the column headers for Trendiness One in the analysis tables that follow.

Trendiness average. This is the simple average of all the total trending expressed as a percentage. The components that make up this average are the total trendiness of all the raw data tables, in which the total average is the average of the uptrends and downtrends as a percentage of the total data in the series.

Rank. This is just a numerical ranking of the trendiness average, with the largest total average equal to a rank of 1.

Avg. U/D. This is the average of all the raw data tables’ ratio of uptrends to downtrends. Note: If the value of the Avg. U/D is equal to 1, it means that the uptrends and downtrends were equal. If it is less than 1, then there were more downtrends.

Uptrendiness WtdAvg. This is the product of column Trendiness Average and column Avg. U/D. Here the Total Trendiness (sum of up and down) is multiplied by their ratio, which gives a weighted portion to the upside when the ratio is high. If the average of the total trendiness is high and the uptrendiness is considerably larger than the downtrendiness, then this value (WtdAvg) will be high.

Rank. This is a numerical ranking of the Up Trendiness WtdAvg, with the largest value equal to a rank of 1.

Table 10.4 shows the complete results using Trendiness One methodology.

Trendiness Determination Method Two

The second method of trend determination uses the raw data averages. For example, the up value is calculated by using the raw data up average compared to the raw data total average, which therefore means it only is using the amount of data that is trending and not the full data set of the series. This way, the results are dealing only with the trending portion of the index, and if you think about it, when the minimum trend length is high and the filtered wave is low, there might not be that much trending. Table 10.5 shows the column headers followed by their definitions.

Up. This is the average of the raw data Up Trends as a percentage of the Total Trends.

Down. This is the average of the raw data Down Trends as a percentage of the Total Trends.

Up rank. This is the numerical ranking of the Up column, with the largest value equal to a rank of 1.

Table 10.6 shows the results using Trendiness Two methodology.

Comparison of the Two Trendiness Methods

Figure 10.6 compares the rankings using both “Trendiness” methods. Keep in mind we are only using uptrends, downtrends, and a derivative of them, which is up over down ratio. The plot below is informally called a scatter plot and deals with the relationships between two sets of paired data.

The equation of the regression line is from high school geometry and follows the expression: y = mx + b, where m is the slope and b is the y-intercept (where it crosses the y axis); x is known as the independent variable or the predictor variable and y is the dependent variable or response variable. The expression that defines the regression (linear least squares) shows that the slope of the line (m) is 0.8904. The line crosses the y (vertical) axis at 6.027, which is b. R^2, which is also known as the coefficient of determination, is 0.7928. From R^2, we can easily see that the correlation R is 0.8904 (square root of R^2). We know this is a highly positive correlation because we can visually verify it simply from the orientation of the slope. We can interpret m as the value of y when x is zero and we can interpret b as the amount that y increases when x increases by one. From all of this, one can determine the amount that one variable influences the other.

Sorry, I beat this to death; you can probably find simpler explanations in a high school statistics textbook.

Trendless Analysis

 This is a rather simple but complementary (intentional spelling) method that helps to validate the other two processes. This method focuses on the lack of a trend, or the amount of trendless time that is in the data. The first two methods focused on trending, and this one is focused on nontrending, all using the same raw data. Determining markets that do not trend will serve two purposes. One is to not use conventional trend-following techniques on them, and the other is that it can be good for mean reversion analysis. Table 10.7 shows the column headers; the definitions follow.

Up. This is the Total Trend average from Trendiness One multiplied by the Up Total from Trendiness Two.

Down. This is the Total Trend average from Trendiness One multiplied by the Down Total from Trendiness Two.

Trendless. This is the complement of the sum of the Up and Down values (1 – (Up + Down)).

Rank. This is the numerical rank of the Trendless column with the largest value equal to a rank of 1.

Table 10.8 shows the results using the Trendless methodology.

Comparison of Trendiness One Rank and Trendless Rank

Although I think this was quite obvious, Figure 10.7 shows the analysis math is consistent and acceptable. These two series should essentially be inversely correlated, and they are with coefficient of determination equal to one.

The following tables take the data from the full 109 indices and subdivide it into sectors, international, domestic, and time frames to ensure there is robustness across a variety of data. There are many indices that appear in many of, if not most of, these tables, but keeping data of that sort for comparison with others that are not so widely diversified will enhance the research.

These tables show all three trend method results. This first table consists of all the index data. The remaining ones contain subsets of the All table, such as Domestic, International, Commodities, Sectors, Data > 2000, Data > 1990, and Data > 1980. The reason for the data subsets is to ensure there is a robust analysis in place across various lengths of data, which means multiple bull-and-bear cyclical markets are considered in addition to secular markets. The Data > 2000 means that the data starts sometime prior to 2000 and therefore totally contains the secular bear market that began in 2000.

All Trendiness Analysis

Table 10.9 contains data from all of the 109 indices in the analysis. The first column contains letters identifying the subcategory for each issue as follows:

I – International

S – Sector

C – Commodity

Blank – Domestic

Trend Table Selective Analysis

In this section, I will demonstrate more details on selected issues from Table 10.9 to show how the data can be utilized.

Using the Trendiness One Rank, you can see that the U.S. Dollar Index is number one. You can also see it is the worst for being Trendless (last column), which one would expect. However, if you look at the Trendiness One and Trendiness Two Up Ranks, you see that it did not rank well. This can only be interpreted that the U.S. Dollar Index is a good downtrending issue, but not a good uptrending one based on this relative analysis with 109 various indices. This is made clear from the long trendline drawn from the first data point to the last data point and is clearly in a downtrend.

Figure 10.8 shows the U.S. Dollar Index with a 5% filtered wave overlaid on it. The lower plot shows the filtered wave of 5% measuring the number of days during each up and down move. The two horizontal lines are at +21 and -21, which means that movements inside that band are not counted in the trendiness or trendless calculations. The only difference between what this chart shows and what the table data measures is the fact that the table is averaging a number of different filtered waves and trend lengths.

Let’s now look at the worst trendiness index and see what we can find out about it (Table 10.9). The Trendiness One rank and the Trendless Rank confirm that this is not a good trending index. Furthermore, the Up Trendiness in both One and Two also shows that it ranks low (109 and 81) in the Trendiness One, which is measuring the trendiness based on all the data, and that the rank in Trendiness Two is high (4). Remember that Trendiness Two only looks at the trending data, not all of the data. Therefore, you can say that this index when in a trending mode, tends to trend up well, but the problem is that it isn’t in a trending mode often (see Table 10.11).

Figure 10.9 shows the Turkey ISE National-100 index with the same format as the earlier analysis. Notice that it is generally in an uptrend based on the long-term trend line. From the bottom plot, you can see that there is very little movement of trends outside of the +21 and -21 day bands. Bottom line is that this index doesn’t trend well, and is quite volatile in its price movements; if you are trend follower; don’t waste your time with this one. A question that might arise is that it is also clear from the top plot that it is in an uptrend, so if you used a larger filtered wave and/or different trend length, it might yield different results. My response to that is simply: of course it will, you can fit the analysis to get any results you want, especially with all this wonderful hindsight. Bad approach to successful trend following.

Using the same data table, let’s look at an index that ranks high in the uptrend rankings (Table 10.9). From the table it ranks as middle of the road relatively based on Trendiness One and Trendless rank. However, the rank for Up Trendiness One and Trendiness Two Up rank is high (both are 5). This means that most of the trendiness is to the upside with only moderate downtrends (see Table 10.12).

Figure 10.10 shows the Norway Oslo Index clearly in an uptrend. The bottom plot shows that most of the spikes of trend length are above the +21 band level and very few are below the .21 band level. This confirms the data in the table.

In order to carry this analysis to fruition, let’s look at the index with the worst uptrend rank (Table 10.9). From the table, the Trendiness One and Two Up ranks are dead last (109). The Trendiness One overall rank is 104, which is almost last, and the trendless rank is 6, which confirms that data (see Table 10.13).

Figure 10.11 shows that the Hanoi SE Index is clearly in a downtrend; however, the bottom plot shows that very few trends are outside the bands. And the ones that move well outside the bands are the downtrends. As before, one can change the analysis and get desired results, but that is not how it should be done. One note, however, is that this index does not have a great deal of data compared to most of the others and this should be a consideration in the overall analysis.

Thanks for reading this far. I intend to publish one article in this series every week. Can’t wait? The book is for sale here.

Seven of the nation’s largest gaming companies are joining forces to create a trade group to promote responsible gaming, and for the first time ever, will share information about problem gamblers.

The seven operators — FanDuel, DraftKings, BetMGM, Penn Entertainment, Fanatics Betting & Gaming, Hard Rock Digital and bet365 — will form the Responsible Online Gaming Association, or ROGA, the group announced Wednesday.

The members account for more than 85% of the legal online betting market in the United States. Collectively they have pledged more than $20 million to fund ROGA.

“I’m incredibly excited to move this forward and to really do some impactful things and to really expand the knowledge through the research and to create these evidence-based best practices and to really empower players with information,” said Jennifer Shatley, executive director of ROGA.

ROGA members commit to work together on issues ranging from education, responsible gaming best practices, conscientious advertising and marketing across the industry.

The new group will also create an independent clearinghouse, or database, that will allow them to share key information related to protection of consumers, though the details on how it would work aren’t yet clear.

ROGA says it will create a certification program to assess members’ responsible gaming efforts and provide an incentive for operators to participate.

The new consortium comes as sports betting, both online and in retail outlets, has seen dramatic growth across the nation since 2018. Thirty-eight states and Washington, D.C., now offer legal sports wagering.

This year, a record number of Americans bet on the Super Bowl. Online transactions totaled nearly 15,000 per second, doubling last year’s peak, according to geolocating platform GeoComply.

But as gambling has become more mainstream — and as advertising for sportsbooks spans television, streaming and social feeds — so, too, have headlines involving betting scandals and sports.

In recent days, Los Angeles Dodgers superstar Shohei Ohtani has found himself at the center of a $4 million betting scandal involving his interpreter and an illegal bookie. Ohtani insists he’s never bet on sports. The NBA is investigating Toronto Raptors player Jontay Porter for irregularities around wagering. And U.S. Integrity, a tech firm working to combat illicit betting in college sports, flagged anomalies around the betting lines for Temple University men’s basketball games.

A result of those claims: The potential to provoke outrage and public criticism that could become an inflection point for the U.S. gambling industry. There’s also the potential for gambling’s explosive growth to undermine integrity in sports and entice bettors into addiction.

An estimated 2 million U.S. adults meet the criteria for a severe gambling problem, according to the National Council on Problem Gambling. Another 5 million to 8 million U.S. adults are considered to have a mild or moderate gambling problem.

Problem gambling prompted regulatory crackdowns in Europe and especially in the United Kingdom over the last couple years, impacting sportsbooks’ profitability and changing the way they conduct business.

There has been a concerted effort in the United States for the gambling industry to police itself and ward off harsher regulatory frameworks.

U.S. Rep. Paul Tonko of New York is introducing national legislation that would crack down on what he calls “a public health crisis.” Tonko’s “Supporting Affordability and Fairness with Every Bet Act,” which he introduced last week, would regulate gambling advertising, limit the number and size of deposits, and restrict how artificial intelligence is deployed to acquire customers.

“Your going to have a lot more people saturated with this opportunity, with all these clever concepts of bonus bets, free bets and celebrity spokespersons,” Tonko told CNBC.

An influx of gamblers will result in a dramatic increase in the number of people struggling with addiction, he said.

Some states have slapped operators with fines over gaming violations. In August, Maryland fined DraftKings $94,000 for marketing to underage players. PrizePicks reached a $15 million settlement in New York for operating illegally. In Indiana, the gaming commission fined FanDuel after eight people used illegally obtained debit cards to fund their betting accounts, causing “great harm” to partners on shared bank accounts, according to the Indiana Gaming Commission Chairman Milton Thompson.

Some gambling insiders are skeptical of ROGA, suspicious of what they consider a marketing stunt to address a public relations problem.

Caesars, which is noticeably absent from the group founding ROGA, told CNBC it’s learned best practices from 35 years grappling with responsible gaming.

“While we applaud all efforts to ensure online gaming is both operated and marketed in a responsible manner, we are confident in our [own] Responsible Gaming approach,” the company said in a statement.

Caesars said it’s solely focused on the 21-and-older crowd and does not permit anyone younger than that to sign up for a Caesars rewards account, even in states like Rhode Island or Kentucky where 18-year-olds are permitted to wager.

Many fantasy sports and social betting platforms that operate on a sweepstakes model permit players 18 and older, and many of Caesars’ competitors allow 18-and-up customers to play fantasy sports. Some, too, allow sports betting in that age group in the few states that permit it.

But the industry is working to better insulate its youngest and most vulnerable customers.

The American Gaming Association launched last March an agreement aimed at providing college-aged students protections against the marketing and advertising of sports betting.

Peter Jackson, CEO of Flutter, the parent company of FanDuel, said responsible gaming comes down to good business. Yet, he warns that as legal operators come together to improve responsible gambling, the illegal marketplace will always be willing to take wagers from problem gamblers.

“I urge the state regulators to help us by clamping down on some of those black market operators,” Jackson told CNBC.

This post appeared first on NBC NEWS

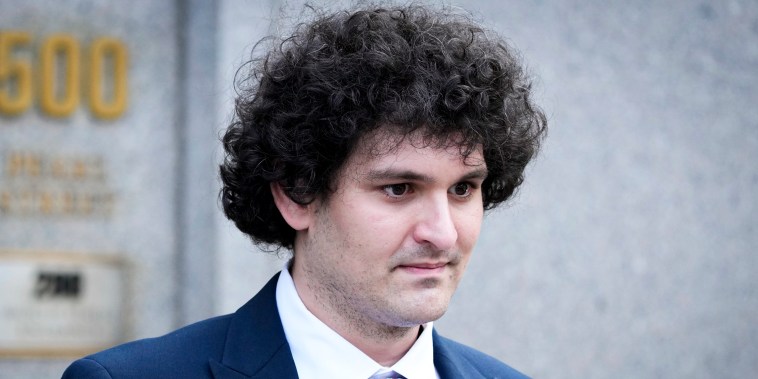
Sam Bankman-Fried will learn his sentence Thursday, four months after he was found guilty of orchestrating the multibillion-dollar fraud that prompted the collapse of the FTX cryptocurrency exchange.

A federal jury in New York City convicted Bankman-Fried, 32, in November on each of the two counts of fraud and five counts of conspiracy he faced. He has been jailed at the Metropolitan Detention Center facility in Brooklyn ever since, with his bail having been revoked over witness-tampering allegations.

Federal prosecutors are seeking as much as 50 years of the statutory 110-year sentence implied by the conviction. Bankman-Fried apparently lacks a criminal history, and prosecutors rarely seek the statutory maximum, said John Coffee, a professor at Columbia University Law School specializing in white-collar criminal defense.

But the nature of the fraud, Bankman-Fried’s comfortable upbringing and the scale of losses to victims led prosecutors to nevertheless seek an aggressive sentence.

‘In every part of his business, and with respect to each crime committed, the defendant demonstrated a brazen disrespect for the rule of law,’ the prosecutors wrote. ‘He understood the rules, but decided they did not apply to him. He knew what society deemed illegal and unethical, but disregarded that based on a pernicious megalomania guided by the defendant’s own values and sense of superiority.’

The prosecutors said Bankman-Fried ‘knew his customers’ expectations — that he would hold their money safe — but he disregarded them based on a callous belief that he could put their money to better use.

Bankman-Fried’s defense team is asking for 6½ years or less. In a 98-page filing pleading for leniency, they cited Bankman-Fried’s mental health struggles, his purported selflessness in his personal life and the safety risks he faces in prison.

They also argued FTX victims did not end up suffering losses — a notion against which the exchange’s current overseer, John Ray, has pushed back.

‘There are plenty of things we did not get back, like the bribes to Chinese officials or the hundreds of millions of dollars he spent to buy access to or time with celebrities or politicians or investments for which he grossly overpaid having done zero diligence,’ Ray wrote in a March 20 memo. ‘The harm was vast. The remorse is nonexistent.’

While the price of bitcoin has begun to surge again, FTX victims are entitled to recover crypto assets only at the prices observed when the exchange filed for bankruptcy.

Bankman-Fried’s consistent lack of remorse throughout the trial is likely to weigh on the sentence U.S. District Judge Lewis Kaplan hands down, Coffee said.

Bankman-Fried has ‘held to the line that he sympathizes with the victims and wants to help them get their money back. That’s not going to work,’ Coffee said. ‘He’s got to find a way to walk a careful line, without abandoning his appeal, to express some contrition. Otherwise the judge is going to say: ‘This guy’s just sticking it to me.”

A separate Bureau of Prisons official will decide where Bankman-Fried ends up serving his sentence. Federal cases do not allow the possibility of parole, but Coffee said Bankman-Fried may end up having some years shaved off his term for good behavior.

But it’s unlikely to add up to much of a reduction, Coffee said.

‘He’s facing real time,’ he said.

This post appeared first on NBC NEWS

Visa and MasterCard announced a settlement with U.S. merchants related to swipe fees, a development that could save consumers tens of billions of dollars.

Swipe fees are paid to Visa, Mastercard and other credit card companies in exchange for enabling transactions. Merchants ultimately pass on those fees to consumers who use credit or debit cards.

According to the settlement announced Tuesday, Visa and Mastercard will cap the credit interchange fees into 2030, and the companies must negotiate the fees with merchant buying groups.

The settlement stems from a 2005 lawsuit which alleged that merchants paid excessive fees to accept Visa and Mastercard credit cards, and that Visa and Mastercard and their member banks acted in violation of antitrust laws.

In 2018 Visa and Mastercard agreed to pay $6.2 billion as part of the long-running suit filed by a group of 19 merchants. But the lawsuit then had two pieces that need to be resolved: a dispute over the rules Visa and Mastercard impose to accept their cards, and the merchants who chose not to participate in the settlement.

Visa said Tuesday that more than 90% of the merchants in Tuesday’s settlement are small businesses.

Mastercard did not acknowledge any improper conduct, which was part of the settlement, and the changes will take effects after approval of the settlement, most likely in late 2024 or early 2025.

The settlement is subject to final approval by the Eastern District Court of New York.

This post appeared first on NBC NEWS

Amazon is making its largest outside investment in its three-decade history as it looks to gain an edge in the artificial intelligence race. 

The tech giant said it will spend another $2.75 billion backing Anthropic, a San Francisco-based startup that’s widely viewed as a front-runner in generative artificial intelligence. Its foundation model and chatbot Claude competes with OpenAI and ChatGPT.

The companies announced an initial $1.25 billion investment in September, and said at the time that Amazon would invest up to $4 billion. Wednesday’s news marks Amazon’s second tranche of that funding.

Amazon will maintain a minority stake in the company and won’t have an Anthropic board seat, the company said. The deal was struck at the AI startup’s last valuation, which was $18.4 billion, according to a source. 

Over the past year, Anthropic closed five different funding deals worth about $7.3 billion. The company’s product directly competes with OpenAI’s ChatGPT in both the enterprise and consumer worlds, and it was founded by ex-OpenAI research executives and employees.

News of the Amazon investment comes weeks after Anthropic debuted Claude 3, its newest suite of AI models that it says are its fastest and most powerful yet. The company said the most capable of its new models outperformed OpenAI’s GPT-4 and Google’s Gemini Ultra on industry benchmark tests, such as undergraduate level knowledge, graduate level reasoning and basic mathematics.

“Generative AI is poised to be the most transformational technology of our time, and we believe our strategic collaboration with Anthropic will further improve our customers’ experiences, and look forward to what’s next,” said Swami Sivasubramanian, vice president of data and AI at AWS cloud provider.

Amazon’s move is the latest in a spending blitz among cloud providers to stay ahead in the AI race. And it’s the second update in a week to Anthropic’s capital structure. Late Friday, bankruptcy filings showed crypto exchange FTX struck a deal with a group of buyers to sell the majority of its stake in Anthropic, confirming a CNBC report from last week.

The term generative AI entered the mainstream and business vernacular seemingly overnight, and the field has exploded over the past year, with a record $29.1 billion invested across nearly 700 deals in 2023, according to PitchBook. OpenAI’s ChatGPT first showcased the tech’s ability to produce human-like language and creative content in late 2022. Since then, OpenAI has said more than 92% of Fortune 500 companies have adopted the platform, spanning industries such as financial services, legal applications and education.

Cloud providers like Amazon Web Services don’t want to be caught flat-footed.

It’s a symbiotic relationship. As part of the agreement, Anthropic said it will use AWS as its primary cloud provider. It will also use Amazon chips to train, build and deploy its foundation models. Amazon has been designing its own chips that may eventually compete with Nvidia. 

Microsoft has been on its own spending spree with a high-profile investment in OpenAI. Microsoft’s OpenAI bet has reportedly jumped to $13 billion as the startup’s valuation has topped $29 billion. Microsoft’s Azure is also OpenAI’s exclusive provider for computing power, which means the startup’s success and new business flows back to Microsoft’s cloud servers.

Google, meanwhile, has also backed Anthropic, with its own deal for Google Cloud. It agreed to invest up to $2 billion in Anthropic, comprising a $500 million cash infusion, with another $1.5 billion to be invested over time. Salesforce is also a backer.

Anthropic’s new model suite, announced earlier this month, marks the first time the company has offered “multimodality,” or adding options like photo and video capabilities to generative AI.

But multimodality, and increasingly complex AI models, also lead to more potential risks. Google recently took its AI image generator, part of its Gemini chatbot, offline after users discovered historical inaccuracies and questionable responses, which circulated widely on social media.

Anthropic’s Claude 3 does not generate images. Instead, it only allows users to upload images and other documents for analysis.

“Of course no model is perfect, and I think that’s a very important thing to say upfront,” Anthropic co-founder Daniela Amodei told CNBC earlier this month. “We’ve tried very diligently to make these models the intersection of as capable and as safe as possible. Of course there are going to be places where the model still makes something up from time to time.”

Amazon’s biggest venture bet before Anthropic was electric vehicle maker Rivian, where it invested more than $1.3 billion. That too, was a strategic partnership. 

These partnerships have been picking up in the face of more antitrust scrutiny. A drop in acquisitions by the Magnificent Seven — Amazon, Microsoft, Apple, Nvidia, Alphabet, Meta and Tesla — has been offset by an increase in venture-style investing, according to Pitchbook.

AI and machine-learning investments from those seven tech companies jumped to $24.6 billion last year, up from $4.4 billion in 2022, according to Pitchbook. At the same time, Big Tech’s M&A deals fell from 40 deals in 2022 to 13 last year. 

“There is a sort of paranoia motivation to invest in potential disruptors,” Pitchbook AI analyst Brendan Burke said in an interview. “The other motivation is to increase sales, and to invest in companies that are likely to use the other company’s product — they tend to be partners, more so than competitors.”

Big Tech’s spending spree in AI has come under fire for the seemingly circular nature of these agreements. By investing in AI startups, some observers, including Benchmark’s Bill Gurley, have accused the tech giants of funneling cash back to their cloud businesses, which in turn, may show up as revenue. Gurley described it as a way to “goose your own revenues.”

The U.S. Federal Trade Commission is taking a closer look at these partnerships, including Microsoft’s OpenAI deal and Google and Amazon’s Anthropic investments. What’s sometimes called “round tripping” can be illegal — especially if the aim is to mislead investors. But Amazon has said that this type of venture investing does not constitute round tripping.

FTC Chair Lina Khan announced the inquiry during the agency’s tech summit on AI, describing it as a “market inquiry into the investments and partnerships being formed between AI developers and major cloud service providers.”

This post appeared first on NBC NEWS

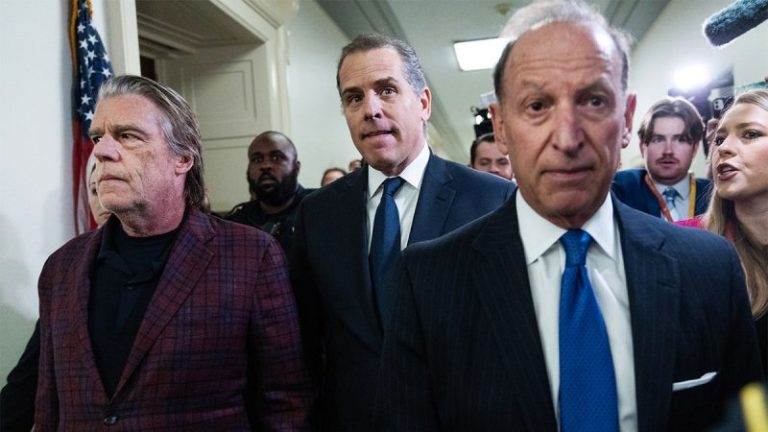
Prosecutors went after Hunter Biden’s attorneys during an hours-long hearing Wednesday on several motions to dismiss criminal tax evasion charges against the president’s son.

The first son did not appear in federal court in Los Angeles on Wednesday, but his attorney Abbe Lowell argued in favor of dismissing what he claimed were politically motivated charges. He said the government was perpetrating ‘the least ordinary prosecution a person could imagine.’

The tax charges against President Biden’s son stemmed from a years-long investigation conducted by Special Counsel David Weiss. Lowell claimed that the timeline of the case showed misdemeanor charges against the Hunter Biden into several felonies.

As Special Counsel Attorney Leo Wise made his arguments against dismissing the case, Lowell shook his head multiple times, appearing annoyed. 

‘When you don’t have the facts you attack the law. When you don’t have the law you attack the facts. When you don’t have the facts or the law, you attack the prosecutors,’ Wise said at one point in reference to Lowell, calling his arguments in favor of dismissal ‘fact-free pleadings.’ 

Wise said Abbe Lowell has attacked the prosecution for working for Jim Jordan, Biden and Putin. ‘These are fact-free pleadings.’ 

Judge Mark Scarsi, who presided over the proceedings in the packed courtroom, cut off representatives for both sides several times. He said he plans to rule on several motions to dismiss federal tax charges against Hunter Biden by April 17.

As the hearing wrapped, Scarsi noted that all sides had agreed on a next pre-trial hearing in Los Angeles on May 29 at 1 p.m.

Previously, Hunter Biden pleaded not guilty to all nine federal tax charges stemming from Weiss’ investigation. Hunter’s trial is scheduled to begin on June 20. 

Weiss charged Hunter Biden in December, alleging a ‘four-year scheme’ when the president’s son did not pay his federal income taxes from January 2017 to October 2020 while also filing false tax reports.

The charges break down to three felonies and six misdemeanors concerning $1.4 million in owed taxes that have since been paid.

In the indictment, Weiss alleged that Hunter ‘engaged in a four-year scheme to not pay at least $1.4 million in self-assessed federal taxes he owed for tax years 2016 through 2019, from in or about January 2017 through in or about October 15, 2020, and to evade the assessment of taxes for tax year 2018 when he filed false returns in or about February 2020.’

The special counsel alleged that Hunter ‘spent millions of dollars on an extravagant lifestyle rather than paying his tax bills,’ and that in 2018, he ‘stopped paying his outstanding and overdue taxes for tax year 2015.’

Lowell is also seeking to dismiss gun charges Weiss brought against Biden in Delaware.

The president’s son pleaded not guilty to all counts in October. 

Lowell also argued in court Wednesday that a diversion agreement on the tax charges was still in effect.

The diversion agreement was included as part of the original plea deal that collapsed in July. Biden was set to plead guilty to two misdemeanor tax counts of willful failure to pay federal income tax, which would allow him to avoid jail time on a felony gun charge. That deal fell apart during his last court appearance. The president’s son, in July, was then forced to plead not guilty to two misdemeanor tax charges and one felony gun charge when the deal collapsed in court.

Fox News’s Lee Ross contributed to this report. 

This post appeared first on FOX NEWS

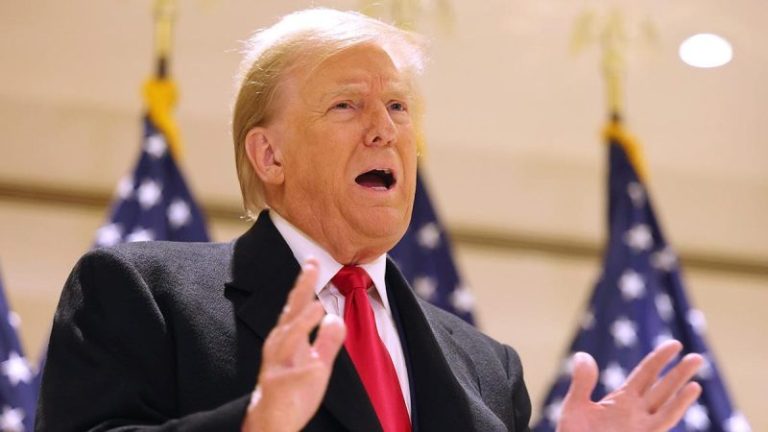
Nick Akerman, a former Watergate prosecutor, said that in his 50-some years in law, he has never seen a gag order like the one imposed on former President Trump in his hush money payments case this week. 

New York Judge Juan Merchan issued the gag order on Tuesday following a request from Manhattan District Attorney Alvin Bragg.

‘This is so unusual,’ Akerman told CNN’s Fredericka Whitfield on Wednesday. ‘This never happens, in over 50 years in law practice, both as a prosecutor and a defense lawyer.’ 

He added, ‘It’s not done, and the reason it’s not done is because once you start disparaging the judge, disparaging people in the courtroom, you’re putting yourself in harm’s way because that’s the judge that’s going to sentence you.’

Akerman added that Trump is ‘the only one I have ever seen do this and do it in such an outrageous way that it’s really forced the courts – to where does the First Amendment stop and where do we need a gag order in order to protect the judicial system?’ 

Trump, the presumptive Republican nominee, has been highly critical of the judge, calling the gag order ‘illegal, un-American, unconstitutional,’ saying that Merchan was ‘wrongfully attempting to deprive me of my First Amendment Right to speak out against the Weaponization of Law Enforcement.’ 

Trump even suggested that the gag order was related to Merchan’s adult daughter’s work as the president of a political consulting firm.

‘Judge Juan Merchan, who is suffering from an acute case of Trump Derangement Syndrome (whose daughter represents Crooked Joe Biden, Kamala Harris, Adam ‘Shifty’ Schiff, and other Radical Liberals, has just posted a picture of me behind bars, her obvious goal, and makes it completely impossible for me to get a fair trial) has now issued another illegal, un-American, unConstitutional ‘order,’ as he continues to try and take away my Rights,’ Trump wrote on Truth Social. 

In issuing the gag order, the judge cited Trump’s ‘prior extrajudicial statements,’ saying they establish ‘a sufficient risk to the administration of justice.’ 

Merchan ordered that Trump cannot make or direct others to make public statements about witnesses concerning their potential participation, or about counsel in the case — other than Bragg — or about court staff, DA staff or family members of staff.

Merchan also ordered that Trump cannot make or direct others to make public statements about any prospective juror or chosen juror. 

Merchan said in his decision that Trump has made statements in the past during other trials — likely referring to the months-long non-jury civil fraud trial stemming from New York Attorney General Letitia James’ case. 

‘lndeed, his statements were threatening, inflammatory, denigrating, and the targets of his statements ranged from local and federal officials, court and court staff, prosecutors and staff assigned to the cases, and private individuals including grand jurors performing their civic duty,’ Merchan writes. ‘The consequences of those statements included not only fear on the part of the individual targeted, but also the assignment of increased security resources to investigate threats and protect the individuals and family members thereof.’ 

Akerman added later on X, ‘Trump’s unprecedented pattern of disparaging and threatening judges, prosecutors and witnesses is self-destructive and makes it more likely he will end up in the slammer.’ 

Former Acting U.S. Attorney General Matt Whitaker, who served under Trump, told Fox News, ‘I think these gag orders are very dangerous… The First Amendment is fairly broad in its protection of our right to speak and speak our minds, and I think ultimately this judge is going to have to tread very carefully.’ 

Trump has had two other gag orders issued against him in recent months. 

Fox News Digital’s Brooke Singman and Maria Paronich contributed to this report. 

This post appeared first on FOX NEWS

: Over the next month and a half, former President Trump’s campaign will be opening dozens of new offices in seven pivotal swing states, complete with hundreds of newly hired staffers, Fox News has learned. 

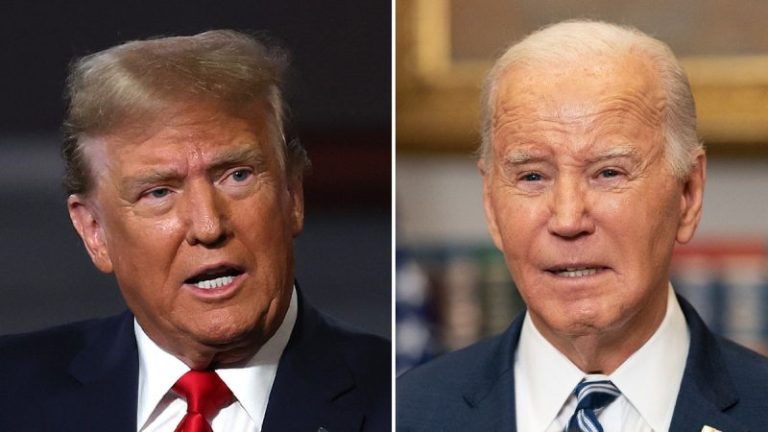
As President Biden and Trump appear headed for a rematch in November, the two will likely put a lot of energy into the seven swing states — Pennsylvania, Michigan, Wisconsin, Arizona, Georgia, Nevada and North Carolina — that could decide the election. 

In the latest Fox News Poll, the two were in a virtual dead heat in Pennsylvania, with Trump leading Biden 49% to 47%. The difference is within the margin of error. 

In Arizona, Trump won in a five-way matchup with Biden, Robert F. Kennedy, Jr., Jill Stein and Cornel West, posting 43% to Biden’s 39%.


Trump’s forthcoming changes to swing state campaign infrastructure comes as Biden criticizes Trump over his infrequent presence in key locations. Trump spent time in Iowa, South Carolina and New Hampshire during the Republican primaries as Biden began ramping up his campaign for the general election. 

With several criminal cases pending against Trump, time spent on the road campaigning could be limited, and critics have said Trump is slow to ramp up his ground game.

Michigan Republican Party Chairman Pete Hoekstra told The Associated Press this week the RNC and Trump campaign had yet to invest in building up the election effort in what promises to be a critical state come November. 

‘We’ve got the skeleton right now,’ Hoekstra told The Associated Press. ‘We’re going to have to put more meat on it.’

His observation coincided with news President Biden’s re-election effort had opened 100 new offices and enlisted over 350 new staff members in Arizona, Georgia and Pennsylvania, adding to the already established swing state staffers working on the ground. 

‘Donald Trump claiming he has a plan to build a battleground state operation while they don’t have money, lay off state staff and close community centers feels eerily similar to some other imminent Trump plans that never came to fruition, like the long promised infrastructure week or his Obamacare replacement. We’ll believe it when we see it,’ Biden campaign spokesperson Seth Schuster said in a statement to Fox News Digital. 

But the RNC and Trump’s campaign pushed back on the idea that they’re behind schedule.

‘We don’t feel the need to talk about the tactics because we lead with our candidate — he’s a winning candidate,’ Republican National Committee spokeswoman Danielle Alvarez said in an interview with Fox News Digital. 

‘We are doing all the tactics,’ Alvarez emphasized. ‘We are raising the money. We are deploying the assets. It all is happening.’

She explained that Trump and the RNC aren’t always going to publicize the steps being taken to ensure victory. 

‘We win when we lead with our candidate. They lose when they lead with their candidate,’ she added. 

Alvarez claimed the Democratic Party ‘cannot put their guy out there’ and is forced to lead ‘with their tactics.’

Trump’s campaign noted that the infrastructure it expects to roll out in critical states over the next 30 to 45 days is early compared to past cycles. Usually, a non-incumbent presidential nominee is not definite until the RNC convention in the summer, and the committee and campaign do not merge until then. 

Earlier this year, it was revealed that, in 2023, the RNC posted its worst fundraising since 2013, only pulling $87.2 million and reporting roughly $8 million in available cash on hand.

In the month of January, Trump saw his cash on hand dwindle to $30 million, while his spending outpaced his fundraising. Biden’s campaign brought in $42 million in the same period and boasted a $130 million war chest for the general election. 

However, last month, both the committee and Trump’s campaign saw improvement. The RNC pulled in $10.6 million, while making gains in cash on hand in February. Trump’s campaign managed to rake in over $20 million last month, boosted by primary victories, while also upping his cash on hand to $42 million.

While fundraising appeared to bounce back as Trump’s campaign merges with the committee, concerns over Trump’s financial situation still remain. The former president has been ordered to make various payments in his criminal cases. 

The RNC and campaign further pushed back at suggestions action hasn’t taken place sooner in the key states due to legal fees for the former president and poor fundraising hauls. Both the committee and campaign expressed confidence, noting that all assets are in line to cover all costs. 

They conceded that the Democrats are expected to enjoy a monetary advantage but claimed Trump doesn’t need as much money to win. 

This post appeared first on FOX NEWS

On a visit to Egypt last weekend, U.N. Secretary-General Antonio Guterres made a stop at the border crossing between the most populous Arab state and the war-stricken Gaza Strip. At the Rafah crossing, Guterres described seeing a ‘long line of blocked relief trucks waiting to be let into Gaza.’ 

Immediately after that, the Israelis accused the U.N.’s top official of ‘deceiving’ and noted, instead, that it was the U.N. that was holding up the deliveries of life-saving aid to people who are said to be on the verge of famine inside the Palestinian enclave. 

‘Since October 7th, U.N. actors and agencies have told lie after lie about Hamas atrocities and Israel’s efforts to exercise its lawful right of self-defense,’ Anne Bayefsky director of the Touro Institute on Human Rights and the Holocaust and president of Human Rights Voices, told Fox News Digital.

Over the past few weeks, as images of malnourished Gaza children appear on news and social media channels, U.N. aid agencies and Israeli authorities have been locked in a bitter battle of narratives over who is to blame for preventing the deliveries of food, water and medicine from reaching more than 2 million civilians in various parts of the Strip. 

Israeli officials say there are no limits on the amount of aid that can enter Gaza; the U.N. – and its aid agencies – maintain the opposite. They claim there are blockages caused by lengthy screening procedures and limited operating hours, particularly at the Rafah crossing, which is manned by Egypt, and have been pushing for Israel to open more entry points, especially in the north. 

‘The slow pace of allowing the trucks through at Rafah creates one of the blockages, as does the blocking of UNRWA work in the north,’ Farhan Aziz Haq, a spokesman for Guterres told Fox News Digital on Monday. He was referring to the controversial United Nations Relief and Works Agency, which services Palestinian refugees and their families in the region but which has been accused of collaborating with Hamas, a U.S.-designated terror group. 

‘Some trucks go through but not nearly enough, at a time when we will need to bring in about 300 trucks a day to avert famine,’ he said.

But Shimon Freedman, the international media spokesperson for COGAT, the Israeli military unit that coordinates between Israel and the Palestinian territories, reiterated to Fox News Digital that ‘Israel does not place any limit on the amount of aid that can enter the Gaza Strip.’ 

He said that in recent months, Israel has opened additional crossings into Gaza – including a special route to reach those trapped in the north. It has also bolstered its staff and expanded its inspection hours. 

‘We have gone to great lengths to improve our inspection capabilities so that more aid can reach the people who need it,’ he said, emphasizing that ‘right now, we can inspect 44 trucks an hour.’

‘The problem lies with the international organization’s distribution capabilities,’ Freedman added. 

Following a post on X by the secretary-general about trucks waiting at Rafah, COGAT posted a photo of aid waiting to be collected on the Gaza side of the Kerem Shalom border crossing with Israel. 

Ahed Al-Hindi, a senior fellow at the Center for Peace Communications, who has been monitoring the humanitarian situation in Gaza, said many of the Gazan activists he had spoken to recently ‘expressed concerns about how humanitarian aid from abroad is being manipulated by Hamas.’

‘They told me that Hamas distributes aid selectively to its loyalists, using it as political leverage, particularly in areas experiencing food shortages,’ he said. ‘This tactic enables Hamas to recruit supporters among families affected by the conflict – a pattern that has taken place in other war-torn regions like Syria and Libya, where radical Islamist groups exploited international aid for political gain and recruitment purposes.’

‘Israelis, unlike many Western countries, are intimately familiar with these tactics, having dealt with militant organized groups for decades,’ said Al-Hindi. ‘They understand how U.N. aid can be exploited for recruitment purposes, both during times of war and peace. 

‘Both narratives are correct,’ Shaul Bartal, a senior researcher at the Begin-Sadat Center for Strategic Studies at Bar Ilan University near Tel Aviv, told Fox News Digital. 

‘There is enough aid, but there is a difficultly in distributing it correctly because Hamas controls a significant part of this area,’ he said, adding, ‘UNRWA is not working properly because of what is happening on the ground and also because some of its workers are members of Hamas, so they are helping them.’ 

Bartal, who has also been following events in Gaza closely, also noted that across the Strip, local gangs were looting the aid to sell on the black market and aid workers, including the truck drivers, were too afraid to enter certain lawless areas. Some of the drivers, he said, had even been killed while distributing the aid. Last month, more than 100 Gazans were killed when desperate civilians stormed an aid convoy.

Bartal said that in order for the aid to be distributed correctly, a local power needed to be directly involved. 

‘There are only two local powers that are capable of effectively distributing the aid – Hamas or Israel,’ he said. ‘If Israel wanted to give the population humanitarian aid, then it could do so through the army.’

In a press briefing earlier this week, the IDF spokesman, Rear Adm. Daniel Hagari, said the army’s involvement in distributing humanitarian aid had been increasing in recent weeks, even as its troops continue to battle Hamas terrorists inside the territory. 

‘We acknowledge the suffering of the people of Gaza,’ Hagari told reporters, describing how Israel had stepped up its humanitarian efforts in recent weeks, working together with the U.S., Egypt, the United Arab Emirates, and other international organizations, most notably the World Food Program, another U.N. relief agency. 

‘There is a problem inside Gaza with the distribution because Hamas operatives are either stealing the food for their own needs and in areas it does not control there is looting,’ he said. 

‘The problem of the distribution is the responsibility of international organizations – the IDF is part of the solution,’ said Hagari. ‘We understand there is no easy solution and that is why we’re focusing on flooding the area with humanitarian aid… I encourage every international organization that has a solution for the distribution problem to work together with COGAT and with the IDF.’ 

Hagari said that over the last 10 days, more than 1,522 trucks had entered Gaza carrying food, water and medical equipment, as well as construction materials for housing and shelter – according to COGAT’s website a further 500 trucks entered on Tuesday and Wednesday. In addition, he said the IDF had opened several new roads, including in the northern part of the territory, and was currently engaged in thinking of new and creative ways to reach those in need. 

Bayefsky, whose organization, the Touro Institute on Human Rights and the Holocaust, is an accredited non-governmental organization with the UN, concluded, ‘Wild, totally unverifiable claims of numbers of dead civilians. Tall tales about aid deliveries, minus the truth about Hamas thefts and Jewish hostages starving. The list goes on and on. U.N. sources are quite simply utterly untrustworthy because U.N. actors from the secretary-general on down take their numbers, their ‘facts’ and their talking points from Hamas and the Palestinian Authority in Ramallah.’

During a press briefing on Monday, State Department spokesman Matt Miller said no assessment had been made on whether Israel was violating international humanitarian law when it comes to the provision of humanitarian assistance into Gaza.

‘That said, we do believe there is very much more that they [Israel] can do to let humanitarian assistance go in, both through Kerem Shalom and Rafah and also through the new 96 gate that opened up week before last, to allow convoys to move directly into the north without having to transit the somewhat perilous route inside Gaza,’ he said, adding there was also more Israel could do with respect to UNRWA and other U.N. agencies working to provide aid in Gaza.

This post appeared first on FOX NEWS