Archive

2024

Browsing

ALBANY, N.Y. — In all fairness, Caitlin Clark is not the only Iowa player coach Lisa Bluder has had to tee up during practice.

“I’ve gotten a technical, as well,” Kate Martin said Friday. “So she’s not alone.”

No, but the way Clark is wired — she’s been described as competitive, fiery, even a whiner — has become the subject of endless fascination as she’s rewritten college basketball’s record books and helped turn perceptions of the women’s game on their head. After the close call against West Virginia in the second round Monday night, there were suggestions even her father was telling her to calm down.

Which wasn’t the case, Clark clarified.

“I was never talking to my dad. I don’t know why people thought that,” she said Friday.

“I know people are always watching. I know eyeballs are always on me. That is kind of what happens when you are in the spotlight. And it’s not anything you shy away from,” Clark continued. “I’m competitive. I’m fiery. That’s how it is.”

And it’s not unique.

Athletes, especially the very best ones, are competitive to the Nth degree. Have you not ever seen LeBron James arguing for a call or screaming at a teammate? Did you miss Tom Brady and Novak Djokovic taking out their frustrations on inanimate objects?

Heck, Netflix did a 10-part documentary that was essentially an examination of what made Michael Jordan tick.

The best athletes have an insatiable desire to win that the rest of us will never fully comprehend. It’s what keeps them practicing while the rest of us are content to sit on the couch and eat ice cream. It’s what drives them to get the tiniest bit better while the rest of us are OK with good enough.

It’s what sets the Jordans and the LeBrons and the Bradys apart, and Clark is in that category. She knows that — and so do the people around her.

“You get into a competitive little tiff or whatever, and then in the locker room you’re just fun and loving right away again. We can have that balance,” Martin said. “It doesn’t really matter what happens out on the court.”

The increasing interest in women’s sports is appreciated and long overdue. But there are some who still seem shocked when female athletes act like, well, athletes. The pearl clutching over Clark’s on-court emotions, or Angel Reese’s taunting during last year’s national title game, is both silly and insulting.

You cannot expect female athletes to deliver the same excitement as their male counterparts and not have the same emotions. You cannot expect female athletes to compete at the highest level and also be diminutive wallflowers who don’t express themselves.

Clark, like all the best athletes, has an internal combustion engine that runs hotter than most. It’s also why she’s been as successful as she is.

“It’s being able to channel that and use it in the best way,” Clark said. “There’s always young girls with eyeballs on you, so you always want to always be on your best behavior, but also play with that competitive fire and passion that you always had that has brought our team so much success. I think that’s exactly what we do.”

Clark and her coaches have acknowledged it’s taken time to get there. That she’s had to come to understand that not everyone can do what she does. When those technicals in practice were brought up, Clark said, almost under her breath, “That hasn’t happened in a while.”

But there is a difference between being a competitor and being a jerk, and some have seen Clark being one and assumed she must then be the other, too.

“She is the one that’s cracking the jokes, she’s the one that keeps the locker room happy, fun,” Bluder said. “You don’t get to see the goofy Caitlin that we get to see and that we love.”

Just as it was for Jordan, Brady, James and every other top athlete since the beginning of time, Caitlin Clark’s competitiveness is not a character flaw. It’s her super power.

Follow USA TODAY Sports columnist Nancy Armour on social media @nrarmour.

This post appeared first on USA TODAY

On this week’s edition of StockCharts TV‘s StockCharts in Focus, Grayson explains the importance of market breadth and shares some of the most crucial charts for understanding what’s truly happening beneath the surface of the market. Using the Sample Chart Gallery, you’ll see these charts in action, understand why they are so crucial, and learn how to get them into your own account for future use.

This video originally premiered on March 29, 2024. Click on the above image to watch on our dedicated StockCharts in Focus page on StockCharts TV.

You can view all previously recorded episodes of StockCharts in Focus at this link.

Bitcoin is about to undergo its fourth halving on April 19. For crypto enthusiasts, it’s well known that this halving occurs every four years and is a critical event that can significantly alter Bitcoin’s market dynamics as it affects the coin’s supply mechanism.

How Has Bitcoin Halving Affected Price?

The following significant strides followed each price halving:

First halving in 2012 saw Bitcoin’s price rise from $12 to $900 in the years following.Second halving in 2016 saw the price climb from around $600 to $2,500 in a year.Third halving in 2020 saw prices surge from approximately $8,000 to $40,000 in less than a year.

CHART 1. MONTHLY CHART OF BITCOIN. Here you see the price action following the second and third halving. How much will price rise after the fourth halving?Chart source: StockCharts.com. For educational purposes.

Still, correlation is not causation, and these halvings might simply be reference points marking surges driven by various other factors.

But what if Bitcoin’s post-halving supply does play a significant role in its price surge? What if a decrease in supply stokes demand to the point of FOMO? Is it a good time to jump in now, or how can you time an entry?

A Strange Concept: Bitcoin Seasonality

Some cryptanalysts will argue that Bitcoin is seasonal. But while it does have seasonal data, seasonality is another matter altogether, as it implies internal supply/demand mechanisms happening consistently within a calendar year.

Still, the context is something you might want to be aware of in your attempt to time an entry.

CHART 2. BITCOIN’S 10-YEAR SEASONAL PERFORMANCE. Most of the months have exhibited strength in returns and higher closes (mainly because Bitcoin has constantly been subject to hype and FOMO).

Chart source: StockCharts.com. For educational purposes.

Using StockCharts’ Seasonality tool, Bitcoin’s 10-year seasonal performance shows that October and February tend to be its strongest months, with a higher-close rate near or at 90% and an average return rate of 24% (October) and 14.4% (February).

But the combination of April, May, and June, three consecutive months, also presents an appealing opportunity. How does Bitcoin’s 10-year seasonal performance compare with the S&P 500?

CHART 3. 10-YEAR PERFORMANCE OF BITCOIN AGAINST THE S&P 500. Note how October and February remain the most vital months compared to the broader market.Chart source: StockCharts.com. For educational purposes.

Like the chart above, October and February are Bitcoin’s strongest months. While April through July are relatively strong, April stands out as the strongest among the months in Spring.

How to Access the Seasonality Tool

There are different ways to access the seasonality tool in StockCharts.

Click the Charts & Tools tab at the top of the StockCharts page, enter a symbol in the Seasonality panel, and click Go. Enter the symbol in the ChartBar at the top of the page and select “Seasonality” from the dropdown menu on the left.From Your Dashboard, in Member Tools, click on Seasonality.Below the seasonality chart, you’ll find links to instructions and quick tips that give more detailed instructions.

So, what does the price action look like today? Let’s turn to the daily chart of Bitcoin to US dollar.

CHART 4. DAILY CHART OF BITCOIN. Note the decrease in momentum and the potential support levels serving as possible entry points for those looking to go long.

Chart source: StockCharts.com. For educational purposes.

Note Bitcoin’s five-day sell-off from March 14 to 19. Perhaps in light of the April halving event, Bitcoin bulls jumped in as prices approached the most recent swing low of just below $60,000. This level also coincides with the 38.2% Fibonacci Retracement drawn from the January 2024 low of $38,512 to the March high of $73,802.

However, note that the bounce lacks momentum, as the Money Flow Index (MFI) and the Chaikin Money Flow (CMF) signal a rapid decrease in buying pressure. However, the MFI is nowhere near “oversold” territory, and the CMF is still above the zero line, which is a bullish sign that buyers still have the technical advantage.

Even if the present rally falters, Bitcoin’s uptrend will remain viable. If a decline as painful as the $56,000 range occurs, the uptrend would remain intact. The Kumo (Ichimoku Cloud) has also been plotted to confirm this “support level” thesis. Notice how the price bounced off the Kumo back in January. The current price action gives a wider range of support-level expectations.

The Bottom Line

While the fourth halving event on April 19 will likely stir up some FOMO, watch the current swing to see whether it continues or pulls back. The coming months are seasonally strong, but seasonality may play second fiddle to the halving event. If it does pull back, you can see the levels where Bitcoin is likely to bounce, serving as a strategic entry point for those looking to go long.

Disclaimer: This blog is for educational purposes only and should not be construed as financial advice. The ideas and strategies should never be used without first assessing your personal and financial situation or consulting a financial professional.

In this edition of StockCharts TV‘s The Final Bar, Dave presents a mailbag show discussing key technical analysis topics. He covers breakouts, the role of TSX, CCI signals, Gartner Group (IT) strategies, seasonal patterns, ATR use, NVDA Fibonacci retracements, and managing high-yield stocks like GLP. You don’t want to miss this episode!

This video originally premiered on March 29, 2024. Watch on our dedicated Final Bar page on StockCharts TV!

New episodes of The Final Bar premiere every weekday afternoon. You can view all previously recorded episodes at this link.

This article represents an exercise I like to call the “Single Stock Portfolio”. In this scenario, you can only own one stock in your portfolio for the next three months, and you can pick any one of the following eight stocks. Which one would you select, and why?

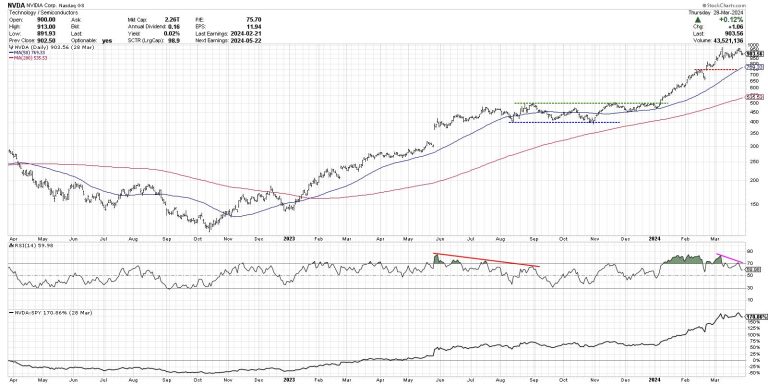
The beauty of this exercise is that it forces you to consider eight different charts, some with similar characteristics, yet some showing dramatic differences. In the end, you have to decide whether to stick with a top-performing name like NVDA, fresh off new all-time highs in March but showing the dreaded bearish momentum divergence, or you could opt for AAPL, testing price and Fibonacci support after failing to make new all-time highs.

Let’s review each of these charts in turn and lay out a good technical framework for our decision.

Nvidia Corp. (NVDA)

Nvidia is the top-ranked of the group using the StockCharts Technical Rating (SCTR), with its trend scoring in the top 2% of all large cap stocks. NVDA also features a bearish momentum divergence, with higher closing prices in March but lower highs in momentum based on the RSI indicator. This stock currently sits around 69% above its 200-day moving average, suggesting it could be quite overextended here.

Meta Platforms, Inc. (META)

META is featuring weakening momentum characteristics as well, with RSI dipping below 50 this week for the first time since December 2023. Both of these stocks still remain above two upward-sloping moving averages, suggesting the long-term uptrend is very much intact.

Netflix, Inc. (NFLX)

Our third chart again demonstrates a classic bearish momentum divergence, with highs in January, February, and March all marked by lower peaks in the RSI. This suggests less and less upward momentum behind these successive new highs. The relative strength, however, remains quite strong, as NFLX has consistently outperformed the S&P 500.

Amazon.com, Inc. (AMZN)

Here, we have the first chart that actually made a new 52-week high to finish this shortened holiday week. AMZN has perhaps the most consistent uptrend, with a stepwise motion of higher highs and higher lows since the October 2023 low. The RSI remains strong but not excessive, indicating that further upside potential is very much a possibility.

Microsoft Corp. (MSFT)

We’re now at five straight charts with a bearish momentum divergence. Can you see why I’ve been skeptical of further upside for the Nasdaq 100, given these persistent signs of weakening momentum? Despite the downward-sloping RSI, MSFT remains firmly trending up above an upward-sloping 50-day moving average, which served as short-term support in January and March.

Alphabet Inc. (GOOGL)

Here is where we start to see some differentiation between these leading growth names. Alphabet gapped higher in mid-March, and has seen additional upside since that price gap. Now we are observing a retest of all-time highs around $154. Will this second attempt to breakout above the $155 actually succeed? GOOGL has broken its 50-day moving average in 2024, and actually tested the 200-day in early March before bouncing higher.

Apple, Inc. (AAPL)

With AAPL, we’re now getting to the weakest of the group in terms of their 2024 performance. Apple scores a 9.1 in the large cap SCTR rankings, meaning it’s in the bottom 10% of US large cap stocks as ranked by their trends. This chart is currently testing price and Fibonacci support, and a break below this key support could open the door to further downside for AAPL.

Tesla Inc. (TSLA)

If you’re looking for classic example of a stock in a confirmed downtrend, look no further than TSLA. Here we can observe lower highs and lower lows, price below two downward-sloping moving averages, and RSI consistently below the 50 level. TSLA even broke below Fibonacci support earlier in March. A vote for Tesla would be an optimistic leap of faith on a name that certainly has not impressed in Q1.

There are your eight stocks, with a brief technical analysis summary of each chart. Which stock do you see as the best opportunity in Q2, and why? Watch the video below, then drop a comment with your vote and your reasoning!

RR#6,

Dave

P.S. Ready to upgrade your investment process? Check out my free behavioral investing course!

David Keller, CMT

Chief Market Strategist

StockCharts.com

Disclaimer: This blog is for educational purposes only and should not be construed as financial advice. The ideas and strategies should never be used without first assessing your own personal and financial situation, or without consulting a financial professional.

The author does not have a position in mentioned securities at the time of publication. Any opinions expressed herein are solely those of the author and do not in any way represent the views or opinions of any other person or entity.

In this episode of StockCharts TV‘s The MEM Edge, Mary Ellen reviews what’s shaping up in the broader markets after the Fed announced their rate cut plans. She also shares how to use ETFs to shape your investment decisions for the longer term. In addition, Mary Ellen also reveals how to uncover downtrend reversals.

This video originally premiered March 29, 2024. Click here or on the above image to watch on our dedicated MEM Edge page on StockCharts TV.

New episodes of The MEM Edge premiere weekly on Fridays. You can view all previously recorded episodes at this link.

If you’re looking for stocks to invest in, be sure to check out the MEM Edge Report! This report gives you detailed information on the top sectors, industries and stocks so you can make informed investment decisions.

The Fed’s preferred gauge of inflation was released today and, according to Fed chief Jerome Powell, “it was good,” as there were no ugly surprises. This news could boost the markets, as sticky inflation data has had investors on edge amid interest rates that have remained relatively high. The stock and bond markets were of course closed today, however, so we won’t see a response from traders until next week.

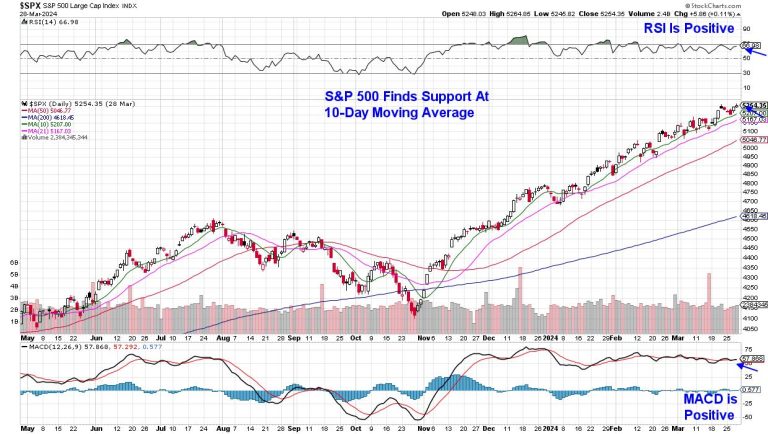
Overall, we’re heading into next week on good terms, with the Dow, Nasdaq and the S&P 500 at new highs with small-cap stocks in an uptrend after posting an impressive 2.5%. In other positive news, we’re continuing to see a broadening out of participation well beyond the Magnificent Seven stocks which dominated last year’s top performance lists.

Daily Chart of S&P 500 Index

With so much bullish behavior, it may be difficult to determine where to focus your efforts so that you can outperform these strong markets. From my work, honing in on companies that have strong growth outlooks will always pay off, particularly during a bull market phase such as now.

Many of these faster-growing companies — particularly in Technology — have seen impressive returns year-to-date already, with consolidation phases needed before another leg up. Instead, I’m looking for stocks in areas such as Healthcare, which have entered a new uptrend after trending sideways over the past 3 weeks. While normally viewed as a defensive area of the markets, there’s plenty of fast-growing companies amid the development of new drugs and medical products.

Daily Chart of Healthcare Sector (XLV)

A prime example is Eli Lilly (LLY) which was added to my MEM Edge Report’s suggested holdings list in early January. In addition to the company’s popular weight loss drug Zepbound, which was approved late last year, The company is on track to see their Alzheimer’s drug approved next quarter.

LLY has been trending upward in a tight trading range in anticipation of this FDA approval, and this recent period of consolidation has allowed the stock to recover from an overbought condition during February. A close above its recent high of $800, coupled with a bullish MACD crossover, would put the stock into a strong buy zone.

Daily Chart of Eli Lilly (LLY)

Other newer areas are also beginning to emerge, and if you’d like to be alerted to new buy ideas in these areas, use this link here to trial my twice weekly MEM Edge report. You’ll also receive in-depth information regarding broader market conditions as well as sector rotation that’s taking place and why. I hope you’ll take advantage of this offer!

Warmly,

Mary Ellen McGonagle

MEM Investment Research

The Social Security Administration has issued a final rule that will prevent food assistance from reducing payments to certain beneficiaries.

The change applies to Supplemental Security Income, or SSI, which provides monthly checks to adults and children who are disabled, blind or age 65 and older, and have little or no income or resources.

Approximately 7.4 million Americans receive support either exclusively from SSI or in combination with Social Security.

Under the new rule, which goes into effect Sept. 30, food will no longer count toward calculations for eligibility for benefits, known as In-Kind Support and Maintenance, or ISM.

Currently, support in the form of food, shelter or both may count as unearned income for SSI beneficiaries, and therefore reduce their payments or affect their eligibility for benefits.

The monthly maximum federal SSI amounts in 2024 are $943 for individuals, $1,415 for couples and $472 for essential persons, or those who live with an SSI beneficiary and provide care.

To qualify for SSI, beneficiaries must generally earn less than $1,971 per month from work. They must also have less than $2,000 in resources per individual, or $3,000 per couple.

That generally includes either money or other assets that can be turned into cash, such as bank accounts, bonds, property and stocks.

The new rule means SSI beneficiaries will no longer have to worry that the groceries or meals they receive from family or friends may reduce their monthly benefits, said Darcy Milburn, director of Social Security and health care policy at The Arc, a nonprofit organization serving people with developmental and intellectual disabilities.

The Social Security Administration, in turn, will no longer have to use its limited resources to document every time a beneficiary received free food and then cut their monthly benefit by as much as a third, she said.

“It represents a really meaningful step to address one of the most complex, burdensome and inhumane policies impacting people with disabilities that receive SSI,” Milburn said.

The change is the first of several updates the Social Security Administration said it plans to put in place for SSI beneficiaries and applicants.

“Simplifying our policies is a common-sense solution that reduces the burden on the public and agency staff and helps promote equity by removing barriers to accessing payments,” Social Security Commissioner Martin O’Malley said in a statement.

The new rule may help provide some relief to SSI beneficiaries as high inflation continues to prompt higher food and grocery bills for all Americans.

“People on SSI are one of the most food insecure groups in the United States,” said Thomas Foley, executive director at the National Disability Institute.

The new rule may also result in fewer overpayments or underpayments of benefits, and therefore increase financial security for beneficiaries, he said.

Congress may have the opportunity to enact bigger changes to SSI through a bipartisan bill that would raise the asset limits for beneficiaries to $10,000 for individuals, up from $2,000, and to $20,000 for married couples, up from $3,000.

“Disability affects everybody, so it’s a bipartisan issue,” Foley said.

“Restricting asset limits to the $2,000 level really impacts people’s ability to save and build a better financial future,” he said.

In December, bank CEOs including JPMorgan Chase CEO Jamie Dimon testified before the Senate that they are in favor of updating SSI’s rules.

“We have employees who don’t want us to increase their salary because if it goes over a certain amount, they can’t get that benefit which they’re entitled to,” Dimon said in December.

“This definitely should be fixed,” he said.

This post appeared first on NBC NEWS

Allies of Florida Gov. Ron DeSantis and Disney reached a settlement agreement Wednesday in a lawsuit over who controls Walt Disney World’s governing district.

In a meeting, the members of the board of the Central Florida Tourism Oversight District approved the settlement agreement, ending almost two years of litigation that was sparked by DeSantis’ takeover of the district from Disney supporters following the company’s opposition to Florida’s so-called “Don’t Say Gay” law.

The Magic Kingdom at Walt Disney World.John Raoux / AP file

The 2022 law bans classroom lessons on sexual orientation and gender identity in early grades and was championed by DeSantis, who used Disney as a punching bag in speeches until he suspended his presidential campaign this year.

As punishment for Disney’s opposition, DeSantis took over the governing district through legislation passed by the Republican-controlled Florida Legislature and appointed a new board of supervisors. Disney sued DeSantis and his appointees, claiming the company’s free speech rights were violated for speaking out against the legislation. A federal judge dismissed that lawsuit in January.

Before control of the district changed hands from Disney allies to DeSantis appointees early last year, the Disney supporters on its board signed agreements with Disney shifting control over design and construction at Disney World to the company. The new DeSantis appointees claimed the “eleventh-hour deals” neutered their powers and the district sued the company in state court in Orlando to have the contracts voided.

Disney filed counterclaims that include asking the state court to declare the agreements valid and enforceable.

This post appeared first on NBC NEWS

The Social Security Administration has issued a final rule that will prevent food assistance from reducing payments to certain beneficiaries.

The change applies to Supplemental Security Income, or SSI, which provides monthly checks to adults and children who are disabled, blind or age 65 and older, and have little or no income or resources.

Approximately 7.4 million Americans receive support either exclusively from SSI or in combination with Social Security.

Under the new rule, which goes into effect Sept. 30, food will no longer count toward calculations for eligibility for benefits, known as In-Kind Support and Maintenance, or ISM.

Currently, support in the form of food, shelter or both may count as unearned income for SSI beneficiaries, and therefore reduce their payments or affect their eligibility for benefits.

The monthly maximum federal SSI amounts in 2024 are $943 for individuals, $1,415 for couples and $472 for essential persons, or those who live with an SSI beneficiary and provide care.

To qualify for SSI, beneficiaries must generally earn less than $1,971 per month from work. They must also have less than $2,000 in resources per individual, or $3,000 per couple.

That generally includes either money or other assets that can be turned into cash, such as bank accounts, bonds, property and stocks.

The new rule means SSI beneficiaries will no longer have to worry that the groceries or meals they receive from family or friends may reduce their monthly benefits, said Darcy Milburn, director of Social Security and health care policy at The Arc, a nonprofit organization serving people with developmental and intellectual disabilities.

The Social Security Administration, in turn, will no longer have to use its limited resources to document every time a beneficiary received free food and then cut their monthly benefit by as much as a third, she said.

“It represents a really meaningful step to address one of the most complex, burdensome and inhumane policies impacting people with disabilities that receive SSI,” Milburn said.

The change is the first of several updates the Social Security Administration said it plans to put in place for SSI beneficiaries and applicants.

“Simplifying our policies is a common-sense solution that reduces the burden on the public and agency staff and helps promote equity by removing barriers to accessing payments,” Social Security Commissioner Martin O’Malley said in a statement.

The new rule may help provide some relief to SSI beneficiaries as high inflation continues to prompt higher food and grocery bills for all Americans.

“People on SSI are one of the most food insecure groups in the United States,” said Thomas Foley, executive director at the National Disability Institute.

The new rule may also result in fewer overpayments or underpayments of benefits, and therefore increase financial security for beneficiaries, he said.

Congress may have the opportunity to enact bigger changes to SSI through a bipartisan bill that would raise the asset limits for beneficiaries to $10,000 for individuals, up from $2,000, and to $20,000 for married couples, up from $3,000.

“Disability affects everybody, so it’s a bipartisan issue,” Foley said.

“Restricting asset limits to the $2,000 level really impacts people’s ability to save and build a better financial future,” he said.

In December, bank CEOs including JPMorgan Chase CEO Jamie Dimon testified before the Senate that they are in favor of updating SSI’s rules.

“We have employees who don’t want us to increase their salary because if it goes over a certain amount, they can’t get that benefit which they’re entitled to,” Dimon said in December.

“This definitely should be fixed,” he said.

This post appeared first on NBC NEWS