Archive

2023

Browsing

A lawsuit from civil rights organizations accusing private prisons in Arizona of practicing slavery is now before the Ninth Circuit Court of Appeals amid a broad left-wing pushback against the use of private prisons and immigrant detention centers.

The lawsuit, led by the NAACP, was initially filed in 2020 against the Arizona Department of Corrections, arguing the state is violating the Eighth Amendment’s ban on cruel and unusual punishment and the 13th Amendment’s prohibition of slavery.

The suit argues the use by the state of private prisons involves ‘substituting a prisoner-corporation relationship for a state-prisoner relationship by relegating prisoners to the status of human inventory and making prisoners slaves to the private prison corporations; attenuating government protection, oversight, safety, and wellbeing of prisoners within the private prisons; and creating financial incentives to design and operate facilities that incarcerate more people for longer periods of time.’

The state argued that the lawsuit is mounting a ‘general attack on the use of private prisons and relies on speculation that private operators may engage in unconstitutional conduct or have engaged in such conduct in non-ADCRR-contracted facilities in the past and that they may be harmed if the operators behave as they have alleged.’

Arizona Central reported at that time that about 8,000 inmates of an overall population of around 40,000 were incarcerated in private jails. A federal court dismissed the lawsuit, and an appeal is now before the traditionally liberal Ninth Circuit. The plaintiffs hope the case reaches the Supreme Court.

A number of briefs have been filed in favor and against the lawsuit. On the plaintiff’s side, briefs filed by left-wing and civil rights groups argue that the reintroduction of private prisons is a callback to racist practices from the 19th century and that such prisons have greater racial disparities and worse conditions. 

‘Today, attempts to evade the Thirteenth Amendment’s prohibition against slavery are being tested again using private, for-profit corporations who bid for, buy and sell, and extort prison labor from U.S. citizen prisoners, many of whom are African American,’ a brief by the professors and graduates of the University of Arkansas Little Rock states.

An amicus brief filed by Latino Justice noted some private facilities are used to house immigrants and claimed the centers include ‘glaring racial disparities.’

‘These centers overwhelmingly detain Black and Latino people who have not been accused of any crime, but are instead held for alleged violations of civil immigration law,’ it says.

The brief also notes that the Biden administration has pledged to shut down a number of private immigration detention centers. The administration has been aiming to rely on Alternatives to Detention, and the number of immigrants in custody across the U.S. remains low. 

California banned for-profit prisons in 2019, including for-profit immigration detention centers.

A separate brief by the Florence Immigrant & Refugee Rights Center argues the system is exacerbated by detention quotas that undermine due process for those in custody.

‘The same companies profiting from the mass incarceration system have capitalized on the mass detention of immigrants, leading some scholars to compare incarceration of Black men in the ‘new Jim Crow’ with the increased use of for-profit detention to hold immigrants, many of whom are Latinx,’ the brief says.

Other groups have pushed back in support of Arizona. The Day 1 Alliance, which emphasizes the importance of the private sector in American life, argues that the private sector operation of prisons is beneficial for the inmates and society in general.

They argue the use of private sector prisons is subject to multiple levels of oversight, often embedded in their government contracts, and reject the idea that contractors will cut corners to pursue greater profits. It also notes the use of substance counseling and educational and vocational programs to help reduce recidivism rates.

‘Private sector contractors are able to maintain lower costs because their size and experience enable them to take advantage of economies of scale in their purchasing power for such essentials as clothing, food, health care services, hygiene items and various other services and supplies,’ they say.

They also argue that the language of Arizona’s statutes, which say a proposal for a contract cannot be accepted until it offers cost savings, results in a ‘detailed statutory scheme (that) mandates cost savings while maintaining service quality, which benefits the taxpayer while causing no detriment to incarcerated individuals.’

‘The required cost savings that are realized through utilizing private sector contractors are designed to combat the enormous strain placed on government budgets by increases in the number of incarcerated individuals,’ the alliance argues.

It cited data that contractor-operation facilities cost $64.65 per inmate per day compared to $80.20 per day for their public counterparts. 

The brief accuses the plaintiffs of ‘hurling baseless insults at these private sector contractors, filled with hyperbole and fictitious assertions that are devoid of factual validity.’ 

‘The reality is that the efforts of these private sector contractors should be lauded and replicated, including their goal of improving the lives of the inmates who cross the thresholds of the facilities that they operate,’ they say.

The case comes as Gov. Katie Hobbs on Wednesday announced the creation of a commission to study problems in Arizona’s prisons, including staffing levels and the health care offered to those behind bars.

The creation of the commission by Hobbs, Arizona’s first Democratic governor since 2009, came several days after she ordered a separate review of the state’s death penalty protocols. 

‘We cannot deny there is an urgent need to provide transparency and accountability in Arizona corrections system,’ Hobbs said.

The Associated Press contributed to this report.
 

This post appeared first on FOX NEWS

South Dakota Gov. Kristi Noem has yet to make herself available to the Capitol press during the first three weeks of the state’s legislative session, breaking with a decades-old ritual of South Dakota governors holding a weekly news conference to publicly discuss their policy initiatives and take questions from reporters.

The Republican governor, who is a potential 2024 White House contender, has granted numerous TV interviews to national outlets. But in her home state Capitol, where she is proposing a historic tax repeal, new rules for foreign entities purchasing farmland and a batch of bills aimed at aiding new parents, she has not personally taken questions from reporters.

Noem’s retreat from a forum that allows her to face public scrutiny — as well as make a case for her proposals — comes after a campaign season in which candidates nationwide skipped out on debates. The practice deprives the public of a chance to hear politicians respond to questions they may not want to answer. Many officials, such as Noem, have instead made their public case on social media, where they can control their message.

Noem’s spokesman, Ian Fury, declined to say whether she will hold any news conferences this year but said they would be announced in advance. He did not respond to a request for comment on why she has not held any this year.

The governor’s weekly news conferences have been occurring for decades during the state’s 40-day legislative session, said Kevin Woster, a journalist who has covered South Dakota since the late 1970s. And some former governors, such as the bombastic Bill Janklow, seemed to relish the opportunity to spar with the press over the legislative debates of the day, he said.

‘The governor and her office are right in the middle of (the legislative session) and should be talking about it,’ Woster said, adding, ‘It’s a denial of something that the public certainly deserves.’

Traditionally, South Dakota’s Democratic and Republican legislative leaders have held half-hour news conferences on the week’s final day when the Legislature is in session. They usually discuss their priorities — and sometimes exchange a few digs at each other — before answering questions from reporters. Then, the governor gets her turn.

While both Republican and Democratic lawmakers have continued the practice this year, Noem has not. She also did not attend a meeting this week with the state’s top newspaper editors — an annual gathering she attended in years past. The editors, who drove hours from around the mostly rural state, did gain audiences with Republican and Democratic legislative leaders.

Michael Card, a retired Republican political strategist and political science professor, said that skipping direct interactions with the press is a missed opportunity for the governor to explain her agenda and creates an information vacuum that leaves room for speculation.

‘It is not a good thing for our democracy,’ he said.

This post appeared first on FOX NEWS

North Dakota landowners testified for and against a carbon capture company’s use of eminent domain Friday, as Summit Carbon Solutions moves forward in constructing a massive underground system of carbon dioxide pipelines spanning 2,000 miles across several states and under hundreds of people’s homes and farms in the Midwest.

The proposed $4.5 billion carbon pipeline project would capture carbon dioxide emissions across neighboring states and deposit the emissions deep underground in North Dakota.

Landowners who opposed the company’s right to eminent domain argued that a private entity should not be able to forcibly buy their land and that the pipeline will potentially endanger people living above it.

Eminent domain refers to the government’s right to forcibly buy private property — like the land under a person’s house or farm — for public use.

Landowners who supported Summit’s right to exercise eminent domain said the company’s timely construction of the carbon pipeline serves an important public interest — it would reduce the state’s carbon footprint and thereby allow North Dakotans to continue working in energy and agriculture — and that people living above the pipeline will be safe.

‘The safety of our operations, our employees, and the communities where we operate is the foundation of Summit Carbon Solutions’ business,’ Summit said on its website. ‘As the project is constructed, we will utilize the latest and most reliable technologies and materials.’

The Senate Energy and Natural Resources committee did not immediately vote on the bills heard Thursday and Friday about carbon pipelines and eminent domain.

Republican Sen. Jeffery Magrum, of Hazelton, said he introduced the bills because he has heard from ‘many landowners’ that carbon pipeline developers are threatening the use of eminent domain as a way to negotiate for property rights and access.

‘We need to support property rights and our land owners as we develop our natural resources,’ Magrum said.

The bill heard Friday would prohibit carbon pipeline companies from exercising eminent domain, but would allow oil, gas and coal companies to continue using eminent domain.

‘The proposed carbon dioxide pipeline would move a dangerous product through our community to a location where it cannot be used for any purpose, but instead must be injected underground and sequestered forever,’ said Gaylen Dewing, who has worked as a farmer and rancher near Bismarck for over 50 years.

Dewing added that the state’s energy industry ‘would not benefit in any way’ from this practice of storing carbon dioxide underground, so carbon pipeline companies should not have the right to exercise eminent domain.

Susan Doppler, a landowner in Burleigh County, said her family does not want ‘our land ripped up — toxic and useless — to give way to a hazardous pipeline. What a worthless and disgusting inheritance to leave a future generation.’

But other North Dakota landowners pushed back.

Keith Kessler, a farmer and rancher in Oliver County who owns land within the boundaries of the pipeline project, said a different pipeline has been transporting carbon for over 20 years between North Dakota and Canada. That pipeline has never had a rupture or leak, and hazardous incidents from carbon pipelines are rare, he said.

And Lori Flemmer, a resident of Mercer County, said her husband and sons work in the energy industry and on their family farm. Working in agriculture and energy is ‘reality in coal country,’ she said, and carbon capture technology is necessary for reducing carbon footprints and keeping coal plants alive.

Summit Carbon Solutions’ Executive Vice President Wade Boeshans said the company must keep its ability to use eminent domain in order to build carbon pipelines in a timely fashion, deliver on the $4.5 billion pipeline project and keep North Dakota’s economy afloat. According to the company’s website, the project would span Iowa, Minnesota, North Dakota, South Dakota and Nebraska.

Republican Gov. Doug Burgum lauded North Dakota’s efforts to store carbon dioxide in January.

‘We’re on our way toward achieving carbon neutrality as a state by 2030, thanks to our extraordinary capacity to safely store over 252 billion tons of CO2, or 50 years of the nation’s CO2 output,’ Burgum said. ‘And in the process, we can help secure the future of our state’s two largest industries: energy and agriculture.’

The Trump administration in 2018 gave North Dakota the power to regulate underground wells used for long-term storage of waste carbon dioxide. North Dakota was the first state to be given such power, the Environmental Protection Agency said in announcing the move. The state has since invested heavily in carbon capture and sequestration technology.

This post appeared first on FOX NEWS

New York state should pay former Gov. Andrew Cuomo’s legal bills as he defends himself against a lawsuit accusing him of sexually harassing a state trooper, a judge ruled Friday.

Cuomo, who resigned in 2021 amid sexual harassment allegations, filed a lawsuit against Attorney General Letitia James in August arguing that she violated state law by denying him public assistance for his defense. Cuomo said the trooper’s allegations stem from a time when ‘he was acting within the scope of his employment or duties.’

The unidentified trooper filed a lawsuit last year, asking a federal court to find that Cuomo and others violated her civil rights. She was on Cuomo’s security detail and had told investigators he allegedly subjected her to sexual remarks and on occasion ran his hand or fingers across her stomach and her back. The suit seeks damages for ‘severe mental anguish and emotional distress.’

Manhattan Supreme Court Justice Shlomo Hagler noted that Cuomo has denied the allegations. The judge said it’s for a judge or jury to determine if Cuomo sexually harassed the state trooper, and that his state-funded defense can’t be denied, according to the New York Post.

‘From the very beginning, every action Tish James has taken concerning Governor Cuomo has amounted to a politicized abuse of power and every time one of them goes before a court of law, it unravels,’ Cuomo spokesman Rich Azzopardi said in a prepared statement.

A spokesperson for the attorney general said in a prepared release that ‘while we disagree with the judge’s decision, we respect it. We are reviewing the decision and any potential next steps.’

Cuomo resigned in August of 2021 after numerous women accused him of sexual harassment, saying he had subjected them to unwanted kisses or touches, made insinuating remarks about their looks and sex lives or created a hostile work environment.

This post appeared first on FOX NEWS

In this episode of StockCharts TV‘s The MEM Edge, Mary Ellen reviews the outperformance in Growth stocks and which areas are poised to trade higher. She also highlights the key driver of these and other stocks which are on the move.

This video was originally broadcast on January 27, 2023. Click on the above image to watch on our dedicated MEM Edge page on StockCharts TV, or click this link to watch on YouTube. You can also watch on our on-demand website, StockChartsTV.com, using this link.

New episodes of The MEM Edge air Fridays at 5pm PT on StockCharts TV. You can view all previously recorded episodes at this link. You can also receive a 4-week free trial of her MEM Edge Report by clicking the image below.

It has been a successful month on many fronts as we started buying aggressively on January 9th. But I made some strategic errors that were really costly. There is always another train at the station, so learning to not make these mistakes again is the only value in a losing trade. I think it is good to share, as the market always keeps us humble. Learning from my mistakes is a constantly evolving process. This week was only one week in a lifetime, but it’s hard to adjust in real time.

My analysis of the big run starting in early January was very accurate, and once I had positions on, I just needed to wait.

Here are two examples of stopping myself out literally on the lows of the day.

Tesla

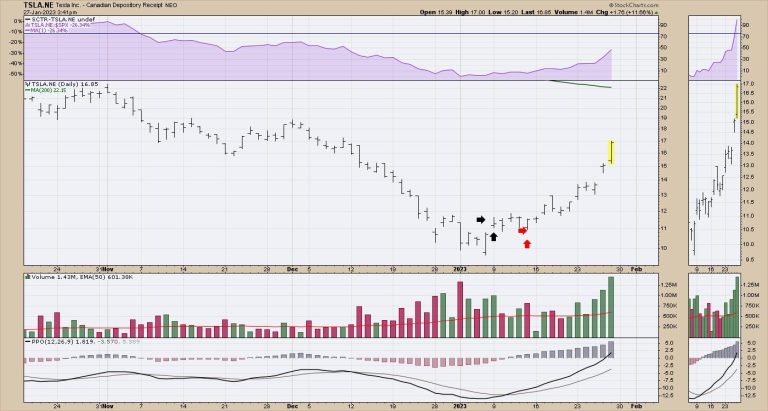
The first is Tesla. This is a Canadian ADR to trade Tesla in Canadian dollars. Chart shape is almost the same as the US chart.

Day 1: I bought Tesla at the black arrows. It closed below my entry, a small loss.

Day 2: I was in a loss position most of the day, as the other stocks I bought on Monday trades started to work.

Day 3: Tesla pushed higher and made a doji.

Day 4: Thursday opened higher, tested lower, but closed near the open.

Friday, Tesla announced price cuts, the stock dropped 4% on the open, and I was back in a loss position again, while other stocks were screaming higher. They announced they were cutting prices on their cars. My impatience wore thin. I sold Tesla within 2 cents of the low on the day and the stock rocketed higher.

A tough trade as the stock is now up 50% from my entry. I can only blame myself, but it was a difficult trade to watch for the last two weeks.

AMD – Advanced Micro Devices

The second trade I took after I sold Tesla was AMD.

Day 1: I bought it on the following Monday, as the stock made a new high, and the stock closed flat on my entry.

Day 2 was an outside bar, and price closed back in the middle of the range.

Day 3 the stock tested higher, closed lower on the lows of the day.

Day 4, the stock gapped down to start the day, I was down 6%, I sold at the red arrows at the low of the day.

Meanwhile other trades I had were racing higher. Tough looking in the rear view mirror, but trading yesterday’s chart is always more informative when you know the outcome.

Lessons learned:

TSLA: I had no reason to exit, other than I was tired of watching the stock sit in the red as other trades were racing higher. How much time is enough? Good question, one week? As the market went higher, I expected a big name stock to move. Patience.

AMD: The stock hit my stop loss, even as all my indicators were telling me to be long this market. NVDA was shooting higher, and I was losing money in AMD. I sold on the 4-day low. When you use stops, you are going to get kicked out of good trades. That’s just a fact. It stung that it was the second trade to go negative early in the rally. I would like to think it was discipline, but I need to be more forgiving as an uptrend is starting as the volatility is still high.

One positive: The strength indexes we use at ospreystrategic.org helpe me be long the market in a timely fashion.

Unfortunately, my management of the trades could have been better in both cases if I had another day of patience. I don’t use hard stops, as I have been whipsawed like the folks that had the wild swings on the NYSE recently.

There is always another train, and I am moving on. But the sting of missing the big swing, ouch.

Hopefully, this lesson can help a few others, but there are two more for my notebook. I have more lessons since those trades as well. The market will always keep us humble at some point.

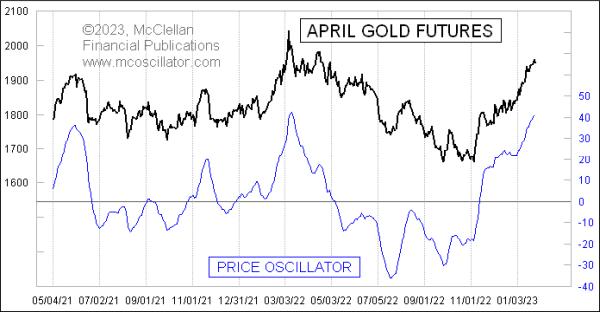
The McClellan Price Oscillator for gold futures prices has reached a pretty high level, equivalent to what it did at the price top in March 2022, and has just now turned down. This is a bearish signal and could set off a pretty big pullback.

The McClellan Price Oscillator is a cousin of the more famous McClellan A-D Oscillator. My parents created both of these back in 1969. That research grew out of their desire to get a better signal than could be gotten from looking just at moving averages alone. Together, they wondered about finding the difference between two moving averages, and this was well ahead of when Gerald Appel did the same thing with his Moving Average Convergence-Divergence (MACD) indicator.

A McClellan Price Oscillator employs prices for any stock, index, commodity, or futures price series. One calculates two exponential moving averages (EMAs), known as the 10% Trend and 5% Trend. Those percentage numbers refer to the “smoothing constant” used in the calculation of each EMA. The smoothing constant governs how much weight is given to the most recent data, so, for calculating a 10% Trend, you would multiply today’s closing price by 10%, and then add that to 90% of yesterday’s 10% Trend value. A larger smoothing constant means a faster response to price movements.

The chart below shows the 10% Trend (red) and 5% Trend (green) for the April gold futures contract. The fact that they have become spread far apart is another way of saying that the Price Oscillator has risen to a high value, because the Price Oscillator represents the distance between those two EMAs.

This chart also shows an additional line, the blue Price Oscillator Unchanged line. It represents the theoretical closing price at which a close on the next day would mean that the Price Oscillator stays at exactly the same value as the day before. It is calculated simply as the 10% Trend plus the value of the Price Oscillator. In other words, the blue line is the same distance away from the red line as the distance that the green line is separated from the red line. I like to use the Price Oscillator Unchanged level as a trigger level, especially when we see a very extended Price Oscillator value. But it does not work every time that a drop below that blue line ends up being a good sell signal. It matters more with an overbought condition.

Because the 10% Trend and 5% Trend are tied to price levels, the amplitudes of the Price Oscillator are also going to be sensitive to price levels. Saying it another way, the higher the price goes, the bigger the swings we will see on the Price Oscillator. That does not matter much for short term analyses, but, when one wants to do a long-term comparison, it can matter a lot.

One way to compensate for that is what we call the Proportional Price Oscillator, or PPO. It is shown in this next chart:

It is calculated by taking the value of the Price Oscillator, and dividing it by the closing price, which factors out the change in price levels over time. For this chart, I go one additional step, multiplying the PPO by 1000 just to make the Y-axis values more meaningful.

What we can see from this long-term chart is that the current value of the PPO is not the highest ever, but it is still up pretty high, which merits a significant pullback in gold prices just to unstretch the rubber band and set up for the next potential up move. Such pullbacks usually continue until the Price Oscillator (and thus the PPO) gets down close to zero, or even below it.

In this week’s episode of Sector Spotlight, I looked at market breadth using two different variations of Relative Rotation Graphs. Following that show,, I received an email from a user reminding me of another set of market breadth indices that we keep for sectors. The BullishPercent indices.

You can find all tickers for which we calculate these numbers here. These indices count the number of stocks in an index that is on a P&F buy signal and convert them to a percentage for comparison.

Be Careful With Range Bound Metrics

As a side note, these data sets have the same “problem” as the percentage of stocks above their n-day EMA. When they stay at an elevated or depressed value for a more extended period, the momentum will falter and go to zero, and eventually,, so will the “trend.” Something that remains at 90 or 100 for an extended period will be a flat line that will not be picked up as a “trend.”

So whenever you use these types of data sets on RRGs, please keep that in mind. They are, however, very good at picking up the start of a move as they will very rapidly move up or down from these extreme levels, backed by solid momentum up or down.

With that in mind these type of universe plotted on a Relative Rotation Graph can help you pick up moves in their early stages.

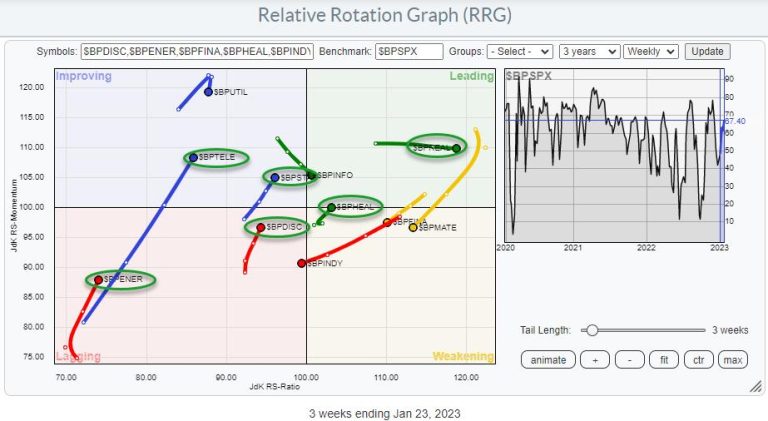
The RRG at the top of the article shows the RRG using the BullishPercent values for the 11 S&P sectors while using the same metric for the entire S&P 500 as the benchmark.

Aligning BullishPercent Tails and Price Based Tails

On this RRG there are six sectors showing a tail that is at a positive RRG-Heading. They are highlighted in the green ovals.

The RRG above shows the rotation for the sectors (price based). I have circled the same sectors that have a positive RRG-Heading in the first RRG.

XLC and $BPTELE are both inside the improving quadrant and showing long (powerful) tails; breadth seems to be supporting a further (relative) improvement for Communication Services.

XLRE is inside improving but $BPCLRE is deep inside the leading quadrant moving further right at stable relative momentum. That is definitely supportive for further improvement in the Reall Estate sector.

XLY and $BPDIC are both inside the lagging quadrant but they are also moving at a positive RRG-Heading. Despite the fact that XLY is deep inside lagging and at the lowest RS-Ratio reading in the universe this combination of both tails moving at a strong heading could be an early indication of more improvement ahead.

XLP is inside the leading quadrant but has recently rolled over and is now on the verge of crossing into weakening. Its BullishPercent equivalent $BPSTAP is inside improving but at a positive heading, indicating that, under the hood, participation in this sector is improving.

XLV has just crossed into weakening while $BPHEAL already completed a turn back up towards and into leading after a rotation through weakening. This will be an interesting combination and setup to see if $BPHEAL indeed leads the turn for XLV.

And finally there is XLE inside weakening at a long tail which indicates a rapid decline of relative momentum. The high RS-Ratio reading for XLE indicates that the sector is still in a relative uptrend but currently going through a correction. $BPENER deep inside lagging but turning back up could be the first sign for a starting improvement that could help the XLE tail turn back up while inside weakening.

I found it interesting to see that all sectors that have their BP tails on a positive heading have price tails that are either on the left hand side of the RRG on a positive heading, or on the right hand side of the graph going through a loss of relative momentum but with plenty of room to complete that rotation on the right hand side of the graph.

How Does This Impact the S&P 500 Index?

As I explained in Sector Spotlight not all sector breadth metrics are signalling strength. Howver, the ones that do have managed to push the S&P 500 index above its falling trendline that kept the market under pressure since early 2022. This is certainly a positive piece of the puzzle.

The big question is and will be in coming days; Will it be enough?

We all know that breaks of diagonal trendlines are nice to know but not always that reliable. The real proof will be the horizontal overhead resistance levels offered by old peaks. First and foremost the area between 410-415. Once broken, the next level around 430 can then be seen as the next target.

It looks like we’ll be in for a very interesting week, maybe two or three, to come!

#StayAlert and have a great weekend. –Julius

When concerns of a recession are front and center, investors tend to pay more attention to the Gross Domestic Product (GDP) report. The Q4 2022 GDP report showed the U.S. economy grew by 2.9% in the quarter, and Wall Street wasn’t disappointed. The day the report was released, the market closed higher, with the Dow Jones Industrial Average ($DJIA) up 0.61%, the S&P 500 index ($SPX) up 1.1%, and the Nasdaq Composite ($COMPQ) up 1.76%. Consumer Discretionary, Technology, and Energy were the top-performing S&P sectors.

Add to the GDP report strong earnings from Tesla, Inc. (TSLA) and a mega announcement from Chevron Corp. (CVX)—raising dividends and a $75 billion buyback round—and you get a strong day in the stock markets.

Why is the GDP Report Important?

If a country’s GDP is growing faster than expected, it could be a positive indication of economic strength. It means that consumer spending, business investment, and exports, among other factors, are going strong. But the GDP is just one indicator, and one indicator doesn’t necessarily tell the whole story. It’s a good idea to look at other indicators, such as the unemployment rate, inflation, and consumer sentiment, before making a conclusion.

Inflation appears to be cooling, but the labor market continues to be strong. The Fed has stated in many of its previous meetings that it’ll be closely watching the labor market. So that’ll be a sticky point as we get close to the next Fed meeting. Consumer spending is also strong, according to the GDP report. But that could have been because of increased auto sales and spending on services such as health care, personal care, and utilities. Retail sales released earlier in January indicated that holiday sales were lower.

There’s a chance we could see retail sales slowing in Q1 2023 as some households run out of savings that were accumulated during the pandemic. This is something to keep an eye on going forward, as a slowdown in retail sales could mean increases in inventories. And this is something that could decrease economic activity.

Overall, the recent GDP report indicates the U.S. economy is strong, although some economists feel we’ll probably see some downside in 2023, though not a recession. But the one drawback of the GDP report is that it’s lagging. It comes out after the fact. Wouldn’t it be great if you had known this ahead of time so you could position your trades to take advantage of the rally? While there’s no way to know with 100% accuracy, there are ways to identify probable events.

3 Ways To Stay Ahead of the Curve

Instead of waiting for three months to get next quarter’s GDP report, you can gauge the potential strength or weakness of the overall U.S. economy. Steven Sears, in his book The Indomitable Investor, suggested looking at these charts:

Copper pricesHigh-yield corporate bondsSmall-cap stocks

Copper: An Economic Indicator

You may not hear much about copper, but it’s used in the manufacture of several goods and in construction. Given that manufacturing and construction make up a big chunk of economic activity, the red metal is more important than you may have thought. If you look at the chart of copper futures ($COPPER) you’ll see that, in October 2022, the price of copper was trading sideways, but, in November, its price rose and trended quite a bit higher. This would have been an indication of a strengthening economy.

CHART 1: COPPER CONTINUOUS FUTURES CONTRACTS. Copper prices have been rising since November 2022. Chart source: StockCharts.com. For illustrative purposes only.

High-Yield Bonds: Risk On Indicator

The higher the risk, the higher the yield. That’s the premise behind high-yield bonds. In short, companies that are leveraged, smaller, or just starting to grow may not have the solid balance sheets that more established companies are likely to have. If the economy slows down, investors are likely to sell the high-yield bonds and pick up the safer U.S. Treasury bonds.

Why the flight to safety? It’s because when the economy is sluggish, the companies that issue the high-yield bonds tend to find it difficult to service their debts. When the economy is expanding, the opposite happens—they tend to perform better.

The chart below of the Dow Jones Corporate Bond Index ($DJCB) shows that, since the end of October 2022, the index trended higher. Similar to copper prices, high-yield corporate bond activity was also indicating economic expansion. You’ll see similar action in charts of high-yield bond exchange-traded funds (ETFs) such as iShares iBoxx $ High Yield Corporate Bond ETF (HYG) and SPDR Barclays High Yield Bond ETF (JNK).

CHART 2: HIGH-YIELD BONDS TRENDING HIGHER. The Dow Jones Corporate Bond Index ($DJCB) has been trending higher since end of October 2022.Chart source: StockCharts.com. For illustrative purposes only.

Small-Cap Stocks: They’re Sensitive

Pull up a chart of the iShares Russell 2000 ETF (IWM) and you’ll see similar price action (see chart 3). Since mid-October, small-cap stocks (the Russell 2000 index is made up of 2000 small companies) have been moving higher.

CHART 3: SMALL-CAP STOCKS TRENDING HIGHER. When the economy is expanding, small-cap stocks trend higher.Chart source: StockCharts.com. For illustrative purposes only.

Three’s Company

If all three of these indicators are showing strength, you can expect the GDP number to be strong. There are times when the GDP number may not impact the markets, but, when inflation is a problem and the Fed is trying to curb it by raising interest rates, the GDP number tends to impact the markets.

This scenario is likely to play out in 2023, so it would be worth your while to set up a GDP Tracker ChartList. Want a live link to the charts used in this article? They’re all right here.

Jayanthi Gopalakrishnan

Director, Site Content

StockCharts.com


Disclaimer: This blog is for educational purposes only and should not be construed as financial advice. The ideas and strategies should never be used without first assessing your own personal and financial situation, or without consulting a financial professional.

Last week I featured the S&P 500 SPDR (SPY) with a clear resistance level to beat. Even though the 2022 decline could be a correction after a big advance, the ETF is short of a breakout and trend reversal. The Nasdaq 100 ETF (QQQ) also has a clear level to beat and is challenging resistance.  

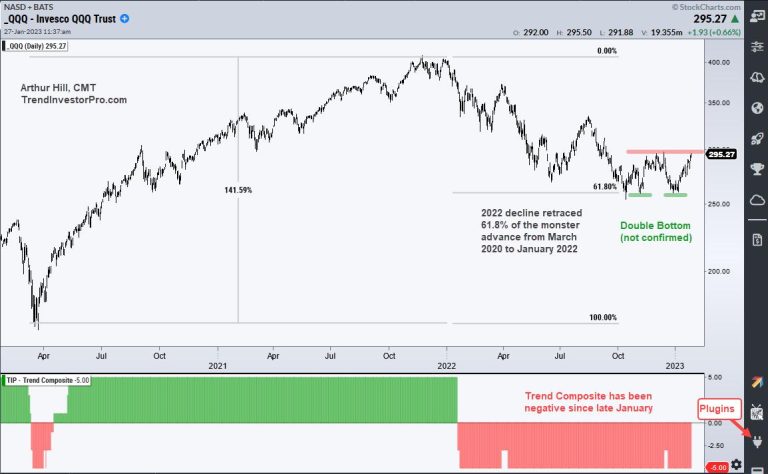
The chart below shows QQQ surging some 140% and then retracing around 61.8% of this advance. This is basically two big steps forward and one step backward. This step backward, however, has yet to reverse and the long-term trend remains down.

QQQ found support twice in the 258 area in early November and late December (green lines). These two equal lows form a potential double bottom and a break above the intermittent high would confirm the pattern. QQQ is challenging the December high as I write and a breakout at 300 would confirm the double bottom.  

The indicator window shows the Trend Composite turning negative in late January and remaining negative, which means the downtrend is in force. In addition to a confirmed double bottom, I would like to see the Trend Composite turn positive before turning bullish on QQQ. The Trend Composite aggregates signals in five trend-following indicators and it is at -5 right now, which means all five have bearish signals.

TrendInvestorPro uses the Trend Composite as part of a trend-momentum strategy for trading a basket of ETFs, the All Weather List. This strategy is explained in a ten part series that includes backtest results and a signal table. Click here for immediate access.

The Trend Composite, Momentum Composite, ATR Trailing Stop and eight other indicators are part of the TrendInvestorPro Indicator Edge Plugin for StockCharts ACP. Click here to learn more and take your analysis process to the next level.

—————————————