Archive

2023

Browsing

Republican Georgia Gov. Brian Kemp and Lt. Gov. Burt Jones are leading a charge by state officials to hold rogue prosecutors accountable for refusing to charge accused criminals with misdemeanors for certain crimes.

On Friday, Jones reacted to two bills being introduced in the Georgia House of Representatives to address the issue by promising to uphold the law and strengthen public safety for Georgians.

‘Any District Attorney who refuses to uphold the law and prosecute criminals in this state is going to be held accountable,’ he said in a statement posted on Twitter. ‘I look forward to working with the Governor and members of the General Assembly to strengthen public safety across our state.’

Kemp made a similar vow in December, arguing rogue prosecutors were essentially endangering the people of Georgia.

‘Far-left local prosecutors are failing their constituents and making our communities less safe. I look forward to working with members of the General Assembly and [Georgia Attorney General Chris Carr] to address it this session,’ Kemp tweeted. 

Republicans introduced the two bills in the Georgia House of Representatives Thursday. They could lead to state prosecutors facing disciplinary sanctions, removal from office or easier voter recalls if they decline to follow the law when it comes to charging individuals accused of crimes.

Both House Bill 229 and House Bill 231 are specifically aimed at addressing district attorneys and county solicitors general refusing to prosecute certain crimes, such as low-level marijuana possession.

House Bill 231 would create a Prosecuting Attorneys Oversight Commission, which would have the ability to investigate judicial misconduct and recommend punishments to the state Supreme Court.

House Bill 229 provides that a district attorney must ‘review every individual case for which probable cause for prosecution exists, and make a prosecutorial decision available under the law based on the facts and circumstances of each individual case.’ It adds that refusing to do so would violate a district attorney’s oath of office, a crime punishable by up to five years in prison.

If passed, the bills would then head to the state Senate before going to Kemp’s desk.

This post appeared first on FOX NEWS

In this episode of StockCharts TV‘s The MEM Edge, the markets closed above key resistance in the S&P 500, which Mary Ellen reviews along with its impact. She also highlights rotation taking shape and what’s driving the moves.

This video was originally broadcast on February 3, 2023. Click on the above image to watch on our dedicated MEM Edge page on StockCharts TV, or click this link to watch on YouTube. You can also watch on our on-demand website, StockChartsTV.com, using this link.

New episodes of The MEM Edge air Fridays at 5pm PT on StockCharts TV. You can view all previously recorded episodes at this link. You can also receive a 4-week free trial of her MEM Edge Report by clicking the image below.

If you are having a hard time figuring out the market’s next moves, start by thinking about trading range. The 2023 Outlook spells out reasons for a 1000-point trading range potential in the SPY from 3200-4200. We are adding that the NASDAQ 100, through QQQ, can head to 330 before topping out, then just as easily skid to support at 230.

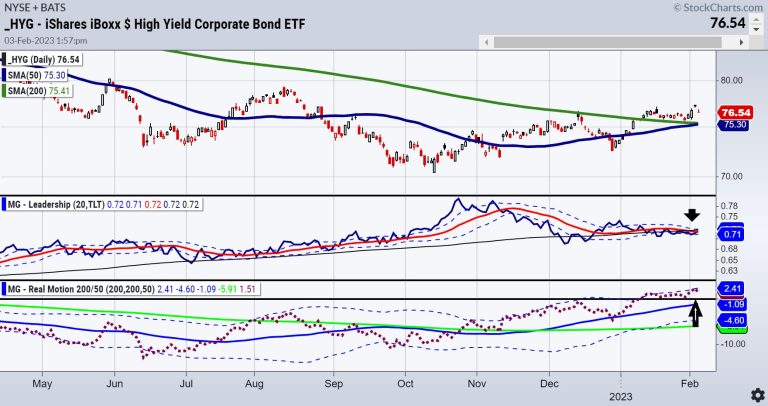
Also, think about this–the relationship between the high yield/high debt bonds and the 20+ year long bonds is as mixed up as you. On the one hand, finally, the high yield bonds are just starting to outperform the long bonds-risk on. (See down arrow.) On the other hand, the real motion momentum indicator flashed a mean reversion on junk bonds. (See up arrow.)

(Check out our Big View this weekend for the latest on key market internals)

So the indices are stuck. The bond relationships are stuck. The economic data is stuck. Recession coming or soft landing achieved? Stuck. What about inflation, geopolitical stress, climate issues and food shortages, along with wage increase demand and social unrest?

Stuck.

Perhaps the Economic Modern Family can help.

The Russell 2000 (IWM) or Granddad of the Economic Modern Family, had a golden cross, and cleared the December highs (though not the August ones). 202 is where major resistance from the 23-month MA sits. Real Motion shows new highs in momentum. A positive.

Triple Play shows leadership against the benchmark. A positive.

Granny Retail (XRT) shows similar technical patterns.

Forget the rest and just look at Granny and Gramps, one should think blue skies. Look at the 23-month moving average though at 78.00, and we see XRT trades well below that level.

Until proven otherwise, trade with a mindset that the market is approaching the top of the range. Also, do not get overly complacent about inflation peaking–we still see a potential trainwreck. However, the modern family has an amazing track record. That means, above these range resistance levels, follow their lead.

For more detailed trading information about our blended models, tools and trader education courses, contact Rob Quinn, our Chief Strategy Consultant, to learn more.

Click here if you’d like a complimentary copy of Mish’s 2023 Market Outlook E-Book in your inbox.

“I grew my money tree and so can you!” – Mish Schneider

Get your copy of Plant Your Money Tree: A Guide to Growing Your Wealth and a special bonus here.

Follow Mish on Twitter @marketminute for stock picks and more. Follow Mish on Instagram (mishschneider) for daily morning videos. To see updated media clips, click here.

Mish in the Media

See Mish, a panel of experts and Yahoo Finance hosts cover jobs, trading ranges and the future of inflation.

Mish shares her views on how to approach the earnings announcements of Apple, Amazon, and Alphabet, and gives her technical outlook on how the earnings results could impact the S&P 500 and Nasdaq 100 in this appearance on CMC Markets.

Listen to Mish on Chuck Jaffe’s Money Life, beginning around the 27-minute mark.

Kristin and Mish discuss whether or not the market has run out of good news in this appearance on Cheddar TV.

Harry Melandri and Mish discuss inflation, the Federal Reserve, and all the sparkplugs that could ignite on Real Vision.

Jon and Mish discuss how the market (still rangebound) is counting on a dovish Fed in this appearance on BNN Bloomberg.

Mish discusses price and what indices must do now in this appearance on Making Money with Charles Payne.

In this appearance on TheStreet.com, Mish and JD Durkin discuss the latest market earnings, data, inflation, the Fed and where to put your money.

In this appearance on CMC Markets, Mish digs into her favourite commodity trades for the week and gives her technical take on where the trading opportunities for Gold, oil, copper, silver and sugar are.

ETF Summary

S&P 500 (SPY): Target 420 with 390-400 support.Russell 2000 (IWM): 190 now support and 202 major resistance.Dow (DIA): 343.50 resistance and the 6-month calendar range high.Nasdaq (QQQ): 300 is now the pivotal area.Regional banks (KRE): 65.00 resistance.Semiconductors (SMH): 246 is the 23-month moving average–can she hold? Sister Semis is the hare this past week.Transportation (IYT): It’s like chips are on a bullet train–this 23-month MA is 244–we are back below that level.Biotechnology (IBB): Sideways action.Retail (XRT): 78.00 the 23-month MA resistance; nearest support 68.00.

Mish Schneider

MarketGauge.com

Director of Trading Research and Education

On this week’s edition of StockCharts TV‘s StockCharts in Focus, Grayson shows how to combine the Sector Summary tool with SCTRs (StockCharts Technical Rank) to find the market’s strongest stocks in just four clicks. By drilling into the strongest sectors and then the strongest industry groups within, you can quickly find a list of promising stocks in leading groups. Using SCTRs to filter the list even further, you’re just a few clicks away from discovering the top charts!

This video was originally broadcast on February 3, 2023. Click on the above image to watch on our dedicated StockCharts in Focus page on StockCharts TV, or click this link to watch on YouTube. You can also watch on our on-demand website, StockChartsTV.com, using this link.

New episodes of StockCharts in Focus air Fridays at 3pm ET on StockCharts TV. You can view all previously recorded episodes at this link.

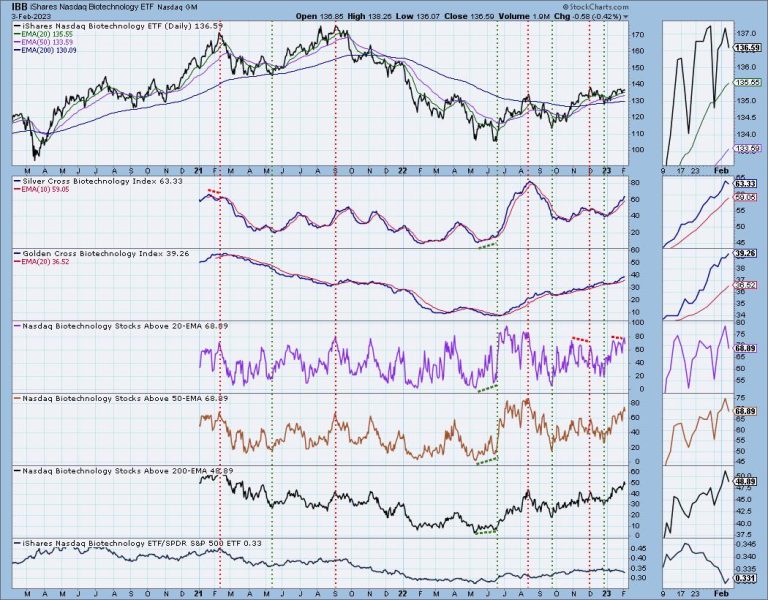
We have begun collecting Silver Cross Index and Golden Cross Index data for four new industry groups, and StockCharts.com back-calculated data for two years: Biotechnology (IBB), Regional Banking (KRE), Retail (XRT), and Semiconductors (SMH).

First let’s cover what the Golden/Silver Cross Indexes are:

The Golden Cross Index (GCI) shows the percentage of stocks on LT Trend Model BUY signals (50-EMA > 200-EMA). The opposite of a Golden Cross is the “Death Cross” — those stocks are in a bear market.

The Silver Cross Index (SCI) shows the percentage of stocks on IT Trend Model BUY signals (20-EMA > 50-EMA). The opposite of the Silver Cross is a “Dark Cross” — those stocks are, at the very least, in a correction.

Let’s take a look our new industry group Golden/Silver Cross Indexes:

Since mid-January, we have seen the relative strength line falling. However, notice what was going on ‘under the hood’. Participation was increasing and the Silver Cross Index was rising. Relative strength was misleading. During this same period, IBB has been in a rising price trend.

Regional Banks (KRE) has seen participation shooting skyward. The relative strength line is in agreement with participation which suggests overall strength. Notice the Silver Cross Index moving vertically higher. This is an industry group to pay attention to.

The Silver Cross Index and Golden Cross Index are rising nicely on XRT. Participation is robust. Notice that when the Silver Cross Index turned up, the relative strength had not begun to rise much. Participation began to improve even before the Silver Cross Index would have gotten us into the rally sooner.

The SMH chart is bit disjointed mainly because there are fewer members in this industry group ETF. We know this group has shown amazing leadership and looking at the participation numbers it’s still going strong. Notice we just got a LT Trend Model “Golden Cross” BUY signal on SMH as the 50-day EMA crossed above the 200-day EMA. This is one reason we see the vertical rise in the Golden Cross Index. If the group itself is getting a Golden Cross, the stocks within are likely seeing the same thing. Currently all of them have price above their 20/50-day EMAs and that has pushed the Silver Cross Index to 100% as well. What this tells us is that we should see a rally continuation. As soon as the participation numbers begin to crack, we will be warned.

Conclusion: Adding participation to charts gives you advance notice of internal strength. We now have Golden Cross Indexes and Silver Cross Indexes for all of the major indexes, all sectors and now, and six industry groups (Gold Miners (GDX), Transportation (IYT) and now Regional Banks (KRE), Semiconductors (SMH), Retail (XRT) and Biotechs (IBB)). These annotated charts are only available for daily review by DecisionPoint.com subscribers.

Want to give us a try? Use coupon code: DPTRIAL2 and get two weeks to check us out for FREE!

Watch the latest episode of DecisionPoint on StockCharts TV’s YouTube channel here!

Technical Analysis is a windsock, not a crystal ball. –Carl Swenlin

(c) Copyright 2023 DecisionPoint.com

Helpful DecisionPoint Links:

DecisionPoint Alert Chart List

DecisionPoint Golden Cross/Silver Cross Index Chart List

DecisionPoint Sector Chart List

DecisionPoint Chart Gallery

Trend Models

Price Momentum Oscillator (PMO)

On Balance Volume

Swenlin Trading Oscillators (STO-B and STO-V)

ITBM and ITVM

SCTR Ranking

Bear Market Rules

DecisionPoint is not a registered investment advisor. Investment and trading decisions are solely your responsibility. DecisionPoint newsletters, blogs or website materials should NOT be interpreted as a recommendation or solicitation to buy or sell any security or to take any specific action.

Whether its a short squeeze or more buying, the market went up a few minutes after Jerome Powell started speaking today. Yes, there might be really negative economic data coming sometime in the future. But we don’t know how much of that the market has already priced in, and it might take time for it to kick in. In this week’s edition of Moxie Indicator Minutes, TG explains that, if the market wants to go up, we ride it and deal with the negative stuff when it starts to matter.

This video was originally broadcast on February 3, 2023. Click this link to watch on YouTube. You can also view new episodes – and be notified as soon as they’re published – using the StockCharts on demand website, StockChartsTV.com, or its corresponding apps on Roku, Fire TV, iOS, Chromecast, Android, and more!

New episodes of Moxie Indicator Minutes air Fridays at 12pm ET on StockCharts TV. Archived episodes of the show are available at this link.

A month ago, the Nasdaq Chart was in the bottom right corner. Tech layoffs were being announced, and the CEO/CFO/CIO teams were preparing for a terrible 2023. A month later, the market looks almost silly, rocketing to new multi-month highs. But here is where it gets tricky. You needed to buy what no one was interested in at the end of the year. Hindsight is 20/20 but let me explain.

Look at the worst 300 Stocks

So what did you need to buy to do well this year?

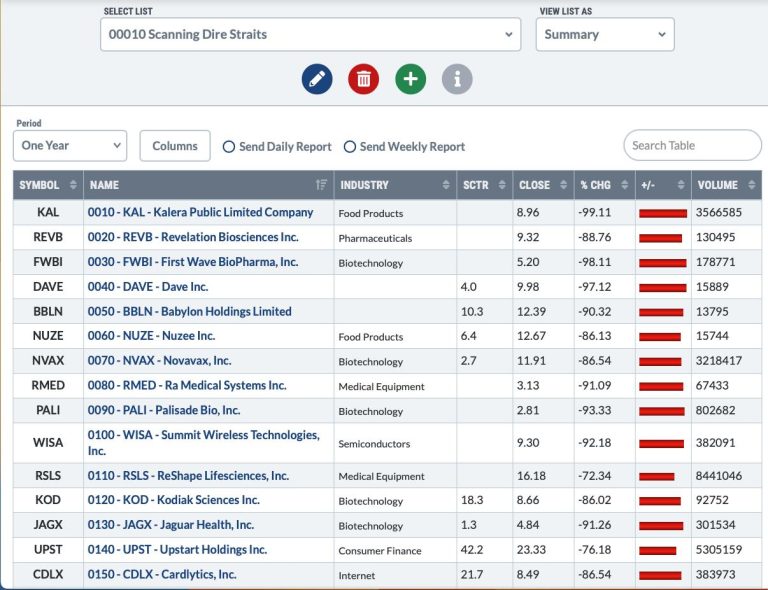
Below is a sort of stocks down more than 60% last year (ending December 31) and ranking them by the worst performers (0010) to best of the worst (0300). I added a series of numbers keeping this sort order. The sort order is based on the scan (0010, 0020,0030 in the name column) and last years worst stock is at the top of the chart).

Footnote – The red bars on the picture below shows the one-year performance (Feb 3, 2022 to Feb 3, 2023) as of February 3rd, not year end.

Note the name of my scan results folder!

When we sort those same names by the largest up move over the last month, we get this picture from the same 300 stocks. The green bars show the percentage change. What I find fascinating is many of the worst 300 stocks of last year in the USA, are up 5x and 10x over how much the index ($SPX = 8%) is up in the first month of the rally.

Just to keep this straight now, I’ve added a second column of numbers on the list below.

The second column of numbers was the rank of how awful they were. 0010 being the worst stock and 0300 being the best of the bad bunch. The first column of numbers is the current leadership of that group over the same month. 0010 being the best stock, 0300 being the lowest performer.

C3.ai

To explain a little further – for c3.ai –

It was the 209th stock out of 300. It wasn’t the worst stock of the worst 300 losers, but it was ranked 209th (2090) meaning 208 stocks were worse.

Now C3 is first so 0010.

Coinbase

Coin base was one of the worst 25 stocks (0250 in the second column) but is now 2nd in the move up.

It can be confusing so let me try to explain it again.

On the picture above there are two numbers at the beginning of the name.

The first is the current ranking from best to 300th shown as (oo10 – to 0300).The second is the worst stock of the year ranked from 0 to 300 (0010 to 0300).

A stock like TREE was 40th worst stock of the year(0400), and is the top 6 (0060) in this group for the best one month performance – up 106%.

Stockcharts does not have a way for me to post the complete PDF here, but I’ve posted the same article on ospreystrategic.org and you’ll be able to download the PDF from there.

I’ll be doing a presentation to show how we operate in the market during rallies and downturns. If you would like to learn more, follow the link for free registration. Osprey Strategic Information Session.

The bottom line, when the market turns higher, staying in the ‘safe’ names, might just lead to a massive underperformance and I’ll be adding this scan to my tool box for major lows.

Three big bellwether stocks announced earnings on the same day, after the close, and they all missed estimates. Does that mean the Technology sector will head lower? Not necessarily. Technically, ahead of earnings, the charts looked strong. Here’s a technical perspective on Alphabet (GOOGL), Amazon (AMZN), and Apple (AAPL).  

Alphabet (GOOGL): What to Watch Out For

GOOGL’s breakaway gap on February 2 (starting October 25, 2022) indicates some significance for the following reasons. It betrays strong bullish sentiment on the day it’s slated to report earnings after hours. It also places share prices above three critical levels of resistance:

The 200-day moving averageThe December 2 (2022) high leading to the most recent rounding bottom, and The October 25 high preceding the bearish swing which brought GOOGL to its lowest 12-month level.

CHART 1: WILL GOOGLE STAY ABOVE ITS 200-DAY MOVING AVERAGE? We’ll see how the stock reacts after its earnings report. If it goes above it, the 200-day MA could become a support level. Chart source: StockChartsACP. For illustrative purposes only.

Depending on the scenario, gaps often get filled, and the outcome following the fill depends on whether the initial bullishness was driven by real anticipated value or overextended exuberance.For the current swing to develop into a stronger trend, GOOGL should remain above the 100-day MA. A move below the January 6 swing low (at 84.86) would likely invalidate any uptrend thesis.

Amazon (AMZN): What to Watch Out For

Adding the Ichimoku cloud overlay to the price chart takes care of some of the critical points a trader should be looking for. The cloud helps identify trend direction, support, and resistance levels. 

While Amazon’s stock price may be tempting to buy given it gapped up to its 200-day moving average, it’s best to take a step back and look at the bigger picture (see chart below).  

CHART 2: AMAZON IN THE CLOUD. The Ichimoku cloud overlay identifies support and resistance levels and trend direction. Chart source: StockChartsACP. For illustrative purposes only.

Consider the following:

Price is trading above the shaded band, which means the top line of the band (green line) would be your first support level. The bottom band line (red line) would be the second support level. The base line (cyan) can be used to confirm a trend. Since AMZN’s stock price is above the base line, it’s an indication that price could go higher. The conversion line (pink) is another trend confirmation indicator. The direction of this line coincides with trend direction. In the chart of AMZN stock, the pink line is trending higher, which is another positive for the stock price.

There are many other ways to use the Ichimoku cloud indicator but its main purpose is to act as a measure of future price movement which is why you see the cloud extending beyond the prevailing price bar. You can see a bullish cloud forming with the red line above the green line. There’s also a lagging span line (white). While it’s lagging, it still is useful in identifying price direction. It’s trending up and is above the price charts from 26 bars ago. That’s another positive indication.

Any reversal in any of these lines or a reversal in the crossover should alert you to a potential reversal in price direction. 

Apple (AAPL): What to Watch Out For

Out of the three, Apple’s stock price has held up pretty well. Since reaching a high in January 2023, the stock price has seen slightly lower highs and lows but the stock has held above its 50% Fib Retracement levels (see chart below). 

CHART 3: A BULLISH BIAS IN APPLE? The stock price is approaching its 23.6% Fib retracement level and there’s a chance that price could move higher. Chart source: StockChartsACP. For illustrative purposes only.

If you look at the Fib retracement levels from the 2020 low to the January 23, 2022 high, price is approaching its 23.6% level (upwards), having bounced slightly above the 50%  retracement level. If Apple’s stock price crosses above it, then it would likely become a support level, considering it’s been tested as a resistance level about five times since 2021.Note that from December 13 to the present day outlines a V Bottom. If Apple stock pulls back in the next few days to test its V bottom neckline (white trendline), you at least have some idea as to the prevailing market sentiment, which currently leans bullish.The relative strength index (RSI) and stochastic oscillator indicate that AAPL may be approaching “overbought” levels. That might make you think that prices may pull back but remember, these oscillators can sustain oversold readings for a lengthy period of time (so exercise caution).

Another thing to consider: Apple’s earnings, along with those of Amazon, Alphabet, and other stocks within or correlated to big tech may play a significant role along with or despite the prevailing technical readings. This is a case where fundamentals may or may not play along with trader sentiment as revealed by the pre-earnings technical setup. 

Trade With Caution

Earnings are tricky to trade, particularly for those attempting to enter early on to catch the upside. Based on the Nasdaq’s performance compared to the S&P and Dow, the overall market bullishness seems to be favoring tech-heavy names. Today’s triple earnings, following Meta’s positive surprise, may boost all three stocks. But they could also pull back to their support levels. So, just set your stops before you enter any trades. 


Disclaimer: This blog is for educational purposes only and should not be construed as financial advice. The ideas and strategies should never be used without first assessing your own personal and financial situation, or without consulting a financial professional.

Today is Friday; however, when the markets drew to a close on Thursday, it left both major events behind itself while it also navigated the weekly options expiry. The markets are having an immensely volatile week; with the last trading day of the week yet to unfold, the weekly bar isn’t complete yet. However, that being said, the major volatility infusing events; i.e., the Union Budget which is one of the most important domestic events, and the Fed Rate announcement, is out of the way.

Amid these volatile times, there were pockets of stocks, independent of the sectors that they belonged to, that were showing very resilient performance. This Commercial Vehicle maker is one such example. The entire Auto sector was seen underperforming the broader markets in the recent past. However, that pocket is now showing strong improvement in its relative momentum against the broader NIFTY 500 Index.

Ashok Leyland Ltd (ASHOKLEY.IN)

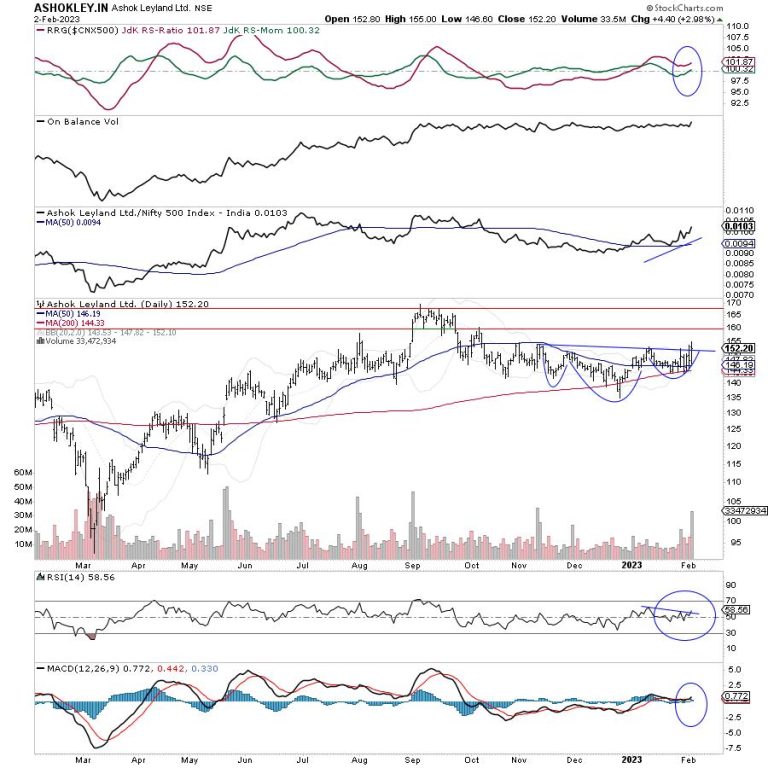
This midcap auto stock marked its high point at 169.45 in early September 2022; since then it saw a corrective retracement and has formed a broad but defined trading range for itself. With the quarterly results out of the way, barring some result reactions, the stock is expected to see higher levels over the coming days.

After marking the high at 169.45, the price moves over the past quarter price moves have seen a development of a bullish (Inverted) Head & Shoulders formation. As the price tries to break out, it is also seen resisting the 100-DMA which is almost acting as a proxy neckline for this formation. While this formation was taking shape, the stock also took support for multiple times at 200-DMA which presently stands at 144.

While the stock attempts a breakout, it has rolled inside the leading quadrant. This lends further impetus to the current relative outperformance of the stock. The RS line against the broader NIFTY 500 index is also in a firm uptrend and above the 50-period MA.

There is strong volume participation in the move as well. While the stock is seen attempting a breakout, the volumes are already higher than their average; the On-Balance Volume (OBV) has also marked a new high which is bullish. The MACD has shown a positive crossover; it is now bullish and trades above the signal line. The RSI is seen breaking out of a formation by penetrating a falling trend line; this comes ahead of the actual price breakout. It also shows a bullish divergence against the price along with marking a fresh 14-period high.

The stock is likely to continue to relatively outperform not only the Auto sector but also the broader markets and the mid-cap universe. The stock has the potential to test 160-165 levels over the coming days. Any close below 142 would negate this technical setup.

Foram Chheda, CMT

and

Milan Vaishnav, CMT, MSTA | Consulting Technical Analyst | www.EquityResearch.asia | www.ChartWizard.ae

A series of class-action lawsuits alleging deceptive practices by Beyond Meat will be heard as a single case in Chicago, a court ruled Wednesday.

The suits allege Beyond Meat Inc., which sells plant-based meat-substitute products, miscalculates and overstates the protein content in its foods and misleads consumers about the nutritional benefits, compared to traditional meat products.

The lead complaint, filed in September, alleges that a method of testing a product’s protein content — through an interaction with a nitrogen compound — reveals some Beyond Meat products contain less protein than what is required to be shown on a label.

‘For example, Defendant’s Beyond Beef Plant-Based Ground 16oz Patties, which is labeled as ’20G Per Serving’ and ‘40% DV’ for protein, actually contains 19G Per Serving by nitrogen testing, and 7% DV for protein,’ the complaint states.

A representative for Beyond Meat did not immediately respond to a request for comment.

Beyond Meat announced last fall it would be laying off 200 workers. That was on top of a 4% reduction in its workforce announced in August. According to the food industry news website FoodDive, the company has missed revenue targets and cut its annual projections.

Its nearest rival, Impossible Foods, has also struggled, and this week announced it would cut its workforce by 20%.

A recent Bloomberg News feature called plant-based meat alternatives ‘a flop,’ quoting one analyst as saying regular meat-eating consumers are “just not that into it.’

This post appeared first on NBC NEWS