Archive

2023

Browsing

The White House’s top cyber official is stepping down from his role amid a wave of recent senior Biden administration officials departures.

Chris Inglis, who served as the national cyber director, announced Wednesday that he is ‘stepping down’ from his position.

‘It’s my great honor to have my name associated with the people of [the Office of National Cyber Director] who stewarded this organization from its very first days. I am proud of what we have accomplished together, and I look forward to watching what @ONCD and its partners will achieve in the future,’ Inglis tweeted.

His departure is part of a shake-up of senior White House staff following the 2022 midterm elections.

The White House confirmed Friday that President Biden’s communications director, Kate Bedingfield, who has been with the president since his 2021 inauguration, is leaving.

Bedingfield will be succeeded by Ben LaBolt, a former adviser to former President Barack Obama and current strategist for the communications agency Bully Pulpit Interactive.

Biden’s first chief of staff, Ron Klain, has also left the administration in recent days.

Ahead of his departure, Klain said he expects Biden to seek re-election in 2024, though the president has not announced his candidacy.

‘As I did in 1988, 2008 and 2020, I look forward to being on your side when you run for president in 2024,’ Klain told a group of staff and press at the White House on Wednesday.

His successor, Jeff Zients, has started in the West Wing, and it’s possible more staffing changes are imminent.

This post appeared first on FOX NEWS

Michigan Gov. Gretchen Whitmer, a Democrat, said Wednesday the time for ‘only thoughts and prayers is over’ as she renewed calls for stronger gun laws in the wake of a shooting at Michigan State University (MSU) that left three students dead.

‘The time for only thoughts and prayers is over,’ Whitmer declared in a video message shared to Twitter. ‘We are in a unique position to take action and save lives. And that’s exactly what we are going to do in the weeks ahead. We’re gonna get this done for every Spartan who’s lucky enough to call campus home.’

‘We’re going to get this done for Michigan and all students and families and communities,’ she added, suggesting that the state legislature would be working to implement new gun laws in the near future.

Michigan State University identified the three students who were killed in a shooting on campus Monday evening as Alexandria Verner, a junior from Clawson; Arielle Anderson, a sophomore from the Detroit suburb of Grosse Pointe; and Brian Fraser, a sophomore also from Grosse Point. 

The victims were shot and killed when Anthony McRae, a 43-year-old man with no affiliation to the university, opened fire inside an academic hall and student union building shortly after 8:00 p.m. The suspect was later found dead from a self-inflicted gunshot wound off of MSU’s campus, Deputy Chief Chris Rozman said shortly after midnight.

Whitmer’s comments, which identified the shooting as a ‘uniquely American problem,’ come after Michigan Senate Majority Leader Winnie Brinks, a Democrat whose daughter attends MSU, said Tuesday that the state Senate would be ‘taking action soon’ on gun control measures after the fatal MSU shooting.

‘We will be introducing common-sense legislation, and we are prepared to get the job done,’ Brinks said, according to The Detroit News.

Michigan state House Speaker Joe Tate has also echoed Whitmer’s call for action following the MSU shooting, according to the outlet.

‘We can continue to debate the reasons for gun violence in America, or we can act,’ Tate said in a statement on Tuesday. ‘We cannot continue to do the same thing over and over again and hope for a different outcome. … I have no understanding left for those in a position to effect change who are unwilling to act.’

Earlier this week, Michigan state House Majority Leader Ranjeev Puri issued his official statement following the university shooting that killed the three students and injured five others, saying ‘F— your thoughts and prayers.’

‘We are not even two full months into 2023, and this marks the 67th mass shooting of the year, along with over 2,215 gun deaths,’ Puri claimed.

Five people remain in critical condition following the shooting.

Fox News’ Paul Best and Lawrence Richard contributed to this article.

This post appeared first on FOX NEWS

One of President Biden’s judicial nominees faced brutal questioning Wednesday during a Senate confirmation hearing for the role he played in defending a New Hampshire prep school in a famous student rape case from 2014 — a role that could scuttle his nomination.

In a Senate Judiciary Committee hearing, GOP senators grilled Michael Arthur Delaney, who is nominated to serve on a First Circuit court, for his role as defense attorney for the elite St. Paul’s School in Concord, New Hampshire, during the case against Owen Lambrie. When he was 18, Lambrie was accused of raping a 15-year-old student, Chessy Prout.

The contention in the hearing stemmed from a motion that Delaney filed during the 2014 court proceedings that could have required Prout, who was a minor at the time, to have her anonymity lifted.

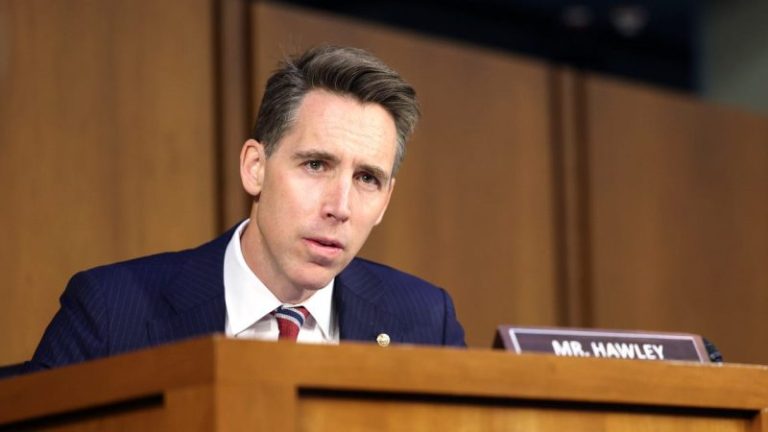
‘You filed a motion that sought to strip her anonymity,’ Sen. Josh Hawley, R-Mo., charged in the hearing.

‘You told the court that it should happen because you didn’t like the time at which her counsel filed their complaint because it put your school at an inconvenience. They had to answer reporter questions, you said. Frankly, that seems to me like a small burden to bear after what Chessy went through,’ he said.

‘I’m astounded you’ve been nominated. I can’t believe we’re sitting here having this conversation today,’ Hawley added. ‘People who put sexual assault victims through this kind of torture shouldn’t sit on the bench.’

Delaney defended his position by saying the motion he filed was in the context of a back-and-forth between lawyers about whether Prout could stay anonymous and whether Prout’s legal team would agree to not discuss the case in the press. He said it was not ‘in any way intended to intimidate any of the parties to the case.’ The motion was ultimately withdrawn, and Prout chose to come forward publicly on her own.

But Republicans rejected that explanation.

‘You made a decision here… to try to strip a young girl of her anonymity. And you effectively succeeded, because you bullied her into it,’ Hawley claimed. ‘So she, unwilling to be intimidated by you, went forward and revealed her own name.’

Prout submitted a letter to committee opposing Delaney’s nomination, from which Hawley read excerpts aloud.

‘I remember so clearly reading Michael Delaney’s motion from front to back when I came home from my new high school one day, processing what it meant,’ Hawley read from the letter. ‘And then defiantly stating to my parents that after everything I’ve been dragged through from anonymous death and rape threats on the internet, to the betrayal of and backlash of my closest friends. I wasn’t gonna let Michael Delaney’s dirty tactics bully me – then 16 years old – into shame and silence.’

‘When survivors of sexual assault, harassment and abuse come forward to seek some semblance of justice, there is an army of attorneys with a tried and true playbook of tactics to discredit, pressure and manipulate survivors and victims into silence,’ Hawley read from the letter.

Sen. Ted Cruz, R-Texas., noted that Prout’s parents were in the audience at the hearing.

‘You and your daughter have been victimized now three times,’ Cruz said. ‘First on that horrific night. Secondly, when Mr. Delaney representing the school went into court, and tried to strip your daughter’s anonymity, tried to out her against her wishes. And third, when the Biden administration chose to reward him by nominating him to the court of appeals.’

Cruz added that ‘there is a reason that virtually every Democrat skipped this hearing. They’re embarrassed about this nomination.’ At least seven committee Democrats were not present at the hearing.

Cruz read another portion of Prout’s letter, which said, ‘If Michael Delaney is confirmed, if an attorney who has brazenly intimidated a minor victim of sexual assault is given the distinct privilege to serve as a judge for the United States Court of Appeals, you are telling victims and survivors that you not only approve of victim intimidation tactics, you reward their enactors with one of the highest legal appointments in the state of Massachusetts.’

Delaney said that he hopes the committee will ‘consider the totality’ of his 30-year career for his nomination.

‘I have spent nearly 30 years in my legal career, half of that in public service,’ he said.

 ‘In all that I did, I would ask this committee to consider the totality of my record over nearly 30 years as it reviews my qualifications,’ Delaney added.

This post appeared first on FOX NEWS

A Congressman representing East Palestine, Ohio is slamming Transportation Secretary Pete Buttigieg after he shifted a portion of the blame for a derailed train carrying toxic chemicals to the Trump administration as well as Congress.

Buttigieg said on Tuesday that his agency has been ‘constrained’ by the Trump administration, stating that the Department of Transportation in 2018 withdrew a proposed rule that would require trains carrying some dangerous chemicals to use electronically controlled pneumatic (ECP) brakes. 

At the time, the Department of Transportation said that the technology’s benefits weren’t conclusive.

‘We’re constrained by law on some areas of rail regulation (like the braking rule withdrawn by the Trump administration in 2018 because of a law passed by Congress in 2015), but we are using the powers we do have to keep people safe,’ Buttigieg tweeted.

Rep. Bill Johnson, R-Ohio, fired back in a statement to Fox News Digital saying that he’s going to stay focused on the concerns of East Palestine residents rather than playing the ‘blame game.’

‘If someone wants to play the blame game now, that’s their decision, but I’m going to stay focused on the residents of East Palestine and the tasks at hand,’ Johnson said. ‘Right now, I’m focused on making sure the residents of East Palestine are safe, secure, get the help they need, and have their questions answered. The ongoing cleanup efforts must be completed, and the ongoing air and water testing must continue. Right now, we need to let the investigators with the NTSB do their job and determine the cause of this crash.’

On Wednesday, Johnson invited Buttigieg to the scheduled town hall in East Palestine at 7 p.m.

‘@SecretaryPete, hope to see you tonight at the town hall in #EastPalestine. I’ll save a seat for you. It’s past time you hear the concerns of residents affected by the train derailment,’ Johnson said.

A train with 50 rail cars, 10 of which were carrying vinyl chloride, derailed in East Palestine on Feb. 3. The derailment caused hazardous chemicals to spill onto the ground and sent a plume of smoke into the air. 

A controlled release of chemicals was conducted in the days after the derailment because of the risk of a major explosion, officials said. Residents were evacuated before the controlled release was performed.

While the U.S. Environmental Protection Agency and Ohio officials said that both the air and water in East Palestine are safe, residents are reporting various health issues.

East Palestine residents Nathan Izotic and his wife Kelly said on ‘Tucker Carlson Tonight’ that they are experiencing the chemical’s impacts first-hand.

‘We are seeing them locally and inside of our bodies. What we’re experiencing- local fish in our creeks have died….oily sheens and coloration in our water….[the] constant smell of burning plastics and chemicals in the air…issues with our dog…vomiting, acting lethargic. It’s scary stuff here,’ Izotic said.

Nathan Velez, another resident of East Palestine, said that he’s experienced persistent headaches.

‘My house is just across the tracks … and it smells, too. You can’t spend a lot of time here without feeling like crap,’ he said. ‘And my question is why, if it’s okay if it’s safe, and all these people say it’s safe, if it’s so safe and okay then why does it hurt?’

A spokesperson for the Department of Transportation told Fox News Digital that ‘[Federal Railroad Adminisrtration] and [Pipeline and Hazardous Materials Safety Administration] staff were on the ground within hours of the derailment and the EPA Regional Administrator and EPA Administrator are visiting. [National Transportation Safety Board] is the lead investigator and DOT is in a supporting role.

Fox News’ Chris Pandolfo and Ashley Carnahan contributed to this report.

This post appeared first on FOX NEWS

In this week’s edition of Trading Simplified, Dave continues to show his methodology in action by revealing an old mystery chart and adding a new one. He answers crypto questions on the 2/30EMA System and volume. Then, continuing his discussion on Crypto, he explains that it’s not about the Crypto — it’s about being a trader. And, even though he’s been bullish on Crypto lately, he’s not afraid to short them when they’re headed lower. He does this because that’s what traders do.

This video was originally broadcast on February 15, 2023. Click anywhere on the Trading Simplified logo above to watch on our dedicated show page, or at this link to watch on YouTube. You can also watch this and past episodes on the StockCharts on-demand video service StockChartsTV.com — registration is free!

New episodes of Trading Simplified air on Wednesdays at 12:00pm ET on StockCharts TV. You can view all recorded episodes of the show at this link. Go to davelandry.com/stockcharts to access the slides for this episode and more. Dave can be contacted at davelandry.com/contact for any comments and questions.

Wednesday morning brought some love to the US economy. The January retail sales rose 3% month/month vs. +2% estimated.

The breakdown fascinates.

With food inflation where it is, and egg prices the big headline, the leader for today’s number is FOOD, particularly eating out. At the bottom of the chart, or with the least rise in sales by retail consumers, is groceries and gasoline.

Makes for some head scratching, really, considering folks bought cars and ate out, but did not gas those cars much or buy a lot of food to cook at home with. Is the whole country buying Teslas and eating at Wingstop?

Both of those stocks did extremely well, with WING making new 52-week highs and Tesla up more than double from its January low.

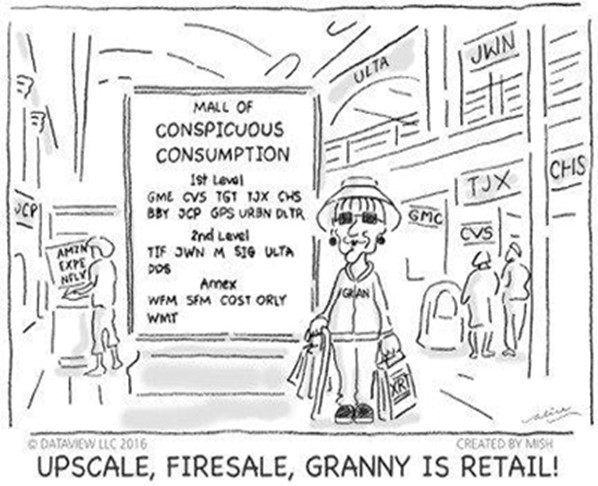
There’s Retail Sales, Then There’s Granny Retail

Retail, through the eyes of our Granny of the Economic Modern Family is a great go-to as the basket of XRT has a good blend of e-commerce, brick and mortar, consumer staples, and discretionary goods.

Notice on this weekly chart that the 23-month moving average is much higher than current levels.

Another point is that, with Wednesday’s ebbulience, the price remains below last week’s high. Furthermore, last week’s high remains below the week prior. So, XRT is making lower highs each of the last 3 weeks, but also has found a basis of support at 68.00.

Moving down to our Leadership indicator, Retail is outperforming the benchmark, which makes sense given today’s retail sales number. And that is a good thing, given Granny resides next to the Russell 2000 as the king and queen of the U.S. economy. However, neither are proving to us yet that they are entering a growth stage beyond the 2-year business cycle high and can sustain this rally.

Finally, Real Motion, on the bottom, shows a negative divergence. While on the price charts the 50-DMA (blue) is above the 200-DMA (green), the momentum chart looks a bit different. For one, the 200-DMA is above the 50-DMA, so not as strong a phase. Secondly, the momentum red dots are below the 200-DMA while the price is above it on the top chart. And the momentum skips along the 50-DMA.

Although the momentum is weaker, it does not necessarily mean the price cannot go higher. However, it does suggest that the overhead monthly moving average resistance is palpable and bulls can have some fun, but should also remain vigilant.

For more detailed trading information about our blended models, tools and trader education courses, contact Rob Quinn, our Chief Strategy Consultant, to learn more.

IT’S NOT TOO LATE! Click here if you’d like a complimentary copy of Mish’s 2023 Market Outlook E-Book in your inbox.

“I grew my money tree and so can you!” – Mish Schneider

Get your copy of Plant Your Money Tree: A Guide to Growing Your Wealth and a special bonus here.

Follow Mish on Twitter @marketminute for stock picks and more. Follow Mish on Instagram (mishschneider) for daily morning videos. To see updated media clips, click here.

Mish in the Media

Mish shares three charts she is using to measure inflation using the commodities markets on the Wednesday, February 14 edition of StockCharts TV’s The Final Bar with David Keller!

Mish gives you some ideas of what might outperform in this new wave of inflation on the Friday, February 10 edition of StockCharts TV’s Your Daily Five. She has picks from energy, construction, gold, defense, and raw materials.

Read about Mish’s interview with Neils Christensen in this article from Kitco!

In this appearance on Making Money with Charles Payne, Charles and Mish discuss whether Powell can say mission accomplished.

Mish shares her views on how to approach the earnings announcements of Apple, Amazon, and Alphabet, and gives her technical outlook on how the earnings results could impact the S&P 500 and Nasdaq 100 in this appearance on CMC Markets.

ETF Summary

S&P 500 (SPY): 420 resistance with 390-400 support.Russell 2000 (IWM): 190 pivotal support and 202 major resistance.Dow (DIA): 343.50 resistance, 338 support.Nasdaq (QQQ): 300 the pivotal area 290 major support. Nice comeback–still 2 inside weeks working, so watch 311 as a good point to clear or fail from.Regional Banks (KRE): 65.00 resistance, 61 support.Semiconductors (SMH): 248 cleared, now support – 254.60 last week’s high, 248 resistance, 237 then 229 support.Transportation (IYT): The 23-month MA is 244–now resistance, 228 support.Biotechnology (IBB): Sideways action 130-139 range.Retail (XRT): 78.00 the 23-month MA resistance and nearest support 68.00.

Mish Schneider

MarketGauge.com

Director of Trading Research and Education

When traders and investors brave the heights of speculative endeavor, clear conditions, fundamentally and technically, are the most you could ask for. But there are cases where fundamentals remain foggy and technical chart patterns seem almost hidden or questionable. This is certainly the case with Boeing (BA), as it took flight with a bullish ascending triangle pattern amid a loss-ridden yet not-too-disappointing earnings report.

Long-term guidance hints at growth and optimistic expectations, yet Wall Street knows that economic winds often play a strong hand in shifting Boeing’s market.

Are they tailwinds or headwinds? Try both.

An Ascending Triangle Amid Some Technical Turbulence

As every trader knows, patterns are not always cookie-cutter clear. The collective drive that causes formations to occur matters, and the variations in conviction will often reflect the variations in the shape of technical formations. 

The Tailwinds for Boeing Stock

A couple of bullish indications are at play. Let’s take a closer look at Boeing stock (see the chart below).

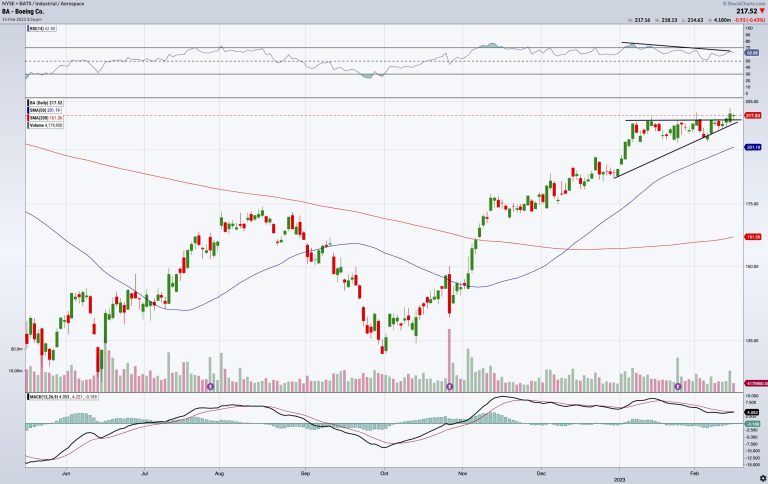
CHART 1: BOEING STOCK. Boeing’s stock price could break above the ascending triangle and continue the bullish rally that started in October. Look for a follow-through on higher-than-average volume and for the MACD line to cross above its signal line.Chart source: StockChartsACP. For illustrative purposes only.

An ascending triangle. Boeing’s ascending triangle appears to form a bullish continuation pattern of the current upswing that began in October.

Now, bear in mind that when it comes to identifying ascending triangles, the bottom formation is critical (as that’s what’s actually “ascending”). We see an ascending set of consecutive lows, but you have to bear in mind that lows are conditional to trending movements, and there are often many trends (smaller or larger) within a single trend (which is why you can draw different trendlines to trace larger or smaller swings).

What prompted the breakout in Boeing’s stock price on February 14? A massive Air India order requesting 220 Boeing jets (190 737 Max planes, 20 787 Dreamliners, and 10 Boeing 777X).

A Golden Cross occurred in mid-December. We can call this a Type 1 Golden Cross event, as the price was extended far beyond the price point in which the 50-day simple moving average (SMA) crossed above the 200-day SMA. A Golden Cross is typically considered a bullish signal, but you have to look at what you’re flying into, especially if there may be turbulence ahead.

Headwinds for Boeing Stock Price

Despite the bullish momentum underwing, there are a few things to watch out for.

RSI — Gaining Altitude While Losing Fuel? If you compare the January 6 Relative Strength Index (RSI) reading against the February 14 RSI reading, you see a move from a 77.06 (overbought) level to 64.61. This spells two things—a slight decline and divergence. So, is price driving ahead of its momentum?

MACD The Lines Looking Not-So-Good: Take a look at the MACD line on November 15 and January 13. Boeing’s share price rose significantly, while the MACD line slid from 9.77 to 9.03. In both instances, the MACD line also crossed under the signal line (though it looks to be crossing over once again toward the upside). The MACD histogram currently holds a negative baseline reading. Sunny skies? Maybe, but you can’t deny the thick screen of clouds ahead.

The Fundamental Picture Paints a Monochrome Gray 

The pandemic hit aircraft manufacturing demand with a brutal blow to the gut. While demand has risen sharply since, many manufacturers, Boeing included, are hesitant to put the engines of production into full gear.

Boeing’s Q4 2022 performance was better than expected, despite losses in earnings and revenue (again, another instance where not-so-bad = good). The company generated the most cash flow it’s seen since 2018, when the MAX crashes triggered a yearlong tailspin. Yet the company has “a robust pipeline of development programs” looking forward, according to its CEO Dave Calhoun. And the Air India orders (among any forthcoming sales) may exert some weight on the coming quarter’s earnings report.

The Bottom Line

There are several technical and fundamental factors to consider, especially if Boeing’s stock price breaks out (or breaks down) from the current ascending triangle pattern. If you’re looking to open a long position on Boeing stock, you might wait for confirmation of the upside breakout. Check whether the moving average convergence/divergence (MACD) line cross above the signal line and look to see whether the volume supports any forthcoming follow-through. If all signals are “go,” then look to the top of the ascending triangle pattern for potential support.

Remember: there are many ways to technically and fundamentally analyze Boeing’s stock price action.

Head over to the Member Tools section of Your Dashboard.Scroll down to the Summary Pages.Select Sector Summary > Industrial Sector Fund > Aerospace.Sort the columns by SCTR and company size (U). BA should be close to the top of the list.If you select Boeing Co. you’ll see a chart of Boeing stock.You could also go back to Summary Pages, select Symbol Summary, and enter BA into the symbol box. This will give you a technical and fundamental summary, Boeing’s SCTR, any predefined scans, alerts, and ChartLists that include Boeing stock.

Disclaimer: This blog is for educational purposes only and should not be construed as financial advice. The ideas and strategies should never be used without first assessing your personal and financial situation, or without consulting a financial professional.

The US consumer price index (CPI) came in slightly higher than expected; the market’s been pretty chill about it so far. But will that change?

Inflation may be eating into your bank account, but you can stop it from taking a chunk out of your portfolio returns. Since the last Fed interest rate decision, investors have been looking forward to a Fed pivot. But the big question is when’s that likely to happen. Inflation in the US is still high, and, when that’s the case, it’s natural for investors to be hesitant about investing in the stock market. The Fed indicated in their last meeting that they’ll likely be slowing the pace of rate hikes, but will inflation numbers support this idea?

Every Inflation Is Different

Two inflationary periods aren’t alike. Some interesting data points rise to the surface when you take a deeper dive into the January CPI data. Even though inflation is trending lower, rent remains very high. Shelter prices were up the most in January. Food and gas prices were also high, as was natural gas ($NATGAS), although that may come down in February given that nat gas prices went through a steep slide.

The upside—shelter costs have been declining. Rent has been coming down, and we’ve seen a little softening in housing demand, although not enough to warrant shelter prices coming down. Core services such as healthcare, personal care, and home services have also been pretty high. Then there’s the job market, which continues to be tight. To give weight to some of these areas that are still seeing higher prices, the Fed gave importance to the buzzword “supercore inflation,” a term we’re likely to hear a lot of this year. 

Inflation can be tricky to keep track of. It’s got a lot of moving parts and unique circumstances. We’ll leave the data digging and interpretation to the experts and focus on how to keep track of inflation at a high level so our portfolio returns don’t erode.

Four Charts to Check for Inflation

The next scheduled Fed interest rate decision is on March 22. Till then, we’ll get more economic data, which could change things if the data deviates widely from expectations, or the market could continue moving sideways until there’s more certainty about inflation. To get a high-level view of inflation’s impact on the stock markets, it’s a good idea to set up your ChartLists or layouts that include a broad equity index such as the S&P 500 index, Treasury yields, the US dollar, and gold futures.

The S&P 500 Index

The S&P 500 index ($SPX) looks like it’s hesitant to break above its 50% Fibonacci retracement level (from the January 4, 2022, high to the October 13, 2022 low). There’s not much volatility, probably because traders and investors are waiting on the sidelines for some certainty. A break above the 50% retracement level could take the S&P 500 to its August high of around 4,300, but there’s an equal chance the S&P 500 index could drop to around 4,000, or its 38.2% retracement level.

CHART 1: SUPPORT AND RESISTANCE LEVELS IN THE S&P 500 INDEX. A break above the 50% Fibonacci retracement level could take the S&P 500 index higher toward its August high.Chart source: StockChartsACP. For educational purposes only.

The 20-day moving average is trending higher and is acting as a valid support level in the uptrend from mid-January. If the S&P 500 were to fall below its 20-day moving average, it could signal the start of a downtrend.

10-Year US Treasury Yield Index

Like stock prices, bond prices are impacted by inflation. After trending lower since October 21, 2022, the 10-year US Treasury Yield index ($TNX) broke the downward trendline on February 10, 2023.

CHART 2: 10-YEAR TREASURY YIELD INDEX. The 10-year yields broke above a downward-sloping trendline and look to have started an uptrend, although that could change if there’s certainty that interest rate rises will start tapering.Chart source: StockChartsACP. For educational purposes only.

Another point to note on the chart is that the 20-period moving average is getting close to crossing above the 50-day moving average. If the cross does take place, it could signal that yields may move higher. This could change in a snap if inflation numbers support a tapering or pivot in the future.

The US Dollar

After the January CPI release, the dollar spiked, but pulled back relatively quickly. The dollar has been in a trading range since February 6 and is in the middle of a flag formation. Although there’s still time before the next Fed meeting, it’s worth keeping an eye on the top and bottom of the flag.

CHART 3: THE US DOLLAR. The dollar tends to be sensitive to inflation. A break above the flag formation could mean a rally in the dollar, but it could also go back down toward its February low.Chart source: StockChartsACP. For educational purposes only.

Using Fibonacci retracement levels from the September 28 high to the February 2 low shows that a break above the flag would take it to the 23.6% Fibonacci retracement level. That’s not too far away from where the dollar is trading, so a break above the top of the flag could take the dollar to its next resistance level—the 38.2% level. And if it breaks below the flag, the US Dollar index could head back to its February low of 100.68.

Gold Futures

Gold is considered a risk-off asset. When stocks fall, investors often invest in risk-off assets, such as gold. In inflationary times, gold is considered a hedge.

After reaching a high in early February, gold prices have seen a steep fall. Gold is now between its 23.65 and 38.2% Fib retracement levels and has fallen below its 50-day simple moving average (SMA). This increases the probability of gold falling even further. If it breaks below its 38.2% Fib retracement level, look for it to go to its 50% retracement level. But if inflation becomes a concern again, gold could move back up toward its February high.

CHART 4: GOLD FUTURES BROKE BELOW 50-DAY MOVING AVERAGE. Gold prices could fall further if the inflation data support interest rate tapering.Chart source: StockChartsACP. For educational purposes only.

Three Out of Four Ain’t Bad

The S&P 500 index and US dollar are at a critical juncture. 10-year yields are trending higher, although that could change quickly when inflation concerns ease. Gold prices seem to be moving to the downside, which is an indication that investors aren’t rushing to risk-off assets.

The next piece of data to focus on is the January producer price index (PPI) data, and keeping these charts—S&P 500, 10-year yields, US dollar, and gold—on your radar will keep you in tune with the market’s reaction to inflation data.

If you’re a StockChartsACP user, have four charts displayed on one screen using the layout feature. On SharpCharts, save these charts in a ChartList and view them in any format that you prefer.

Disclaimer: This blog is for educational purposes only and should not be construed as financial advice. The ideas and strategies should never be used without first assessing your personal and financial situation, or without consulting a financial professional.

SPX Monitoring Purposes: Long SPX on 2/6/23 at 4110.98.

Monitoring Purposes GOLD:  Long GDX on 10/9/20 at 40.78.

Long Term SPX Monitor Purposes: Neutral.

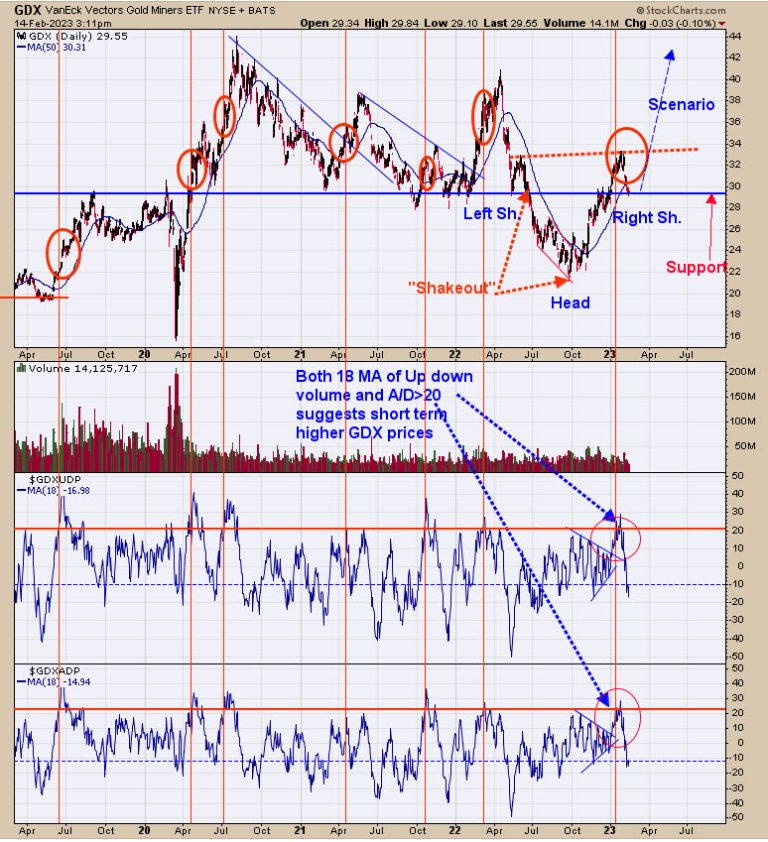
Yesterday we said, “We posted this chart back in early January. We noted that, when both 18 MA’s of the Up/Down volume and Advance/Decline indicators reach above +20, the market is due for a consolidation (got the pull back). We also noted that when both indicators reach >+20, after the pullback, the market goes on to make a higher high. We noted those instances on the chart above with red vertical lines. Notice also that there was a “shakeout”, which is when the market is unable to hold below previous lows. A close above the previous lows creates the “shakeout”. What normally happens next is an attempt to break above the previous highs, which in this case would be for GDX to attempt to break above 41.00 range. As long as the weekly mid-Bollinger Bands are rising, then the trend is up.”

Added to the above, GDX is back at the support lines that date back to 2016 (7 year support line). The longer in time the support line, the stronger it is. The pattern that may be forming is a “head-and-shoulders bottom” pattern where the head is the late September low. I might add GDX traded above its left shoulder on higher volume, suggesting the early January high will be exceeded at some point and give credit to the developing head-and-shoulders pattern, This potential head-and-shoulders pattern has a measured target to 42.00 range, which is back to the old highs.

Tim Ord,

Editor

www.ord-oracle.com. Book release “The Secret Science of Price and Volume” by Timothy Ord, buy at www.Amazon.com.

Signals are provided as general information only and are not investment recommendations. You are responsible for your own investment decisions. Past performance does not guarantee future performance. Opinions are based on historical research and data believed reliable; there is no guarantee results will be profitable. Not responsible for errors or omissions. I may invest in the vehicles mentioned above.

Consumer prices increased at an annual rate of 6.4% in January — a slight slowdown from the 6.5% seen in December but above analysts’ prediction of 6.2%.

Food prices increased 10.1% from last January, the ninth-consecutive double-digit annual increase for that category, though still down from its August peak.

Shelter costs, which includes rent and the cost of homeownership, increased 7.9%. That’s the fastest annualized rate since 1982. Rent costs increased 8%, another new record.

Economists are increasingly of the belief that inflation has already peaked. But 6.4% is still well above the 2% that the Federal Reserve desires, given its mandate to promote stable prices and a low unemployment rate.

It’s one reason Fed Chairman Jerome Powell told an audience last week that he intends to keep interest rates higher until inflation gets closer to that 2% target. By maintaining those supersized interest rates, Powell hopes to increase the cost of borrowing and investing, thereby reducing overall demand in the economy and putting downward pressure on prices.

In the meantime, the Fed will make it more expensive to do everything from buying a house or an automobile to borrowing with a credit card or a personal loan.

There wasn’t much of a slowdown for prices in January, according to Pantheon Macroeconomics research group chief economist Ian Shepherdson. In a note to clients Monday, Shepherdson said rebounding gasoline prices and ongoing increases in rents kept overall prices higher last month. A sudden, if modest, increase in used vehicle prices — in contrast to recent steep declines — also pushed costs upward.

That means the Fed and Powell are likely to keep raising rates, he said.

‘We now expect a further hike in March, and we’re increasingly leaning towards expecting a final increase in May,’ Shepherdson wrote.

The U.S. economy is revealing itself to be difficult to slow down, Bank of America economists said in a note last week, citing an extraordinary 517,000 jobs added in January. That means any forthcoming recession is likely to be mild and wouldn’t happen until the second half of 2023, they suggested.

A man shops for fruit at a grocery store on Feb. 1, 2023, in New York.Leonardo Munoz / VIEWpress/Corbis via Getty Images

Still, there’s evidence that the economy is indeed slowing down. Monday, the New York Federal Reserve reported that the median expected growth in household income dropped from 4.6% to 3.3%. That is the largest one-month drop in the nearly 10-year history of the survey.

In other words, U.S. households are not only expecting a slowdown in income; they also expect that slowdown to be quite large.

And after seeing a surge in January, gas prices have already reversed course and are now nearly $0.06 lower than where they were a week ago.

But those changes weren’t going to be reflected in January’s price data. And it’s not clear whether they are the start of a new trend.

So, the Federal Reserve is going to hold those interest rates up a while longer.

“There has been an expectation that it [inflation] will go away quickly and painlessly — and I don’t think that’s at all guaranteed; that’s not the base case,” Powell said last week.

“The base case for me is that it will take some time, and we’ll have to do more rate increases, and then we’ll have to look around and see whether we’ve done enough.”

This post appeared first on NBC NEWS