Archive

2023

Browsing

Chicago Mayor Lori Lightfoot vowed to remove the homeless encampment at Chicago O’Hare International Airport being blasted by Democratic Chicago Alderman Raymond Lopez. The city’s Alderman sounded the alarm about Chicago’s spiraling homelessness crisis on ‘Tucker Carlson Tonight.’

‘We absolutely fundamentally cannot have people sleeping in our airports who are homeless,’ Lightfoot, who is facing re-election, assured reporters in a press conference on Thursday. 

‘That is unacceptable. We are going to continue, within the bounds of the law, to do what is necessary to provide those folks with support but elsewhere. They can’t be in our airports.’ 

Lightfoot, who has previously been criticized for her handling of crime and homelessness, among other issues facing the Windy City, is locked in a tight re-election race. Democrat Paul Vallas maintains a lead over the incumbent mayor, according to recent polls. 

In the Democrat’s remarks, Lightfoot assured Chicagoans that her office is aware of the seriousness of the situation and is working on a solution.

‘The fact of the matter is, we have taken and will continue to take the steps that are necessary to move people out of the airports,’ Lightfoot said. ‘The airports are a very different place than on the street, under an underpass. It’s a secure location, and the message is clear from me to the Department of Aviation, the Police Department up there.’

The controversial mayor also argued that the media has blown the issue out of proportion, stating, ‘They’re never going to portray our city in a favorable light.’

Last week, images depicting what many have dubbed the airport’s ‘homeless encampment’ prompted critics to point fingers at the mayor’s lack of leadership. The images and videos emerging from the international airport showed filthy homeless encampments and makeshift homes throughout airport terminals.

‘They’re not just urinating in the hallways,’ Lopez told Tucker Carlson on Wednesday. ‘They’re taking baths in the toilets there. They’re making a mockery of what Chicago is here, and we understand that homelessness is a problem we must address.’

‘But making O’Hare Airport a homeless shelter for hundreds of people on a daily basis, when we’re trying to welcome people here, when we’re trying to encourage tourism, bring back the business clientele, bring back families to our city, and to only have them greeted by hundreds of homeless who have mental health issues, may be armed, may be not even be clothed, that’s not something that institutes a lot of confidence in our mayor, in our city,’ he continued. 

Though the number of people seeking shelter at O’Hare in the winter months always increases, the homeless encampments this winter have increased sharply.

According to the Haymarket Center’s O’Hare Outreach program, which connects persons suffering from homelessness and seeking refuge at the airport with services, the outreach assisted 618 unhoused people at the airport in 2022, an increase of 58% from 431 in 2021. In 2022, Haymarket had 14,000 encounters with the unhoused, a huge increase over 2018, when 8,132 interactions were recorded with 392 persons.

On Wednesday, Thursday and Friday an increased police presence could be seen at the airport, with a cadre of officers stationed at the O’Hare Blue Line stop inside the airport. 

On Wednesday evening, officers could be seen asking people coming into the airport to show their airline tickets or work IDs. 

The law enforcement source said some of the unhoused people have displayed ‘erratic and confrontational behavior.’ That’s raised safety concerns for both passengers and employees, including maintenance workers and parking lot attendants who have recently been attacked.

Video

Four years ago, Lightfoot made history as the city’s first Black woman and first openly gay person to serve as Chicago mayor. Now, the mayor is up for re-election and is facing scrutiny amid concerns about continuing high crime in the nation’s third-largest city.

Ahead of the Feb. 29 mayoral election, Lightfoot faces a crowded race with nine other candidates vying for her position.

During her campaign, the mayor has been forced to go on the defensive in regard to heightened crime and homelessness under her leadership.

‘We have started to change Chicago around for the better,’ Lightfoot said during a recent debate. ‘I want to finish the job that we have started.’

In 2022 alone, major crime reports up 41% in 2022 and Chicago police staffing down 12% since she became mayor.

Lightfoot’s office did not immediately respond to Fox News Digital’s request for comment.

Fox News’ Bailee Hill contributed to this report.

This post appeared first on FOX NEWS

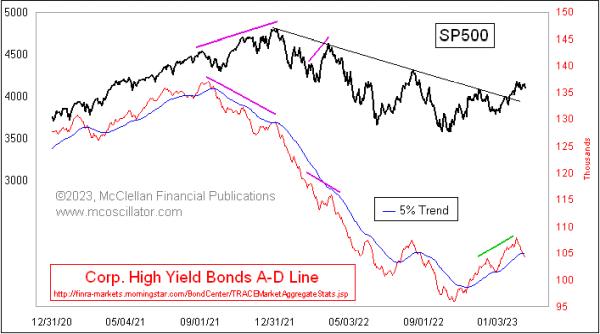
Early in 2023, the S&P 500 broke out above the year-long downtrend line that everyone has been watching, and it has been struggling a little bit in February 2023 trying to extend that breakout. While it looks like just a pause for the S&P 500, the underlying weakness is evident when we look elsewhere, especially among the investments which are the most vulnerable to liquidity problems, the high-yield corporate bonds.

HY bonds trade more like the stock market than like Treasury bonds, because HY bonds are subject to the same vicissitudes of financial market liquidity waxing and waning. FINRA publishes the data on advances and declines every day here, and it can give useful insights for the stock market. One can even make the case that the HY Bond A-D Line serves as a better canary in the coal mine than the composite NYSE A-D Line.

This A-D Line started showing us a big bearish divergence in late 2021, even ahead of the pretty big divergence in the NYSE’s A-D Line. That bearish divergence correctly foretold the awful market weakness we endured in 2022.

There is no bearish divergence showing now, but we are seeing a suddenly weak HY Bond A-D Line. It peaked on Feb. 2, 2023, the same day as the S&P 500, but, since then, it has been falling almost daily and has now dropped below its 5% Trend. Having it below that exponential moving average (EMA) is what happens during price downtrends.

The message is that financial market liquidity has suddenly left the building, and that this is going to come around and bite even the big-cap stocks. They can muscle aside the little guys for a while, like the big pigs at the feeding trough, but eventually it affects them too. The vulnerable ones are more useful in this respect, showing us that the liquidity is drying up ahead of time.

We got the little pullback to SPY D21 correct last week, which left us wondering if it was going to be major support, or just minor support before the bigger pullback. In this week’s edition of Moxie Indicator Minutes, TG will show you what signs he sees that indicate we could be on the verge of a bigger pullback.

This video was originally broadcast on February 17, 2023. Click this link to watch on YouTube. You can also view new episodes – and be notified as soon as they’re published – using the StockCharts on demand website, StockChartsTV.com, or its corresponding apps on Roku, Fire TV, iOS, Chromecast, Android, and more!

New episodes of Moxie Indicator Minutes air Fridays at 12pm ET on StockCharts TV. Archived episodes of the show are available at this link.

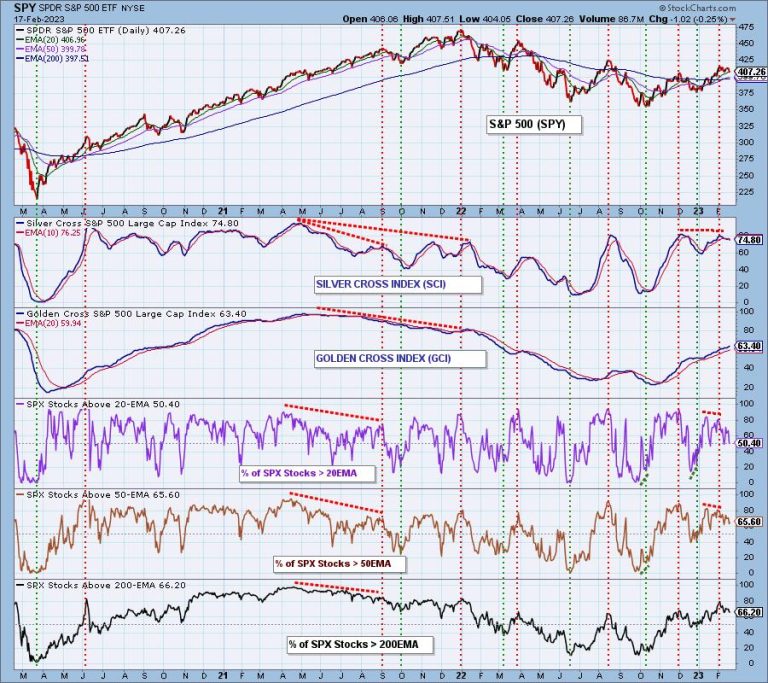
The market is currently topping because the Silver Cross Index (SCI), which expresses intermediate-term participation, is overbought and topping. A Silver Cross is when the 20EMA of a price index crosses up through the 50EMA. The Silver Cross Index shows the percentage of stocks in a market or sector index that have a made a Silver Cross. The SCI currently has a reading of 75 percent, having fallen from a top of about 80.

On the chart below we also have the source indicators for the Silver Cross Index. The Percent Stocks Above 20EMA reads 50 percent, and the Percent Stocks Above 50EMA reads 66 percent. If this configuration is maintained, the SCI will necessarily fall to about 66. Such a drop in participation will likely have a negative effect on price.

The Golden Cross Index (GCI) tracks the percentage of stocks in the index with a Golden Cross, which is when the 50EMA crosses up through the 200EMA. This is an expression of long-term participation. Currently the source indicators show the Percent Stocks Above 50EMA at 66 percent, and the Percent Stocks Above 200EMA at 66 percent. If this configuration is maintained, the GCI has no upside potential.

DecisionPoint tracks the Silver Cross and Golden Cross Indexes for 25 market indexes, sectors and industry groups, and we publish this table in the DecisionPoint ALERT weekly.

CONCLUSION: Deterioration of participation (the SCI) is likely to cause further price decay in the intermediate-term, which will likely see stalled long-term participation (the GCI) begin to decline as well.

Watch the latest episode of DecisionPoint on StockCharts TV’s YouTube channel here!

Technical Analysis is a windsock, not a crystal ball. –Carl Swenlin

(c) Copyright 2023 DecisionPoint.com

Helpful DecisionPoint Links:

DecisionPoint Alert Chart List

DecisionPoint Golden Cross/Silver Cross Index Chart List

DecisionPoint Sector Chart List

DecisionPoint Chart Gallery

Trend Models

Price Momentum Oscillator (PMO)

On Balance Volume

Swenlin Trading Oscillators (STO-B and STO-V)

ITBM and ITVM

SCTR Ranking

Bear Market Rules

DecisionPoint is not a registered investment advisor. Investment and trading decisions are solely your responsibility. DecisionPoint newsletters, blogs or website materials should NOT be interpreted as a recommendation or solicitation to buy or sell any security or to take any specific action. Current

On this week’s edition of StockCharts TV‘s StockCharts in Focus, Grayson shows you how to optimize your investable universe, shrinking down the list of trading targets or investing candidates to a more manageable group that you can filter against. He’ll show you to build your investing universe directly into your advanced technical scans to make sure that you’re staying focused on the right group of securities. Plus, he’ll show you to create your own custom “universe” ChartList that you can scan against.

This video was originally broadcast on February 17, 2023. Click on the above image to watch on our dedicated StockCharts in Focus page on StockCharts TV, or click this link to watch on YouTube. You can also watch on our on-demand website, StockChartsTV.com, using this link.

New episodes of StockCharts in Focus air Fridays at 3pm ET on StockCharts TV. You can view all previously recorded episodes at this link.

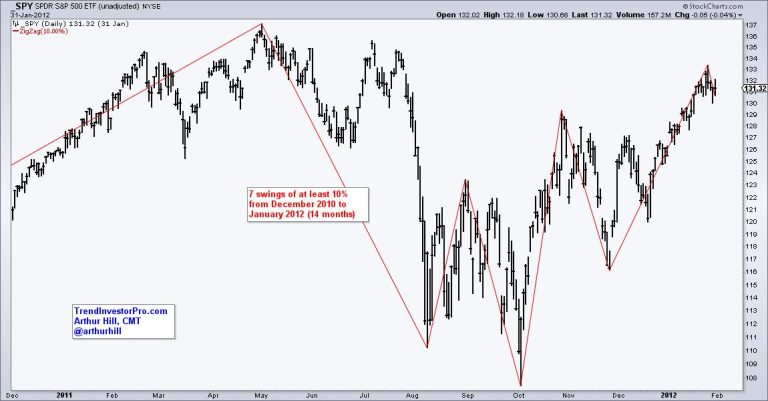
The S&P 500 SPDR (SPY) is a period of big swings and above average volatility. There were six swings of at least 10% from late January to early February 2023. Looking at other 12-14 month periods, this is the fourth most in the last 23 years. There were 13 in 2008, 8 in 2000 and 6 in 2011. 2008 marked the Global Financial Crisis, while 2000-2001 marked a bear market. 2011 was a chaotic period when the European Sovereign Debt crisis rocked the markets. Note that I am not using exact calendar years. I added a month or two of padding to show the general idea.


The chart below shows the swings from January 2022 to February 2023. Most recently, there was a 10% upswing from mid October to mid December and then an 8.8% downswing. This decline does not count as a 10% swing so the Zigzag did not draw a line down. This means the October to February swing is one big “zag” higher.  

So what does this mean? It means that volatility is above average, which increases the chances of a reversal and another big swing. SPY broke above its December high and has an uptrend working since October (higher low and higher high). Volatility remains a concern going forward and a short-term reversal at this point could lead to another sizable downswing. Friday’s report at TrendInvestor set the key levels to watch and two indicators for long-term signals. Short-term, SPY a falling flag is taking shape and a breakout at 415 would be bullish.

TrendInvestorPro is currently working with three quantified strategies for trading ETFs. We have a Bull-Bear Strategy trading the All Weather List, a Trend-Momentum Strategy Trading stock-related ETFs and a Mean-Reversion Strategy. Each strategy has a detailed article and signal tables are updated daily. Click here to learn more.

The Trend Composite, Momentum Composite, ATR Trailing Stop and eight other indicators are part of the TrendInvestorPro Indicator Edge Plugin for StockCharts ACP. Click here to learn more and take your analysis process to the next level.

—————————————

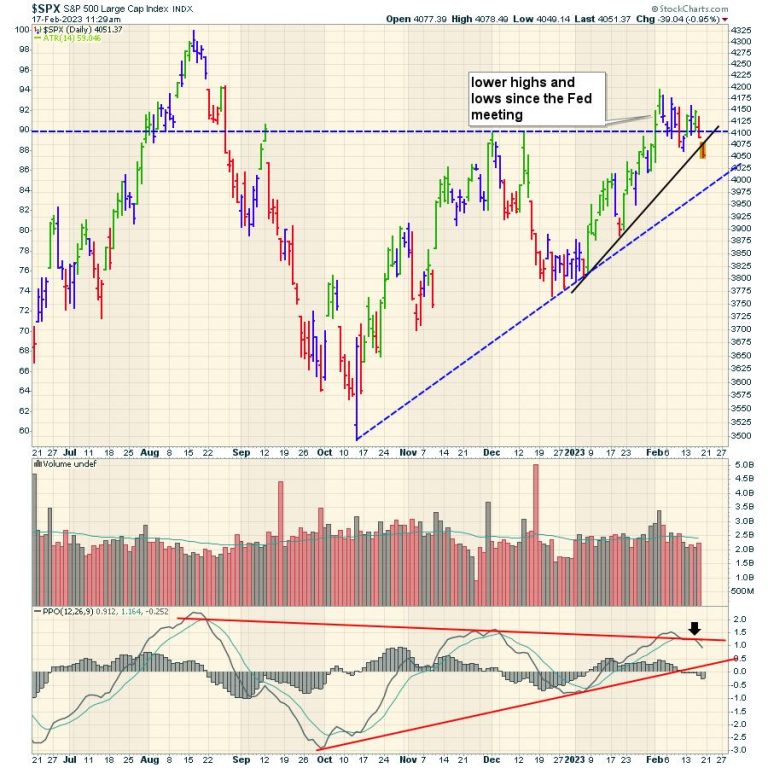
Every bull market always has something that is missing. The market starts in a narrow group of industries and broadens out. Since October, the market has been rallying. February has seen a sideways trend develop.

One of the big opportunities we are facing as a society is the rate of change moving from fossil fuels to electric. I continue to expect an oil supply short fall to be a problem as old fields expire and new exploration is not being pursued. Marginal production from reservoirs like the Bakken and Permian are topping out at this price level.

The chart of the exploration and production ETF is testing the uptrend line to end the week on options expiration day. Is there enough oil and gas demand to get this trend of lower highs since November to reverse? The larger picture shows declining volume suggesting investors are focused elsewhere for more gains.

The PPO has rolled over at zero and is in negative territory again. The PPO wave in January barely made it into positive territory. So far the chart looks concerning. Do we buy it on the test of the uptrend, or is the economy weakening under the surface, limiting demand and upside for the liquid energy industry group?

Globally we are seeing demand come off, with inventory builds starting to show up. Analysis groups like the IEA are predicting increased demand. In my opinion, it is very odd to see the oil charts come off especially with a tight supply backdrop, if the economy is as strong as we are seeing by labor and spending.

When we broaden out a little to the rest of the XLE, similar look, but testing the recent low. The uptrend seems clearly broken on this chart. The PPO rolling over at zero, suggesting more weakness ahead. Volume is declining. The PPO trend is being threatened right at the zero level.

For me, I keep wondering why isn’t energy part of the rally? That will continue to bother me. Oil is the world’s largest economic indicator so it needs to revert higher soon if this bull market is going to continue. If it doesn’t, is the Fed starting to succeed at slowing the economy? Good questions that we’ll know the answer to shortly.

The Nasdaq 100 and the S&P 500 are both closing near three week lows on the weekly chart. Stay tuned to see if the economy is weakening as oil suggests.

Roblox (RBLX) may still be considered by some on Wall Street as a relative “noob,” but the company’s plans and ambitions are catching the attention of investors as its most recent Q4 22 earnings and guidance laid out a much clearer picture of its perceived arena.

Bricks Beyond the Game Space

In the past quarter of 2022, Roblox missed analyst expectations on earnings per share but beat consensus on revenue. The company reported 58.5 million daily users, a 19% increase of new “Robloxians” year-over-year. 

But the most exciting thing is what it revealed about its playbook moving forward. During its quarterly analyst conference call, CEO Dave Baszucki emphasized the advantage of being able to focus on “one product, one platform.” And with that singular platform, Roblox aims not only to expand its geographical and “age” reach, but beyond the gaming space toward education, concerts, and (general) communication. And with hardly any cash burn in 2022, the company sees acceleration as it heads into the first quarter of 2023. 

The technicals appear to paint a similar picture.

The Technical Picture

In the last week, Roblox’s StockCharts Technical Ranking (SCTR) score made a drastic jump from below 10 (Oof!) to 84.1, although it dropped a bit since then.

Chart source: StockCharts.com. For illustrative purposes only.

Let’s take a look at the Roblox stock chart below. What do you see?

CHART 1: ROBLOX STOCK PRICE. A breakaway gap after earnings, a reverse head and shoulders pattern, and a potential Golden Cross are three things Roblox stock has going for it. Chart source: StockChartsACP. For illustrative purposes only.

A Breakaway Gap. RBLX jumped over 31% the day after earnings forming a breakaway gap above its 41.58 hurdle (resistance). If you’re not familiar with this term. Breakaway gaps are pretty exciting events if only because it’s fascinating to see an asset’s price catapult itself beyond a level of congestion or trading range. But the congestion area, itself, is also pretty interesting, and that leads to the next point.

A Reverse Head & Shoulders. Take a look at November 21 – 30, December 23, and January 24. This should correspond respectively, to an LS, H, and an RS—in short, a reverse head and shoulders pattern. The neckline is a little messy but it also corresponds to the gap space, which often gets filled or retested. 

Recovering from a Death Cross? RBLX experienced a Death Cross event on Valentine’s Day 2022 (no love from Wall Street last year). The 50-day moving average (MA) is still below the 200-day MA. But with RBLX’s newfound momentum, you might want to pay attention to see if a Golden Cross might be on the horizon.

Chaikin Money Flow. A great indicator for estimating buying/selling pressure, the Chaikin Money Flow indicator has been in the green (above the zero line) since early December. Though it threatened to get “pwned” (in Roblocian speak) toward negative space in the day before earnings, the indicator spiked following RBLX’s jump in price. Note a slight divergence in price and money flow reading. Technically, the divergence gives us a warning signal that price is bound for a potential pullback. It’s possible, especially considering the gap and the H&S neckline, but now you have to weigh this against the company’s guidance, fundamentals, and market sentiment, which currently seems bullish.

Trading Roblox Stock

If you’re looking to open a position in RBLX, note the technical conditions mentioned above. Plus the range between 29.45 and 30.65 seems to be appropriate stop-loss levels if you’re going long (those are the “shoulder” lows). If you’re basing your trading decision on the fundamental picture, be sure to bear in mind the latest producer price index (PPI) and consumer price index (CPI) reports. Both came in hotter than expected. And the PPI threatens a delayed response in transferring cost increases from manufacturers to consumers. In short, the Fed is likely to continue raising rates. More importantly, the broader market may react negatively to this news. And when the broader market falls, it tends to take most assets with it.

Disclaimer: This blog is for educational purposes only and should not be construed as financial advice. The ideas and strategies should never be used without first assessing your personal and financial situation, or without consulting a financial professional.

A group of Tesla workers in Buffalo, New York, have filed a complaint with the National Labor Relations Board accusing the electric carmaker of firing at least 30 workers in response to their union organizing efforts.

In a release, the group that calls itself Tesla Workers United, accuses Tesla and CEO Elon Musk of retaliating in direct response to the unionization drive, launched Feb. 14 at Tesla’s Buffalo Gigafactory 2. The affected workers are part of the Buffalo location’s autopilot group, where they ‘train’ Tesla’s artificial intelligence software by identifying images.

The group is asking for a federal injunction to protect the workers’ rights.

A Tesla representative could not be reached for comment.

The Tesla factory in Buffalo, N.Y., on Dec. 26, 2018.Andrew Harrer / Bloomberg via Getty Images file

The union drive is being spearheaded by a Rochester, New York-based unit of Workers United, which is an affiliate of the larger Service Employees International Union. Workers United is also the group that has been attempting to organize Starbucks locations.  

The NLRB has the power to order an employer to reinstate workers with back pay, though it cannot assess penalties. Tesla was cited in 2021 by the NLRB on accusations of ‘coercively interrogating’ and ‘threatening’ employees at its Fremont plant. The company was ordered to offer to reinstate a fired worker; Tesla has denied wrongdoing and is appealing the citation.

According to Tesla’s website, the Buffalo Gigafactory has created nearly 800 jobs, with plans to ultimately employ as many as 5,000.

This post appeared first on NBC NEWS

Tesla is recalling 362,758 vehicles because a version of its ‘full self-driving’ software may increase the risk of crashes, according to the National Highway Traffic Safety Administration in response to a notice Tesla sent the agency on Wednesday.

According to the recall document, the FSD’s ‘beta’ release may cause affected Tesla vehicles to act unsafely around intersections. For example, it said, the software may cause the vehicles to travel ‘straight through an intersection while in a turn-only lane, [enter] a stop sign-controlled intersection without coming to a complete stop, or [proceed] into an intersection during a steady yellow traffic signal without due caution.’

In addition, it said, the system may not respond sufficiently to changes in posted speed limits, ‘or not adequately account for the driver’s adjustment of the vehicle’s speed to exceed posted speed limits.’

As a remedy, Tesla is releasing a free over-the-air software update to users.

The recall affects 2016-2023 Model S and Model X vehicles; 2017-2023 Model 3 vehicles; and 2020-2023 Model Y vehicles.

The recall comes a week after the National Transportation Safety Board said it found no evidence that Tesla’s autopilot driver-assistance feature was engaged at the time of a fatal 2021 crash in Texas.

But Tesla’s FSD and autopilot features remain under investigation by the NHTSA. According to Reuters, 830,000 vehicles are under review.

And last month, Tesla revealed in a Securities and Exchange Commission filing that the Justice Department had requested documents related to the features.

A Tesla representative could not be reached for comment.

Tesla shares have been among the best-performing stocks this year, having nearly doubled in price to about $211 after falling 32% over the past 12 months. In January, the company reported profits and revenues that beat analysts’ expectations, with CEO Elon Musk stating that January had seen ‘the strongest orders year-to-date ever in our history.’

This post appeared first on NBC NEWS