Archive

2023

Browsing

Getting North Carolina legislators to formally call for a convention to consider creating amendments to the U.S. Constitution is the way forward to rein in an ever-expanding federal government, former U.S. Sen. Rick Santorum said Wednesday.

Santorum joined House Speaker Tim Moore and other chamber Republicans at a Legislative Building news conference to back a renewed effort for the state to advance the creation of a ‘convention of states.’

A proposed joint resolution filed this week in the House would formally seek the convention, which the Constitution says needs support from 34 states to happen. Nineteen states have passed convention resolutions so far, according to the Convention of States group that lobbies for the idea.

Previous proposals have had mixed results in recent years in the state House and have made little headway in the Senate.

This week’s proposal would limit any convention to considering amendments to address fiscal restraints and power limitations upon Washington and term limits. A convention bill introduced by Moore focusing solely on term limits was filed last week.

The U.S. government is running up more debt than ever and exerting more power upon individuals, leading to divisions within the country, according to Santorum, a Pennsylania Republican and senior adviser to the Convention of States.

‘Washington is never going to fix itself,’ Santorum said, surrounded by legislators and local convention advocates. ‘There is only one mechanism available in the Constitution — and I would say anywhere — to stop this problem from getting to the point of breaking and that rests in the power of the men and women behind me.’

Some opponents argue that a convention would lead to a free-for-all of amendments that could lead to extreme changes to the U.S. system of government.

But Santorum said that since approved amendments have to be ratified by 38 states to be enacted, convention attendees would be careful to advance proposals that have gained broad consensus.

Moore said he expected both proposed resolutions to make their way through the House. Senate leader Phil Berger knows that a convention application is a priority of House Republicans and could figure into negotiations later this year, Moore said.

A joint resolution isn’t subject to Democratic Gov. Roy Cooper’s veto.

This post appeared first on FOX NEWS

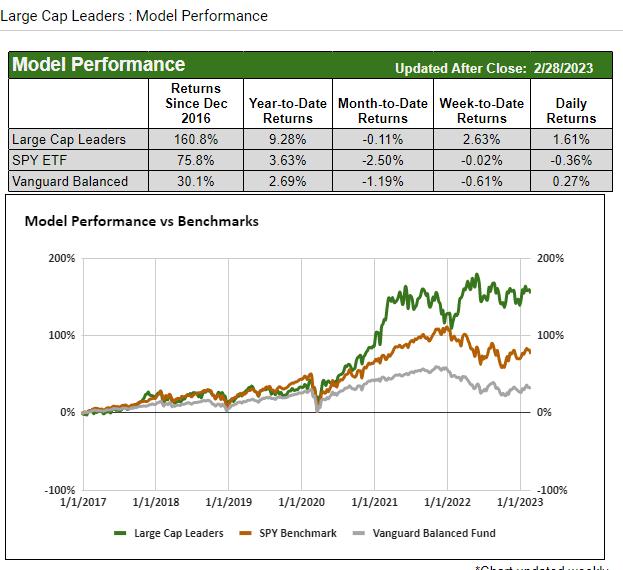
Why are Large Cap Leaders leading?

While the major indices still try to sort out the next interest rate direction, soft, hard or no landing, and/or if inflation has peaked, a few stocks have dominated. Companies like Steel Dynamics (both holdings in the quant model) are in the manufacturing and infrastructure sectors.

“Existing programs sponsored by the industry and government, such as Partnership for a New Generation of Vehicles, Aerospace Industry Association, USFEAST or AMTEX, or an industry-sponsored program such as the National Electronic Manufacturing Initiative, fall into the framework categories of advanced manufacturing systems and advanced manufacturing processes and equipment.” — National Academic Press

In the current environment, manufacturers are reliant on infrastructure for receiving and then delivering raw materials in a timely fashion. Furthermore, the scarcer the supply of raw materials, the more expensive it is for manufacturers and consumers. To date, stocks GE and STLD have rallied and withstood rising costs.  

The beauty of quants is they do the math without judgement.

Steel Dynamics (STLD) may be on the verge of another breakout after a month of price consolidation.

STLD, according to our Triple Play, outperforms the benchmark. And the real motion momentum indicator shows momentum improving but not yet wowing. Wednesday’s close was the all-time highest close in STLD. With indices red to flat, that is incredible. This and Century Aluminum (CENX) featured earlier this week, are proof that commodities are still not only a thing — but THE thing.

And don’t forget to read the Daily we published over the weekend on Energy and Oil prices. That sector could be next!

MarketGauge’s mission is to bring you education and actionable investing ideas every day!

For more detailed trading information about our blended models, tools and trader education courses, contact Rob Quinn, our Chief Strategy Consultant, to learn more.

IT’S NOT TOO LATE! Click here if you’d like a complimentary copy of Mish’s 2023 Market Outlook E-Book in your inbox.

“I grew my money tree and so can you!” – Mish Schneider

Get your copy of Plant Your Money Tree: A Guide to Growing Your Wealth and a special bonus here.

Follow Mish on Twitter @marketminute for stock picks and more. Follow Mish on Instagram (mishschneider) for daily morning videos. To see updated media clips, click here.

Mish in the Media

Read about Mish’s article about the implications of elevated sugar prices in this article from Kitco!

While the indices remain range bound, Mish shows you several emerging trends on the Wednesday, March 1 edition of StockCharts TV’s Your Daily Five!

Mish joins Business First AM for Stock Picking Time in this video!

See Mish sit down with Amber Kanwar of BNN Bloomberg to discuss the current market conditions and some picks.

Click here to watch Mish and StockCharts.com’s David Keller join Jared Blikre as they discuss trading, advice to new investors, crypto, and AI on Yahoo Finance.

In her latest video for CMC Markets, MarketGauge’s Mish Schneider shares insights on the gold, the S&P 500 and natural gas and what traders can expect as the markets remain mixed.

Mish and Charles talk food inflation and the Metaverse on Making Money with Charles Payne!

ETF Summary

S&P 500 (SPY): 390 support with 405 closest resistance.Russell 2000 (IWM): MA support around 184. 190 has to clear.Dow (DIA): 326 support, 335 resistance.Nasdaq (QQQ): 300 the pivotal area, 290 major support, 284 big support, 300 resistance.Regional banks (KRE): 65.00 resistance, 61 support.Semiconductors (SMH): 228 support, 240 pivotal, 248 key resistance; 248 resistance 237 then 229 support.Transportation (IYT): 235 resistance as best Mod Fam performer and 228 support.Biotechnology (IBB): 125-130 new range.Retail (XRT): Weak sector now–here comes more signs of stagflation.

Mish Schneider

MarketGauge.com

Director of Trading Research and Education

February, according to the Stock Trader’s Almanac 2023, tends to be a weak month, especially in pre-election years. Now that February is behind us, does it mean the worst is over? Not necessarily. Each year comes with unique scenarios and challenges; this year, all else being equal, a huge worry is that the Fed’s attempt to tame inflation may not work as planned. Recent economic data has been sending mixed messages, making it difficult to see stock market directionality.

Stock Market in Holding Pattern

Earnings season is winding down and estimates, in general, were down compared to last year. We also got February’s Consumer Confidence Index, which came in weaker than expected. And the Case-Shiller National Home Price Index for December indicated a deceleration in home prices. The Manufacturing Purchasing Managers’ Index for February came in at 47.7%, slightly lower than estimates. A reading less than 50% indicates contraction. 

None of these pieces of data moved the markets much. Inflation is still way above the Fed’s 2% target. Until there’s some certainty about how prices could move, the stock market will probably continue to be rattled. There’s talk about the possibility of a 5.4% terminal rate, which is higher than the 5% a month ago. It’s a similar story across the pond, with expectations for an ECB terminal rate of 4% by early 2024.  

Given the jittery macroeconomic backdrop, how long before we see tailwinds or headwinds that can break the market’s holding pattern? Given that the next Fed rate decision isn’t till March 22, we could still be a few weeks out. And in the stock market, that can feel like eternity.

A Technical Perspective of the Stock Market

If you pull up a daily chart of the S&P 500 index ($SPX), you’ll see a few points that are worth noting (see chart below). Note: Click on chart for live version.

CHART 1: S&P 500 INDEX STILL HOLDING SUPPORT. The 200-day moving average is a support level to watch as investors await jobs data and the next Fed meeting. Chart source: StockCharts.com. For illustrative purposes only.

The S&P 500 is in critical territory. It’s hovering close to hitting its 200-day moving average support; there’s a chance the index could bounce off the support and move more sideways until some certainty surfaces. When that happens, it could break out either to the upside or downside of its trading range. If the S&P 500 breaks below the 200-day moving average, the next support level could be the 50% retracement level from the August high to the October low. That would bring the S&P 500 to around the 3,900 level.The downtrend that started on February 2 is still intact. If there’s a bounce off the 200-day moving average and a break above the downward-sloping trendline, it could mean the market could trade sideways between 3,940 and 4,000. On the flip side, the downtrend could continue if the S&P 500 falls lower.

Market Breadth Indicators: Pick Up the Clues

It may help to watch market breadth indicators to see if there are shifts in investor sentiment. Are investors becoming more bearish? What about institutions? There are several market breadth indicators available in the StockCharts platform, including advance-decline indicators, bullish percent indexes, percent of stocks above a moving average, and so on. Some of these indicators give you the overall market breadth, but you can also focus on the breadth of specific sectors, industry groups, or indexes.

In the one-year daily chart of the S&P 500 Index below, you’ll see the McClellan Oscillator in histogram style and the S&P 500 bullish percent index. Not surprisingly, both indicators are showing negative breadth. The Fed is saying that the disinflationary process has started, yet inflation is still hot, the labor market is strong, and the economy seems to be growing less slowly than expected.

CHART 2: S&P 500 MARKET BREADTH INDICATORS. Indicators such as the McClellan oscillator and Bullish Percent Index can help identify reversals in investor sentiment, which in turn could reverse market trends. Both indicators are showing bearish sentiment. Keep an eye on these for any changes. They could give clues for market direction.Chart source: StockCharts.com. For illustrative purposes only.

The McClellan Oscillator and Bullish Percent Index can stay in negative territory for a while. Both can be used to identify reversals in sentiment, which could indicate potential reversals in the overall market, sectors, or industry groups.

McClellan Oscillator. The ratio-adjusted McClellan Oscillator ($NYMO) indicates that there are more declining issues versus advancing issues. Keep an eye on any sign of divergence between the S&P 500 and the histogram bars.Bullish Percent Index. Typically, when the bullish percent index drops below 30%, that could indicate very bearish sentiment. The S&P 500 hasn’t reached that level yet, although it’s getting below the 50% threshold, which is a bearish sign. It’s coming close to the December 41.82 level, which could coincide with the 50% retracement level of the S&P 500, which is 3907.

Prepare For Any Scenario

The next jobs report could provide further clues about the state of the overall economy. But that isn’t till March 10. Until then, remain engaged with the market. There’s no better time to pull out your favorite indicators and run through different “what-if” scenarios. The charts provided in this article are a starting point, but explore other indicators and set up a ChartList for a “holding pattern” market, then scroll through those charts to see if anything jumps out. Maybe by the time the Fed makes its next interest rate decision, you’ll start seeing the wind blowing in some direction.

Disclaimer: This blog is for educational purposes only and should not be construed as financial advice. The ideas and strategies should never be used without first assessing your own personal and financial situation, or without consulting a financial professional.

If you trade, you must deal with bad times to get to the good. In this week’s edition of Trading Simplified, Dave discusses how Steven Pressfield’s “War Of Art” can help you to cope with these less-than-ideal conditions, and how you must continue to do the work to overcome “resistance.” Dave then shows his methodology in action by revealing a Mystery Chart, showcasing a new one, and discussing a recent “near miss” buy signal in the TFM 10% System. Then, using two live examples, he shows you how the TFM stuff, along with his hybrid money management system, can work very well in Crypto.

This video was originally broadcast on March 1, 2023. Click anywhere on the Trading Simplified logo above to watch on our dedicated show page, or at this link to watch on YouTube. You can also watch this and past episodes on the StockCharts on-demand video service StockChartsTV.com — registration is free!

New episodes of Trading Simplified air on Wednesdays at 12:00pm ET on StockCharts TV. You can view all recorded episodes of the show at this link. Go to davelandry.com/stockcharts to access the slides for this episode and more. Dave can be contacted at davelandry.com/contact for any comments and questions.

The Metals and Commodities stocks have been relatively outperforming the broader markets for a couple of months now. This was the period when the US Dollar Index (DXY) underwent a strong corrective move after testing the highs of 114.77 in September. The retracement in the Dollar Index was a bit severe. That meant strong moves in the metals and commodities stocks when DXY tested the lows of 100.80 in the early days of February this year.

The metals and commodities prices enjoy an inverse relation to the US Dollar. In simpler words, a strong Dollar is not good for the prices and in other words, a declining US Dollar is generally bullish for metals and commodities. So, while the DXY corrected from September 114.77 levels until the most recent low of 100.82 seen in early February, this period saw a strong performance from the metals and commodities stocks.

However, the US Dollar Index rebounded from the low of 100.82 to almost 105.50 and because of this, the metals and commodities stocks remained largely under pressure. However, the DXY has tested its most immediate resistance zone of 105.50-106 and if it retraces again from the current levels, we may see some respite in the metals and commodities stocks.

HINDALCO.IN

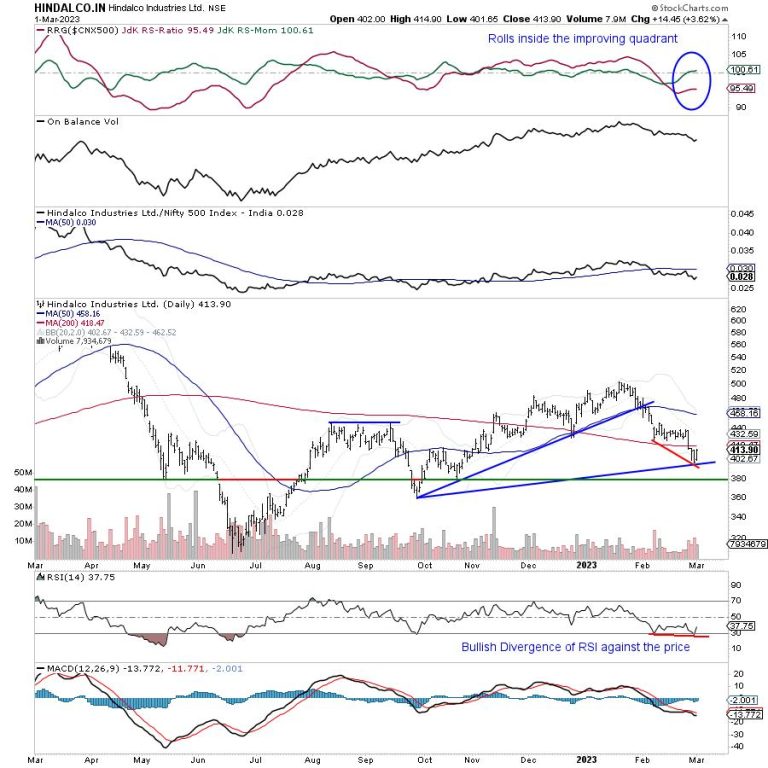
This large-cap metal stock had a roll when it rallied from the low of 306 formed in June 2022 to the high of 504 formed in January this year. Over the past four weeks, the stock has been under some corrective pressure. However, a few signs have emerged that hint at a potential bottom being put in place. This lays the ground for a likely technical rebound from the current levels.

The first turn on the downside saw the stock slipping below the 50-DMA which was almost acting as a proxy trend line for the stock. Subsequently, as the corrective move deepened, the stock also slipped below its 200-DMA which is presently placed at 418.

The most current phase of the down-move has come with a strong bullish divergence of the RSI against the price. This bullish divergence developed as the stock made lower bottoms but the RSI did not. The stock has also attempted to take support at a rising trend line pattern support; this trend line begins from the low of 358 and joins the subsequent higher bottom.

RSI otherwise remains neutral and does not show any divergence against the price. The stock has also rolled inside the improving quadrant of the RRG when benchmarked against the broader NIFTY500 Index. This points to a likely beginning of a phase of relative outperformance of the stock against the benchmark, i.e., the broader markets.

The RS line against NIFTY500 has flattened but has not started to rise as yet. This may improve with the likely improvement of the relative performance of the stock.

If the current technical setup resolves on the expected lines and if the technical rebound does take place, then it may see the stock testing 440-445 levels in the coming days. Any close below 377, though, will negate this view.

Foram Chheda, CMT  

and

Milan Vaishnav, CMT, MSTA | Consulting Technical Analyst | www.EquityResearch.asia | www.ChartWizard.ae

The Indian equities have been quite jittery over the past couple of weeks. Broadly speaking, the headline index NIFTY50 ($NIFTY) has seen itself oscillating between 50-DMA and 200-DMA during February. These DMAs are placed at 17885 and 17302 respectively. Lately, the index has made strong attempts to hold the 200-DMA as a support on a closing basis. Despite some intermittent violations of this important level, it is crucial that NIFTY holds this support on a closing basis.

Meanwhile, this Indian engineering multinational which is providing sustainable solutions in the areas of energy and the environment is showing a strong technical setup and hints at a likely upward revision of price over the coming days.

THERMAX.IN

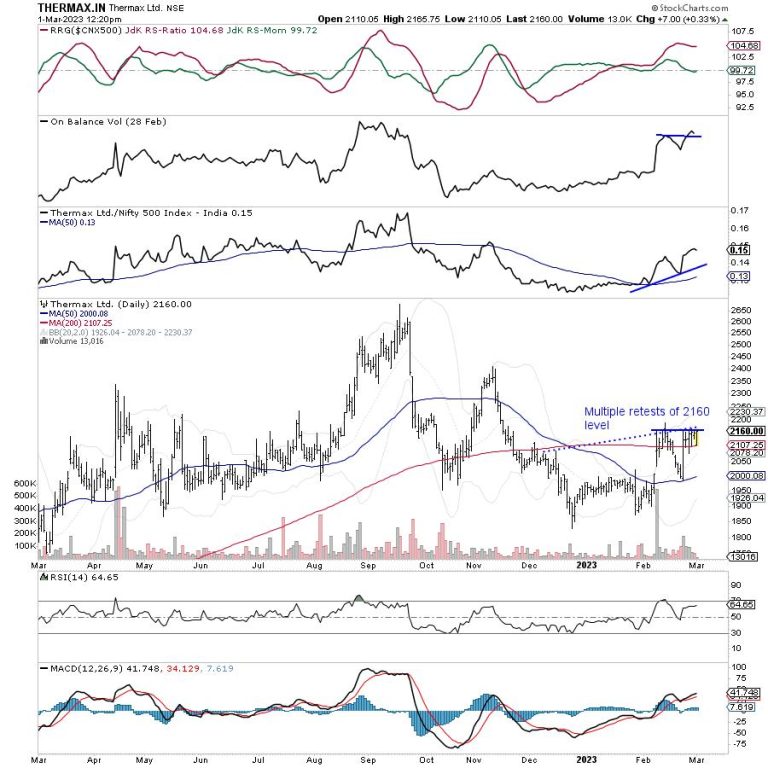
From the lows that were formed near 700 levels in the last quarter of 2020, THERMAX had a great run; the rally that followed saw the stock returning over 286% from those levels. It marked its high at 2607 in September last year. The recent price action shows that the stock may be in for some resumption of the up-move again.

After the stock peaked just above the 2600 level in September, the stock witnessed a corrective downtrend. The retracement that followed saw the stock slipping below its 200-DMA. After struggling to keep its head above this point, the stock did see some recovery. However, this recovery halted at 2400 where the stock formed its lower top. The stock has grossly underperformed the broader markets after that, it stayed under corrective decline and has made a strong attempt to form a base near 1830 levels.

The most recent price action shows the stock trying to stage a reversal after putting a potential bottom in place between 1830 and 2000 levels. It has also crossed above the 50-DMA and 200-DMA; they currently stand at 2000 and 2107 respectively.

The stock is seen consolidating just below the 2160 level; any convincing move above this point is likely to see a meaningful appreciation in the price.

The RSI is neutral and does not show any divergence against the price. The weekly RSI is seen breaking out from a formation and moving higher. The MACD is above the signal line and stays in continuing buy mode. The RS line against the broader NIFTY500 index is seen moving higher on both daily and weekly timeframes; it has also crossed above its 50-period MA.

Importantly, while the stock consolidates below the resistance point of 2160, the On-Balance Volume (OBV) has already surpassed its previous most immediate high point. This confirms the participation of volumes in the move and also hints at accumulation in the stock at current levels.

If the resolution of this technical setup occurs on the expected lines, the stock may go on to test 2350–2375 levels over the coming days. This would translate into potential returns of ~9.50% from the current levels. Any close below 2000 would negate this technical setup and view.

Foram Chheda, CMT 

and

Milan Vaishnav, CMT, MSTA | Consulting Technical Analyst | www.EquityResearch.asia | www.ChartWizard.ae

Disclosure pursuant to Clause 19 of SEBI (Research Analysts) Regulations 2014: The analyst, Family Members, or his Associates holds no financial interest below 1% or higher than 1% and has not received any compensation from the Companies discussed.

The securities discussed and opinions expressed in this report may not be suitable for all investors, who must make their own investment decisions, based on their own investment objectives, financial positions, and the needs of specific recipients. This may not be taken in substitution for the exercise of independent judgment by any recipient. 

The recipient should independently evaluate the investment risks. The value and return on investment may vary because of changes in interest rates, foreign exchange rates, or any other reason. Past performance is not necessarily a guide to future performance. The usage of the Research Reports and other Services are governed as per the Terms of Service at https://equityresearch.asia/terms-of-use

The Research Analyst has not managed or co-managed the issues of any of the companies discussed and has not received any such remuneration from such activities from the companies discussed.

The Research Analyst has not received any remuneration from the Merchant Banking activities.

The Research Analyst has adopted an independent approach without any conflict from anyone. The Research Analyst has not received any compensation or other benefits from the companies mentioned in the report or third parties in connection with the preparation of the research report.

Compensation of the Research Analysts is not based on any specific merchant banking, investment banking, or brokerage service transactions.

The Research Analyst is not engaged in a market-making activity for the companies mentioned in the report.

The Research Analyst submits that no material disciplinary action has been taken on him by any Regulatory Authority impacting Equity Research Analysis activities.

This report is not directed or intended for distribution to, or use by, any person or entity who is a citizen or resident of or located in any locality, state, country, or other jurisdiction, where such distribution, publication, availability, or use would be contrary to law, regulation or which would subject the Research Analyst to any registration or licensing requirement within such jurisdiction.

Stuck is a word we have used a lot lately.

Some common synonyms for stuck are jammed, trapped, put, pushed, and caught.

Nasdaq is stuck, jammed, or whichever word one wishes to use. And that’s price. Traders are also trapped and caught, considering that the market breadth is stuck in the middle between healthy and ill.

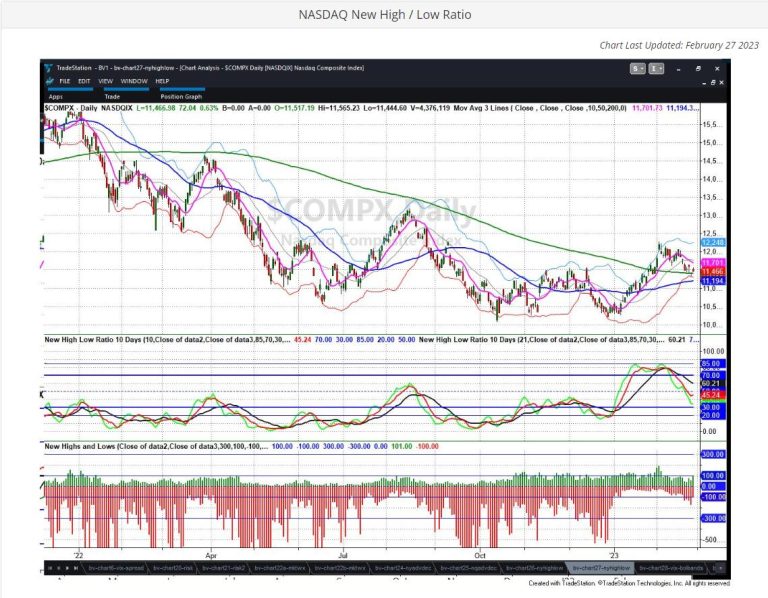
Our Big View product updates the market internals each day. This particular indicator shows the number of stocks reaching a new 52-week high relative to the number of stocks falling to a new 52-week low. A degree of finesse is required to read the current high/low ratio.

On a short-term basis, we were starting to get to oversold levels in NASDAQ. The 10-Day moving average (red line on the middle chart) flipped positive, meaning this February decline may be starting to turn up. Meanwhile, the 21-DMA (black line) is above 50%. When the value of the 21-DMA is above 70%, it is considered bullish, with over 85% being very bullish. When it is under 30%, it is considered bearish, very bearish under 20%. While NASDAQ got oversold on a shorter-term timeframe, the longer-term bias remains intact, as long as the 21-DMA is at or above 50%.

We are watching for a potential powerful bounce in NASDAQ, hence, bringing price back towards the higher end of the trading range and the 21-DMA closer to 70%.

Please also look at the bottom chart or the actual up/down ratio. On Monday, the 27th, there were an even number of red and green bars. In the weeks prior, the stocks going up outpaced the number of stocks going down. Now, once this market breadth chart updates, should the green bars rise above the red ones, then that is yet another positive sign for growth stocks and NASDAQ. And of course, the opposite is true-more red than green means market could remain stuck.

To see more of our Big View indicators and the breakdown of risk on/neutral/off, please check out our Sunday Market Outlook.

Finally, we featured Century Aluminum CENX in yesterday’s Daily, and it is up nearly 7% today.

MarketGauge’s mission is to bring you education and actionable investing ideas every day!

For more detailed trading information about our blended models, tools and trader education courses, contact Rob Quinn, our Chief Strategy Consultant, to learn more.

IT’S NOT TOO LATE! Click here if you’d like a complimentary copy of Mish’s 2023 Market Outlook E-Book in your inbox.

“I grew my money tree and so can you!” – Mish Schneider

Get your copy of Plant Your Money Tree: A Guide to Growing Your Wealth and a special bonus here.

Follow Mish on Twitter @marketminute for stock picks and more. Follow Mish on Instagram (mishschneider) for daily morning videos. To see updated media clips, click here.

Mish in the Media

Mish joins Business First AM for Stock Picking Time in this video!

See Mish sit down with Amber Kanwar of BNN Bloomberg to discuss the current market conditions and some picks.

Click here to watch Mish and StockCharts.com’s David Keller join Jared Blikre as they discuss trading, advice to new investors, crypto, and AI on Yahoo Finance.

In her latest video for CMC Markets, MarketGauge’s Mish Schneider shares insights on the gold, the S&P 500 and natural gas and what traders can expect as the markets remain mixed.

Mish and Charles talk food inflation and the Metaverse on Making Money with Charles Payne!

See Mish present “Best Trade, Worst Trade, Next Trade” on Business First AM.

Mish shares insights on the US Dollar, euro, gold and natural gas in this appearance on CMC Markets.

Mish shares three charts she is using to measure inflation using the commodities markets on the Wednesday, February 14 edition of StockCharts TV’s The Final Bar with David Keller!

Mish gives you some ideas of what might outperform in this new wave of inflation on the Friday, February 10 edition of StockCharts TV’s Your Daily Five. She has picks from energy, construction, gold, defense, and raw materials.

Read about Mish’s interview with Neils Christensen in this article from Kitco!

ETF Summary

S&P 500 (SPY): 390 support with 405 closest resistance.Russell 2000 (IWM): MA support around 184. 190 has to clear.Dow (DIA): 326 support, 335 resistance.Nasdaq (QQQ): 300 the pivotal area, 290 major support; 284 big support, 300 resistance.Regional banks (KRE): 65.00 resistance, 61 support.Semiconductors (SMH): 228 support, 240 pivotal 248 key resistance; 248 resistance, 237 then 229 support.Transportation (IYT): 235 resistance as best Mod Fam performer, 228 support.Biotechnology (IBB): 125-130 new range.Retail (XRT): 66-68 huge area to hold if the market still has legs.

Mish Schneider

MarketGauge.com

Director of Trading Research and Education

Nissan is recalling at least 712,458 vehicles in its Rogue line over an issue with malfunctioning car keys that can inadvertently cause engines to shut off.

The recall affects “S” grade trim level Nissan Rogue Sport and Nissan Rogue vehicles equipped with jackknife keys, including the 2017-2022 Nissan Rogue Sport and the 2014-2020 Nissan Rogue.

As a result of the defective keys, a driver could inadvertently make contact with it and turn the vehicle off while driving, increasing the risk of a crash, Nissan said.

While Nissan prepares a remedy for the issue, it said registered owners would be notified to avoid attaching accessories to key fobs, and to use the key in the ‘nonfolding’ orientation. Dealers and rental fleets will also be instructed to insert a fastener into the key slot that will prevent the key from folding.  

According to Autoweek, the Rogue was the eighth-best selling used vehicle of 2022. It is also a top seller for Nissan overall.

This post appeared first on NBC NEWS

MESA, Ariz. – Dansby Swanson, born and raised in Georgia, grew up watching his favorite players become legends, but somewhere along the way, money mudded the waters, and precious few finished their careers in Atlanta. 

It didn’t matter whether it was Hank Aaron or Tom Glavine or Andruw Jones or John Smoltz, none finished their careers in the organization. 

He was an eyewitness to Freddie Freeman’s painful departure a year ago when he became a free agent, and wound up with the Los Angeles Dodgers, sobbing as he talked about the breakup last summer. 

Now, here was Swanson’s turn at free agency. He was the hometown kid. The most popular among the fans. Their clubhouse leader. The ironman who missed only two games in three years. The player who earned his first All-Star berth, won his first Gold Glove, hit 25 homers and drove in 96 runs in 2022. And led Atlanta to its fifth consecutive division title.

Still, after everything he observed, he had to brace himself for the possibility that Atlanta could let him go, too, right, unwilling to bridge a gap in negotiations? 

“Well, yes, and no,’’ Swanson tells USA TODAY Sports. “I mean, I feel like ego gets in the way. They wouldn’t let me go, right? I’m a homegrown kid. I’ve kind of been leading this team for a while. I’m the center, glue of the team, like if there was ever anything going on, people would come to me.’’ 

COLUMN: Machado’s $350 million deal with Padres won’t end in disaster

But, just as Atlanta did with Freeman, made an offer to retain Swanson, but never budged, sticking to their six-year, $100 million proposal even when his peers in the free-agent class were getting massive deals. 

Considering shortstops Trea Turner signed for $300 million, Xander Bogaerts $280 million, Carlos Correa originally signing for $350 million before getting $200 million from Minnesota, he certainly deserved to be in their same financial neighborhood. 

“But at the end of the day, it is a business right?’’ Swanson says. “Things happen for a reason. I didn’t want to leave. I loved Atlanta. I still do. We accomplished a lot there, but I was pushing for even more. 

‘It’s just that I want to win so bad. I hate losing. Like I literally think we should win everything. I’m not saying we should go 162-0, but I’d like to. 

“So I wasn’t sure Chicago was the right place.’’ 

The Cubs ended their 108-year drought winning the 2016 World Series championship, but it has been five years since they won a postseason game. They have finished a combined 43 games out of first place the last two seasons. 

Swanson, in comparison, has been in the playoffs every year since 2017, winning the World Series championship in 2021, and 101 games last season.

The Cubs sat down with Swanson over the winter, talked about where the organization is headed, and let him know that they wanted him to be the centerpiece of their renaissance. 

The resistance slowly melted. 

“It became clearer and clearer of where I was supposed to be,’’ Swanson says. “Everything just fell in line. This is just such an amazing organization to represent. It’s a historic place, man. 

“This team means so much to so many people, which is very similar from the place I just came from. From the gist I’ve gotten so far, pro sports in Chicago are a massive deal. Pro sports in Atlanta are like, well, kind of a deal. 

“It’s not a knock against anything about Atlanta, trust me. I’m a huge Falcons’ fan and big Hawks’ fan, but it’s just different. Cubs fans, Cubs everything, is just a little bit different.’’ 

Besides, there was another compelling reason to go Chicago. 

His wife, Mallory (formerly Mallory Pugh), whom he married in December, is a star forward of the Chicago Red Stars of the National Women’s Soccer League where she has played the past two seasons. 

They will keep their home in Atlanta, where they still have family, but now will start house- hunting for another in Chicago where Swanson could be through 2029 with his new seven-year, $177 million contract. 

Mallory Swanson, 24, the youngest U.S. women soccer player to score a goal in the 2016 Olympics, and will play on the U.S. World Cup team this summer, just may continue her career in Chicago, too. League officials told her they would make every attempt to keep the two of them in the same city. 

Even if Swanson had signed with the Los Angeles Dodgers, they informed Mallory they would have made sure she’s traded her to Los Angeles, too. 

“This is technically her last season in Chicago,’’ Swanson says., “but they pretty much made a  promise that they would do right by her. Say I had signed with the Dodgers, they would have traded her to a team that’s in Los Angeles. They were very open to that. And since I’m in Chicago now, I think they’re going to be Ok keeping her around.’’ 

Still, they just weren’t convinced that Chicago was the right place, and spent a lot of time praying for guidance. 

SOCCER: Sports worlds collide for J-Rod, Dansby Swanson with significant others

“It’s funny like before Chicago, we were both kind of like I don’t know,’’ he said. “She said, ‘I don’t know if I want to there.’ I said, ‘I don’t know if I want to be there.’ But the more we prayed about it was like, ‘Chicago is where we’re supposed to be.’ Looking back, things just started falling to place than makes a lot of sense now.’’ 

Certainly, Swanson’s arrival boosts soccer’s popularity in the clubhouse, with the players knowing that Mallory has scored goals in six consecutive games, including game-winners in the last two. 

“It’s been so fun to watch, being able to love and support her through her journey,’’ Swanson says. “It’s pretty freakin’ cool. It’s so cool to see her transformation because she’s come a long ways. 

Swanson, 29, has grown to love the sport, learning the nuances, the teamwork involved, the strategy on plays. They dissect each game together, and even share the same trainer in the off-season. 

“She’s having fun and with all of her natural ability, you get to that point where you learn how to be a professional,’’ Swanson says. “It’s a fun thing to see how much these girls do, and what they go through, it’s pretty amazing.’’ 

It was soccer that brought them together in the first place. Swanson, who attended Vanderbilt, was friends with Cheyna Williams, who played on Vandy’s soccer team, and later played on the Washington Spirit soccer team with Mallory. Well, one day Cheyna came to one of Swanson’s games, brought along Mallory, and they met for the first time in 2017. 

The off-season comes around, and Mallory’s sister, Brianna, got married, who happened to be second baseman Jace Peterson, Swanson’s teammate in Atlanta. They reconnected at the wedding, Swanson visited Mallory in Colorado before spring training in 2018, and the two have been together ever since. They married Dec. 10 in Greensboro, Georgia, and spent their honeymoon figuring out where Swanson was going to spend the rest of his career. 

“She came with me to a couple of meetings with teams,’’ Swanson says, “that was before the wedding. They kept calling, but it was wedding weekend. I was like, ‘Hey, I know this is in the middle of the winter meetings, but sorry, we have to focus on the wedding.’’’ 

They went off to their honeymoon, and in between catching rays and waves on the beach, tried to decide just where they wanted to be. 

“We don’t always understand why things happen, but things happen for a reason,’’ Swanson says, ‘and we just felt like this is where our home for the next seven years is supposed to be.’’ 

Now, here they are, Chicago’s power couple, with Mallory playing in the World Cup this summer and Swanson trying to get the Cubs back into the postseason, with the two vowing never to look back. 

Swanson sat down with Freeman and Jason Heyward, his two close friends and former teammates in Atlanta, who provided to ease the transition . 

“They basically just told me to keep an open mind,’’ Swanson said, “and just embrace being around your new teammates, really invest in the people that you’re with. The beautiful part here is just with my personality, it’s very easy to get invested into the group of guys that we have.’’ 

Cubs manager David Ross has seen the leadership skills surface since he walked through the clubhouse doors, watching him slowly ingratiate himself with his new teammates, and really being everything the Cubs could have imagined. 

“You definitely see those leadership skills, that winning mentality,’’ Ross says. “All he talks about is what it takes to win. He’s very committed and having conversations getting comfortable with how we do things here. He’s so tough mentally. 

“And besides, now we’re getting to know about soccer. We’re all talking about it more. You know she has winning goals in the last two games? She’s another winner who is now part of our Cubs’ family. 

“It’s going to a fun summer in Chicago.’’ 

Follow Nightengale on Twitter: @Bnightengale 

This post appeared first on USA TODAY

The Atlanta Falcons announced Tuesday they have released quarterback Marcus Mariota, a move that will save them $12 million on the salary cap and signal a new day at the position.

The Falcons hold the No. 8 pick in the 2023 NFL draft, where quarterbacks like Alabama’s Bryce Young and Ohio State’s C.J. Stroud likely will be the first off the board. Others like Florida’s Anthony Richardson and Kentucky’s Will Levis are also considered top QB prospects.

The Falcons also have 2022 third-round pick Desmond Ridder on the roster. He was was 2-2 as Atlanta’s starter with two touchdowns, no interceptions and a 49.6 quarterback rating in the final four games last season.

“We’re always going to leave every door open,” Falcons general manager Terry Fontenot said at the NFL scouting combine on Tuesday.

“So, draft, free agency, whether it’s the No. 8 pick in the draft or whether it’s at some other point in the draft, we could definitely bring in another quarterback.”

It’s Year 3 for Fontenot and Falcons coach Arthur Smith, who were both hired in 2021 but have been unable to fortify the quarterback position during their tenures with the franchise.

During the 2021 NFL draft, the Falcons used the No. 4 pick on tight end Kyle Pitts, while quarterbacks Trevor Lawrence, Zach Wilson and Trey Lance came off the board with the first three picks. Two other quarterbacks in Justin Fields and Mac Jones went later in the first round.

Longtime Falcons starter Matt Ryan played his final season with Smith in 2021 before being traded to the Indianapolis Colts.

In entered Mariota, the 2014 Heisman Trophy winner out of Oregon, who started the first 13 games for the Falcons last season before being benched for Ridder.

Mariota was 5-8, with the Atlanta offense failing to score more than 17 points in six of his starts.

Mariota had just three games with at least 200 yards passing during his time as Falcons starter. He completed 61.3% of his passes for 2,219 yards, with 15 touchdowns, nine interceptions and an 88.2 passer rating.

Last week, Netflix and the NFL announced a documentary that would feature Mariota’s season with the Falcons, along with Chiefs Super Bowl MVP Patrick Mahomes and Vikings starter Kirk Cousins set to premiere this summer.

This post appeared first on USA TODAY