Archive

2023

Browsing

The Georgia Supreme Court on Wednesday said it cannot decide yet whether to remove a state Court of Appeals judge accused of ethical misconduct and asked a judicial discipline panel to review the case further.

The three-member panel of the Judicial Qualifications Commission in January recommended that the state high court permanently remove suspended Court of Appeals Judge Christian Coomer. The panel’s report said he violated ethics rules on how a lawyer should treat a client and improperly used campaign funds for personal expenses.

The Supreme Court found that the panel made ‘at least two critical legal errors that prevent us from resolving the matter on this record.’ For that reason, it decided to send the case back to the panel ‘to make new findings in the light of the law as it actually exists, and to do so quickly.’

The Supreme Court said the panel made ‘two critical legal errors.’

First, it was wrong in its determination that the Judicial Qualifications Commission could pursue discipline for conduct occurring before a person becomes a judge or a judicial candidate, the opinion says.

Second, the high court justices wrote, the panel ‘failed to understand the circumstances in which the Constitution and our case law permits judicial discipline.’ The opinion says that actions taken outside of a judicial capacity ‘warrant discipline only when taken in bad faith.’ None of the counts against Coomer have to do with actions taken in a judicial capacity, and the panel’s report ‘was ambiguous as to whether it found the Judge Coomer acted with bad faith,’ the opinion says.

‘Intent was a matter of enormous dispute in this matter, and this Court is not well positioned to resolve the factual questions of intent that are crucial to determining whether discipline is constitutionally permitted,’ the opinion says.

For that reason, the high court wrote, it is sending the case back to the panel to resolve several questions. The justices instructed the panel to file a new report with the Supreme Court within 60 days.

This post appeared first on FOX NEWS

Mississippi Gov. Tate Reeves said Wednesday that he has vetoed two bills dealing with insurance because he thinks they would increase the cost of health care.

‘One is a bad idea, and I can’t see myself supporting it. One is a good idea that just includes some correctable mistakes,’ the Republican governor said in a statement.

Reeves said the ‘bad idea’ was in Senate Bill 2224, which would have given the state insurance commissioner the ability to set rates for all health insurance.

He said Senate Bill 2262 would have made changes to the prior authorization process that insurance companies use to tell providers whether a procedure or drug is covered. Reeves said he liked that the proposal would have required insurance companies to give quicker answers, but the bill would have had ‘unintended consequences.’

‘The bill has a number of technical components,’ Reeves said. ‘These include administrative hearings that are in an incorrect place, increased costs for Medicaid and other issues that cause me not to be comfortable signing it.’

Overriding a governor’s veto would take two-thirds majorities in the House and Senate.

This post appeared first on FOX NEWS

Below is an excerpt from today’s subscriber-only DecisionPoint Alert (Subscribers, forgive the repeat performance):

CRUDE OIL (USO)

IT Trend Model: SELL as of 2/2/2023

LT Trend Model: SELL as of 12/6/2022

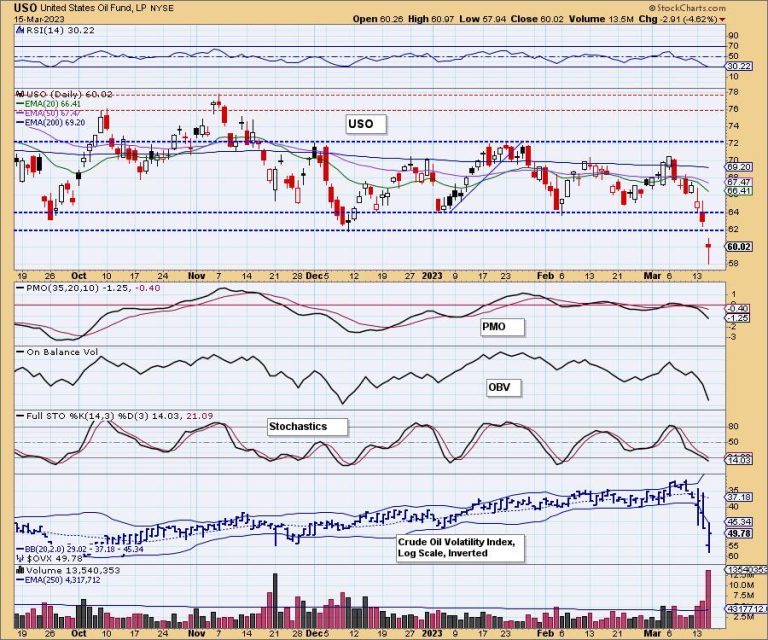
USO Daily Chart: USO obliterated support today and closed at New 52-Week Lows. There is a long tail on today’s candlestick which implies quite a bit of improvement occurred to pare down even larger losses. It is “hammer-like” so we could see at least a pause in this decline. The RSI, PMO and Stochastics all imply more downside. We do think a rebound is likely tomorrow based on the enormously high readings on the Crude Oil Volatility Index ($OVX).

We decided to include the weekly chart today so that we can see where new support might lie. Interestingly, USO’s low landed right on very strong support. There is still some room for $WTIC to drop lower. As bad as the daily chart looks we do find at least some comfort when we see how this support level sits on gap support from 2020, the 2021 high and end of year lows in 2022. The weekly PMO certainly doesn’t inspire confidence as it dipped into negative territory. If this support level is taken out, we would look for support around 50.00.

Conclusion: We see a likely rebound ahead for Crude Oil (USO) possibly just below current support levels based on $WTIC’s support level not being reached yet. However, if we don’t see improvement on the weekly chart, particularly the weekly PMO, we should expect prices to fall to at least the $50.00 level for USO.

Good Luck & Good Trading,

Erin Swenlin

Watch the latest episode of DecisionPoint on StockCharts TV’s YouTube channel here!

Technical Analysis is a windsock, not a crystal ball. –Carl Swenlin

(c) Copyright 2023 DecisionPoint.com

Helpful DecisionPoint Links:

DecisionPoint Alert Chart List

DecisionPoint Golden Cross/Silver Cross Index Chart List

DecisionPoint Sector Chart List

DecisionPoint Chart Gallery

Trend Models

Price Momentum Oscillator (PMO)

On Balance Volume

Swenlin Trading Oscillators (STO-B and STO-V)

ITBM and ITVM

SCTR Ranking

Bear Market Rules

DecisionPoint is not a registered investment advisor. Investment and trading decisions are solely your responsibility. DecisionPoint newsletters, blogs or website materials should NOT be interpreted as a recommendation or solicitation to buy or sell any security or to take any specific action.

When Larry talks, you listen.

It’s a great rule to live by. Anyone who has followed Larry Williams’ legendary work in the markets knows the expertise he brings and the value of his analysis. So, when Larry called and said “I’ve got thoughts to share and charts to show, and I want the people of StockCharts to know what I’m seeing”, the StockCharts TV team jumped right into action.

As volatility continues to grip the markets and the battle between bulls and bears rages on, Larry shares his detailed analysis of what’s really happening beneath the surface and explains his next buy point prediction. What does all this news of bankruptcy and more mean? Are we in a recession or not? How should we account for the leading conditions of the economy, unemployment numbers, the Fed, and gold? The Godfather of Technical Analysis provides a dose of perspective.

You can now access Larry’s video here. This video is only available to StockCharts members; if you’re not a member, however, you can still sign up for a free trial! In addition to the presentation, you’ll unlock all of the premium charting features, scanning resources and analysis tools that seasoned chartists like Larry refuse to trade without.

You can visit Larry’s website at www.ireallytrade.com.

SPX Monitoring Purposes: Long SPX on 2/6/23 at 4110.98.

Monitoring Purposes GOLD:  Long GDX on 10/9/20 at 40.78.

Long Term SPX Monitor Purposes: Neutral.

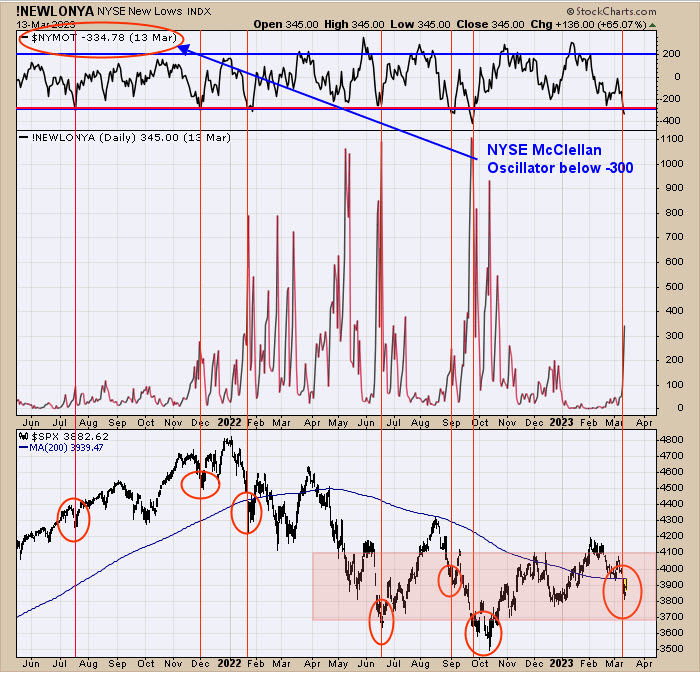
The top window is the NYSE McClellan Oscillator, which dates back to March 2021. We marked the times when the NYSE McClellan Oscillator closed below -300 (yesterday close came in at -335). In all cases, with a -300 or less Oscillator reading marked a least a short term low, and most marked lows that last several weeks or longer. SPY appears to be building a base, as noted in pink-shaded area where Oscillator reached -300 or lower. Page two shows where panic has formed using the TRIN, and both methods have similar appearances.

Yesterday, we said, “The bottom window is the 5-day TRIN, the next window higher is the 3-day TRIN, and the top window is the 10-day TRIN. When all three timeframes line up into bullish readings, the market is near an important low. We circle in blue at the June and October lows where the market pushed lower to a new low before reversing. Currently, SPY is not far from the December low and may (or may not) test that level before reversing higher. There is a lot of panic TRIN closes going back to May of last year, which we noted with a pink box. Panic comes at lows in the market, and with panic trin readings dating back to May, it appears a large support area is forming. The SIVB failure last week didn’t help our long position, but did produce panic closes in the TRIN and TICK.” Page one shows where the McClellan Oscillator produced -300, which is noted with a pink-shaded area and rhymes with the TRIN-shaded area. The market appears to be building a base that has a measured target to the 470 SPY range, which is the January 2021 high. We may see some back and forth before a breakout from the shaded area occurs.

Above is the Sprott Physical Gold Trust Premium/discount index, which shows if you can buy this physical gold above or below the real price of gold. We have this chart going back to 2010. Before 2018, the Sprott Physical Gold Trust Premium/Discount was never below -2% discounts. This Sprott Trust is a sentiment indicator. When investors lean bearish, they can buy this trust below the real price. We marked the times with blue lines the times when Sprott trust was below a 2% discount. As it turns out, every time the discount was below 2%, Gold was near at least a short-term low, and some marked intermediate-term lows. The largest <2% discount going back to 2010 started back in September of last year and is still on going with a 2.44% closing discount yesterday. This long of a discount below 2% is a bullish intermediate sentiment indicator. The current discount below 2% suggests gold is still a good buy at current prices.

Tim Ord,

Editor

www.ord-oracle.com. Book release “The Secret Science of Price and Volume” by Timothy Ord, buy at www.Amazon.com.

Signals are provided as general information only and are not investment recommendations. You are responsible for your own investment decisions. Past performance does not guarantee future performance. Opinions are based on historical research and data believed reliable; there is no guarantee results will be profitable. Not responsible for errors or omissions. I may invest in the vehicles mentioned above.

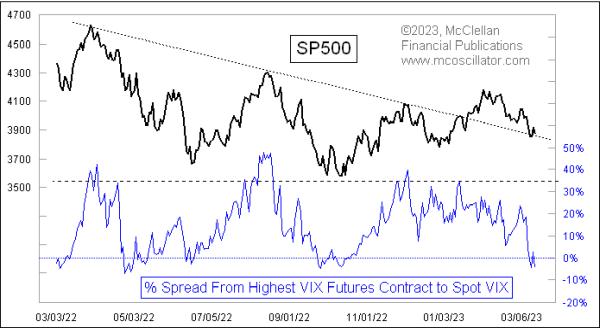
The fallout from the SVB (Silicon Valley Bank) collapse has finally put fear into the hearts of investors, and especially options traders, pushing up the VIX from the low 20s to a close of 26.14 on March 15, 2023. That took the VIX Index up above the prices of all of its futures contracts, which creates a unique oversold sentiment situation that is the subject of this week’s chart.

For any sentiment indicator like the VIX, analysts want to know what “high” and “low” readings consist of. Some use static numerical levels for the VIX, which is a problematic approach, as the normal levels for the VIX can vary a lot over time. Others (including me) like to use dynamic thresholds such as Bollinger Bands.

VIX Index futures contracts first started trading in March 2004, and I have found that the VIX futures market offers us a good way to benchmark what “high” or “low” VIX values are. The VIX Index is determined by the prices that traders set for S&P 500 options, and when they price in more risk premium into those options in comparison to “fair value”, it is a sign of greater fear and, thus, a bottoming condition for prices. The traders of VIX futures necessarily have to take a longer-term approach, with those contracts usually extending out as much as 8-9 months into the future, and so the prices that they set serve as a good way to see what other speculators think is a fair value for pricing in the VIX at the expiration points in the future. When the spot VIX moves too far above or below its futures contracts, it signals a big disconnect between those two camps. And it provides us with useful information.

Most of the time, the VIX Index is quoted below all of its futures contracts. That is the normal state. When it goes too low below all of the VIX contracts, it shows an extreme of optimism among the options traders. In the chart above, that condition shows up as a high reading for the indicator, which measures the spread between whichever VIX futures contract has the highest price minus the VIX Index. Such a condition is a pretty good indication of a price top, although it can take a while to matter.

Right now we have the opposite condition, wherein the VIX Index is above all of its futures contracts. That produces a negative reading on this chart. Such readings do not come along very often, and they are pretty good indications of a bottoming condition for stock prices. The direct message is that the S&P 500 options traders who drive the VIX Index are feeling more fearful than the VIX futures traders believe is merited. 

With any overbought or oversold reading on any indicator, it is important to realize that it represents a “condition,” and is not a “signal.” The market has no requirement to respond in the way that we think it should, just because we notice some reading on an indicator. The VIX has been higher than 27 lots of times in the past, and could very well go higher than this current reading in the days ahead. That’s possible. But the message, for now, is that the market selloff has done enough to instill a decent condition of fearfulness into the hearts of traders.

There’s a big gap between your performance with your methodology and your methodology’s potential. In this week’s edition of Trading Simplified, Dave introduces you to what might be keeping you from reaching your full potential. Spoiler alert: It’s you! Dave then gets into how to use the VIX for trading and analysis, and also discusses the importance of waiting for signals, using his TFM 10% System as an example and “where bad things can happen” (and unfortunately, that’s where we are now).

This video was originally broadcast on March 15, 2023. Click anywhere on the Trading Simplified logo above to watch on our dedicated show page, or at this link to watch on YouTube. You can also watch this and past episodes on the StockCharts on-demand video service StockChartsTV.com — registration is free!

New episodes of Trading Simplified air on Wednesdays at 12:00pm ET on StockCharts TV. You can view all recorded episodes of the show at this link. Go to davelandry.com/stockcharts to access the slides for this episode and more. Dave can be contacted at davelandry.com/contact for any comments and questions.

In our book How to Grow Your Wealth in 2023, we featured our projections for the Economic Modern Family.

To begin with the Granddad of the Family — Russell 2000 (IWM) — in December 2022, we wrote this:

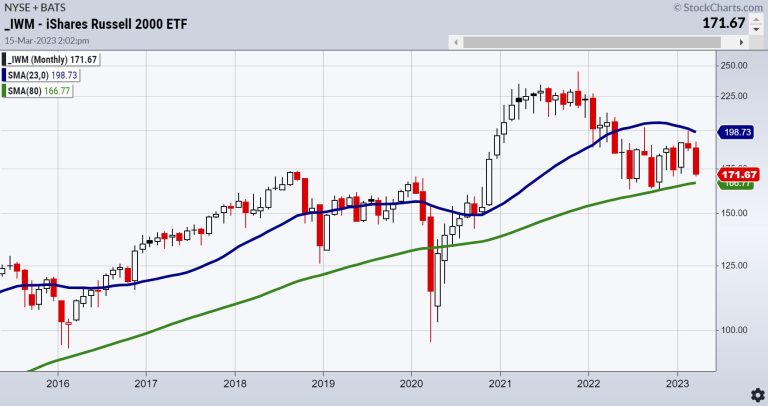
“The Russell 2000 IWM is the granddad of the Family. Hence, we take his performance seriously. At the start of 2022, IWM was already breaking down, well ahead of the S&P 500 (SPY). The monthly chart is the best one to use for a longer-term outlook for 2023.

“The green line or 80-month moving average represents about a typical business cycle.The 80-month moving average is the megatrend identifier. Should any of the key components fail the 80-month MA in 2023, the calls for ‘recession’ or more pain from stagflation will only get more painful for the market. As such, IWM only broke it once since September 2011 and that is during the pandemic. So, if we discount that time as unusual, we can say that it has been 12 years in a bullish megatrend. In October 2022, IWM touched it exactly.

“Now, coming into the new year, that October low is key. If IWM holds and gets back through the 23-month MA or blue line, then a bullish trend will continue. Should the 80-month breakdown, I would prepare for a tough time, with pandemic levels in focus.”

And here we are at the Ides of March.

IWM could not clear the 23-month moving average. And, with the recent news, IWM has fallen in price, but still considerably above the 80-month moving average. Neither indicative of growth nor recession, we’d call that a trading range.

We also call it stagflation.

With PPI and CPI coming in softer, on the heels of banks in crisis, the market turned its attention to the notion that the Fed will reduce rates this year. In fact, some predict the Fed will lower rates by 2% come December 2023. Sorry, but this resonates with the chaos theory and gold near $3000 per ounce.

Anyhoo, IWM held (although still weakest of the indices) and NASDAQ plus tech stocks took off. Which brings us to Sister Semiconductors.

From the Outlook:

“SMH has not traded below the 80-month MA since October 2010. In fact, the U.S. tech sector and the survival of chip technology has been the bright spot for 13 years! Even the pandemic did not bring this sector below the 23-month MA, as we are heavily reliant on tech for everything.

“Will that continue if the rest of the family fails? And, if SMH remains strong, can it ease the pain of recession?”

With March half over, we will see what our Sister Semiconductors are made of. Over the 23-month, and making money will be easier. However, without Gramps in tow, it will be a short-lived rally.

Lastly, our Complete Trader Bullish Reversal Scan had 2 tech stock picks. Intel (INTC) and Intuit (INTU) — two Tech stocks that should benefit if this chip rally sustains.

For more detailed trading information about our blended models, tools and trader education courses, contact Rob Quinn, our Chief Strategy Consultant, to learn more.

IT’S NOT TOO LATE! Click here if you’d like a complimentary copy of Mish’s 2023 Market Outlook E-Book in your inbox.

“I grew my money tree and so can you!” – Mish Schneider

Get your copy of Plant Your Money Tree: A Guide to Growing Your Wealth and a special bonus here.

Follow Mish on Twitter @marketminute for stock picks and more. Follow Mish on Instagram (mishschneider) for daily morning videos. To see updated media clips, click here.

Mish in the Media

Mish sees opportunity in Vietnam, is trading SPX as a range, and likes semiconductors, as she explains to Dale Pinkert on ForexAnalytix’s F.A.C.E. webinar.

Mish and Nicole discuss specific stock recommendations and Fed expectations on TD Ameritrade.

Mish joined the March 10 closing bell coverage on Yahoo! Finance, which you can see at this link!

Mish goes through the macro through key sectors and commodities in this appearance on CMC Markets.

Mish joins Mary Ellen McGonagle (of MEM Investment Research) and Erin Swenlin (of DecisionPoint.com) on the March 2023 edition of StockCharts TV’s The Pitch.

Mish talks women in finance for International Women’s Day on Business First AM.

Mish focuses on defense stocks in this appearance on CNBC Asia.

Mish points out a Biotech stock and a Transportation stock to watch if the market settles on Business First AM.

Mish joins Maggie Lake on Real Vision to talk commodities and setups!

Read about Mish’s article about the implications of elevated sugar prices in this article from Kitco!

While the indices remain range bound, Mish shows you several emerging trends on the Wednesday, March 1 edition of StockCharts TV’s Your Daily Five!

Mish joins Business First AM for Stock Picking Time in this video!

See Mish sit down with Amber Kanwar of BNN Bloomberg to discuss the current market conditions and some picks.

Click here to watch Mish and StockCharts.com’s David Keller join Jared Blikre as they discuss trading, advice to new investors, crypto, and AI on Yahoo Finance.

In her latest video for CMC Markets, MarketGauge’s Mish Schneider shares insights on the gold, the S&P 500 and natural gas and what traders can expect as the markets remain mixed.

Coming Up:

March 16th: The Final Bar with Dave Keller, StockCharts TV, and Twitter Spaces with Wolf Financial

March 17th: CheddarTV Closing Bell

March 20th: Madam Trader Podcast with Ashley Kyle Miller

March 22nd: The RoShowPod with Rosanna Prestia

And down the road

March 24th: Opening Bell with BNN Bloomberg

March 30th: Your Daily Five, StockCharts TV

March 31st: Festival of Learning Real Vision “Portfolio Doctor”

April 24-26: Mish at The Money Show in Las Vegas

May 2-5: StockCharts TV Market Outlook

ETF Summary

S&P 500 (SPY): 390 remains highly pivotal, especially on a closing basis; 380 support.Russell 2000 (IWM): Calendar range support level at 172.00, resistance 180.Dow (DIA): 310 support, 324 resistance.Nasdaq (QQQ): Wow-290 key, 300 next area to pierce.Regional Banks (KRE): 44 support, 50 resistance.Semiconductors (SMH): 240 pivotal support–strongest, yet still below the 2-yr biz cycle.Transportation (IYT): 218-219 so pivotal.Biotechnology (IBB): 126.50 moving average resistance.Retail (XRT): 60 big support and 64 big resistance.

Mish Schneider

MarketGauge.com

Director of Trading Research and Education

Silver is like that drab and boring coworker who you say “hi” to, but never really care to engage.

It may not possess gold’s glitz but… it’s the only metal that has can boast both monetary and industrial-tech use cases. Its history as money is millennia-old, and much of it is needed to produce emerging technologies, particularly in the clean energy space. So, it’s an arguably undervalued metal.

In March of 2020, the gold/silver ratio shot up to a never-before-seen 126:1. If you’re not familiar with this ratio, it represents the number of silver ounces it takes to buy one ounce of gold (Mish Schneider does a great job explaining it).

In short, 126:1 was a 300-year high, at the least. And most investors slept through this rare event.

So, if you’re trying to decide between gold and silver, the gold/silver ratio is a key technical indicator to keep an eye on.

When the gold/silver ratio is at or near historic highs, that means gold is outperforming silver. It’s an opportunity to build a larger silver position while lightening up on a gold position.When it’s nearing historic lows, silver is outperforming gold. When the ratio is at historic lows, it’s an opportunity to buy gold and lighten up on a silver position.

Where’s the ratio now, and where is it “supposed” to be? It’s currently at 88:1. As far as where the “average” might be, throughout most of the 20th century, it was at 45:1. Over the last 20 years, however, the average rose to 60:1. Let’s take a look.

CHART 1: THE GOLD/SILVER RATIO. Over the last 20 years, the gold/silver ratio averaged 60:1. An 88:1 ratio indicates that gold is trading higher than average with respect to silver.Chart source: BullionByPost.com. For illustrative purposes only.

How can you get this on StockCharts? You can build it on SharpCharts by typing in two ETF proxies: GLD:SLV. Both are metal-backed ETFs, and combining them will get you pretty close to a ratio of the two “spot” metals.

Try it yourself. Here’s what it should look like:

CHART 2: GOLD/SILVER RATIO USING GLD AND SLV ETFS AS PROXIES. Charting the GLD:SLV ratio gives you a ratio that’s close to the ratio between the spot prices of the two metals. Chart source: StockCharts.com. For illustrative purposes only.

Notice that the ratio number to the chart number is the same figure divided by 10 (88:1 becomes 8.81).

Applying the Gold/Silver Ratio

Suppose you thought the ratio reading of 91:1 signaled an opportunity to go long SLV. Here’s what you might have done.

First, a trader might have pulled up a chart of our proxy ratio (GLD:SLV), adding SLV’s Price Performance at the bottom of the chart to see where the top of the ratio coincides with SLV’s prices.

CHART 3: DAILY CHART OF SLV.Chart source: StockCharts.com. For illustrative purposes only.

Notice the following:

To start things off, the 50-day and 200-day moving averages began exhibiting a Golden Cross toward the end of December, signaling bullish conditions.The moving average convergence/divergence (MACD) oscillator appears to be in a prime position for an upward reversal. The MACD line has crossed above the signal line, and both are well below the baseline.SLV has found a relative bottom slightly below the 61.8% Fibonacci retracement level.The candle on March 7 closed below the lower of the Bollinger BandsⓇ (2nd standard deviation), indicating a high probability of an upward reversal.

Although this may seem like an aggressive entry, a trader might have opted to place a “long” entry right above the March 7 candle at 19.00 (which, you might have noticed, gapped downward) and a stop loss slightly below the following day’s candle at 18.35 as soon as it began showing signs of a near-term bottom.

With strong resistance nearing 22.50, the reward-to-risk ratio would seem favorable, with a $3.50 per share return goal to a potential loss of $0.65 per share—or over 5-to-1 reward to risk.

The bottom line: The gold/silver ratio, despite being an important indicator, is still subjective and leaves plenty of room for interpretation, particularly when it comes to specific trading setups. The StockCharts platform has plenty of indicators to fine-tune your entry point. This is just one example of many in applying this ratio to real-market engagement.

Disclaimer: This blog is for educational purposes only and should not be construed as financial advice. The ideas and strategies should never be used without first assessing your own personal and financial situation, or without consulting a financial professional.

Price growth cooled to an annual rate of 6% in February, according to data released Tuesday by the U.S. Bureau of Labor Statistics. The annual reading was lower than January’s 6.4% year-over-year level and in line with economists’ forecasts.

On a monthly basis, prices rose 0.4% in February from January, down slightly from January’s 0.5% increase, the latest Consumer Price Index reading showed.

Energy costs continued to fall, with prices 5.2% higher in February year-over-year compared with an 8.7% increase in January. Food price increases also cooled, rising 0.4% last month since January compared with 0.5% the month before, but remain broadly steeper than a year ago — up 9.5% on since last February.

The latest inflation data comes as Wall Street and economists continue to process the collapses of Silicon Valley Bank on Friday and the New York-based Signature Bank on Sunday and their impact on the broader economy.

Markets responded mostly positively to the inflation data in premarket trading Tuesday, with Dow futures jumping more than 300 points and bank stocks regaining some ground from a punishing Monday.

Before the bank meltdowns, analysts still feared that the economy was running too hot to contain inflation, with some forecasters even betting that the Federal Reserve would have to hike its key federal funds rate by 0.5% at its meeting this month, up from the 0.25% increase it imposed at its January meeting.

But given the tumult in the banking sector, a smaller hike — or a halt to increases altogether — is now seen as more likely when the Fed meets again March 22.

A customer at a butcher shop in Louisville, Ky. Luke Sharrett / Bloomberg via Getty Images

In a note to clients Tuesday morning, Seema Shah, chief global strategist at Principal Asset Management, wrote that the central bank could comfortably rule out a hefty half-point increase but acknowledged that its job combating inflation is “clearly not yet done.”

“A rate pause next week may give the Fed the space to wait for financial stability concerns to hopefully settle, before resuming hikes next meeting,” she wrote.

Government regulators, including the Fed, have raced to quell fears of a broader contagion after policymakers’ campaign to increase borrowing costs — part of a monthslong crusade against inflation — contributed to the crisis that took down SVB.

Even before the CPI data was released Tuesday, regulators’ seizure of SVB and Signature had scrambled analyst expectations around the Fed’s next moves.

Late Sunday, Goldman Sachs chief economist Jan Hatzius wrote in a note to clients that he believed the Fed would have to “pause” its rate hiking program entirely.

“While we agree that more tightening will likely be needed to address the inflation problem if financial stability concerns abate, we think Fed officials are likely to prioritize financial stability for now,” he wrote, adding that inflation is a comparatively “much slower-moving problem.”

Other economists saw things differently.

“Despite substantial market volatility over the last few days, there has been little to actually impact our outlook for inflation so far this year,” Citibank economists wrote in a note to clients Monday.

The Fed is unlikely to initiate any pause in its rate hiking, they said: “Doing so would invite markets and the public to assume that the Fed’s inflation fighting resolve is only in place up to the point when there is any bumpiness in financial markets or the real economy.”

Morgan Stanley, for its part, said in a note to clients before Tuesday’s CPI release that it could not rule out another 0.5% hike. Evercore’s ISI research unit and JPMorgan had both forecast a 0.25% hike. In addition to Goldman Sachs, Barclays also anticipated a pause to the hikes, and Nomura Securities said it even expected a rate cut.

This post appeared first on NBC NEWS