Archive

2023

Browsing

The SPY is down twice now after the FOMC, where Powell continued to hike rates with another 25BPS. Despite that, there are still many sectors and tickers that are bullish. Of course this can change and we need to always be on guard for that, but, on this week’s edition of Moxie Indicator Minutes, TG presents several big tickers which are still bullish, or, at least, are definitely not bearish right now.

This video was originally broadcast on March 24, 2023. Click this link to watch on YouTube. You can also view new episodes – and be notified as soon as they’re published – using the StockCharts on demand website, StockChartsTV.com, or its corresponding apps on Roku, Fire TV, iOS, Chromecast, Android, and more!

New episodes of Moxie Indicator Minutes air Fridays at 12pm ET on StockCharts TV. Archived episodes of the show are available at this link.

When I look across the European banking sector, the charts are disturbingly weak. After Jay Powell’s presser, one of the things he mentioned was that they had six banks they were watching. He did not mention if they were US-based or international.

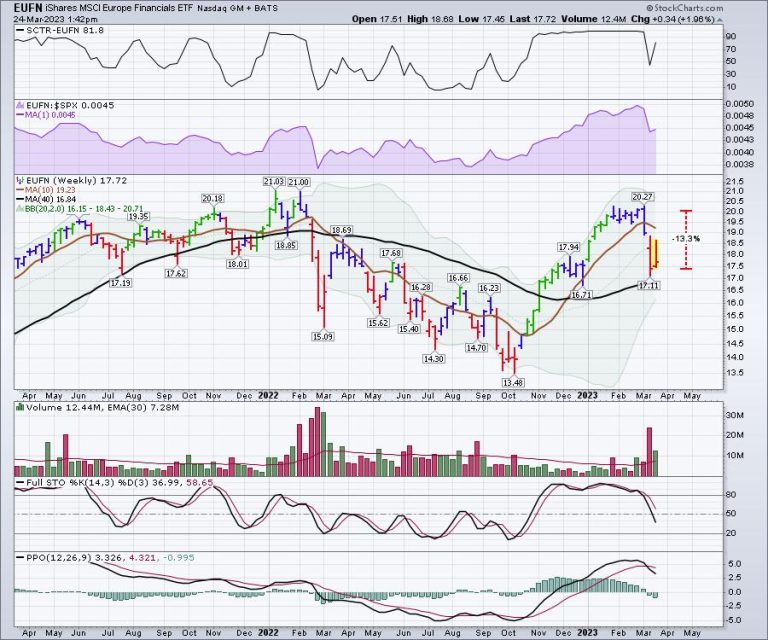
European Financials (EUFN)

When I look through this ETF, the chart is marginally damaged, but nothing that severe. The chart is down 13%.

The top holding is UBS.

Zurich Insurance Group (ZURVY) has only dropped 4% in the last 3 weeks and is up 5.3% this week. Hardly a debacle.

Systemically Important European Financials

When I look to the names that are more systemically important, the charts are quite different.

Germany has two primary banks, Deutsche Bank (DB) and Commerzbank (CRZBY). Both have been in the news.

CRZBY:

DB:

Other Systemically Important Names from around Europe

Barclay’s (BCS):

BNP Paribas (BNPQY):

Credit Agricole (CRARY):

Societe Generale (SCGLY):

Intesa SanPaolo (ISNPY):

Performance

The table below shows the performance for one week, one month, and since the start of 2023. Many of these banks are up on the week. So if you are thinking of a banking plunge, many of these banks are taking it all in stride. How long will it last?

Conclusion:

The bottom line is the EUFN is not weighted based on the size of the European banks and, therefore, not as representative with the most systemically important banks. It would be down significantly more based on the top 10 European banks. But there is some resilience so far that this all works out, as a large number of banks are up on the week even in the face of the weakness on the Credit Suisse and Deutsche Bank charts.

Unnerving, but not broken, so far.

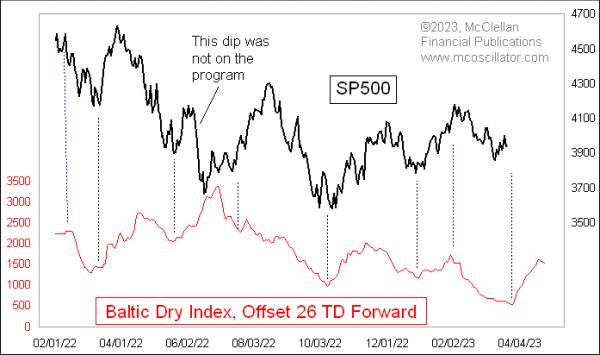
The Baltic Dry Index (BDI) makes for an interesting, but imperfect, leading indicator for the movements of stock prices. I don’t know exactly why this works, and why it occasionally stops working, but the relationship has been going on for years and so, at some point, one just stops asking why.

In this week’s chart, the plot of the BDI is shifted forward in the chart by 26 trading days. I have used 24TD before, and, at the moment, a 26TD lag time seems to be working better. I do this shift in the chart to make it easier to see how the BDI’s movements get repeated in the plot of the S&P 500.

The Baltic Dry Index is calculated and published by the Baltic Exchange, a maritime industry association and freight market information provider. The BDI is an average of the shipping rates charged for 3 different categories of dry bulk timecharter ships. The “dry” reference means it is talking about lease rates for cargo ships that haul materials like iron ore, as opposed to ships that haul containers, or oil tankers. Analysts view the BDI’s pricing information as an indication of economic strength, as companies are more or less willing to pay up for getting industrially-essential materials shipped.

How that translates into being an indication of what stock prices are going to do 26TD later is part of the fascinating mystery. But it has been working this way for years.

Right now, this model is saying that prices should resume their decline toward a low due at the end of March 2023, and then turn upward in April, at least for a while. The latest data for the BDI shows a tiny downturn, which may matter for stock prices, but not until after the 26TD lag time goes by.

Before you go out and plan your trading based on this chart, it is important to note that this relationship does not always work perfectly. Noted in that chart above is a significant adverse excursion off track in June 2022, when the S&P 500 fell hard, in disagreement with the BDI’s message. That was followed in July and August 2022 by the S&P 500 working extra hard to rally and try to get itself back on track.

There have been other instances in the history of this relationship where the stock market went off track in an even bigger way. Here is a longer-term look back:

The whole relationship went through a yearlong period of inversion back in 2019, which was coincidentally (or not?) right after the collapse of a retention pond at an iron mine in Brazil run by the company Vale, which sent a big disruption through the whole iron ore market. The leading indication relationship got back into sync again just in time for the COVID Crash bottom in March 2020, but it inverted again at the end of 2020. It worked well in 2021 and early 2022, and then we can see in this long-term chart that the weird stock market dip in June 2022 was another instance of an inversion to this relationship.

Any leading indication relationship that is fickle enough to invert in the past is suspect for perhaps doing so again in the future, and usually at the moment when one is counting on it most fervently to keep working.

So if you choose to believe in this relationship, which seems to be working really well right now, just keep in mind that it does not merit one’s complete trust.

2022 was a challenging year for investors, and, so far, the stock market in 2023 has had its fair share of challenges. The fallout of some banks came as a surprise to many investors; how can retail traders improve their trading results in 2023 in light of such unexpected events? That’s a question on every investor’s mind and involves several facets that range from tools and educational resources to behavioral biases. 

A recent conversation between Steve Lanzone of Bloomberg Radio and David Keller, CMT, our chief market strategist, sheds some light on how investors can better navigate the markets. It involves tools, educational resources, and behavioral biases. How can investors apply these different facets when investing? Let’s unpack.

A link to the interview is available at the end of this article.

Rotation Among Asset Classes

The stock market is never static. Sometimes, stocks outperform bonds, gold outperforms stocks, or commodities outperform stocks. And within stocks, sometimes Consumer Discretionary stocks outperform Consumer Staples, Technology outperforms Utilities, large caps outperform mid-caps/small caps, growth outperforms value, and so on. This is why it’s important for investors to be aware of these different rotations. If you start seeing growth stocks deteriorating, it may be time to comb through your charts to identify the areas of the market that are showing strength.

For example, during the banking fiasco in March 2023, banks got slammed, and investors moved their assets to other areas, such as the Technology sector, bonds, and gold. The chart below shows the ratio between the Technology Select Sector SPDR (XLK) and the Financial Select Sector SPDR (XLF). You can’t miss the steep rise from early March. This indicates that investors are moving into technology stocks such as Microsoft Corp. (MSFT), Apple Inc. (AAPL), Nvidia Corp (NVDA), and Salesforce, Inc. (CRM).

CHART 1: ARE INVESTORS TURNING TO TECHNOLOGY STOCKS FOR SAFETY? If you look at the performance of Technology to Financial, investors are pulling out of bank stocks and investing in technology stocks.Chart source: StockCharts.com. For illustrative purposes only.

Remember, during volatile market conditions, rotating in and out of different asset classes or sectors can equate to being an active trader. Nothing wrong with that, but it means you have to be engaged with the markets. One week can make a difference. So it goes without saying that you have to manage your risks, because small losses could lead to large losses.

If a stock or ETF has seen a significant decline, it may be tempting to pick it up at a bargain. But you’d be better off taking a step back and considering why the price is low.

Can you recollect a similar situation from the past?How did that trade work out?If you were to do it again, how would you trade it?

A stock or ETF may be well below its 200-day moving average, and if your criteria are to buy stocks above the 200-day moving average because, well, nothing good happens below the 200-day, you’re better off waiting on the sidelines.

Tackling Trading Emotions

One of the biggest challenges a trader faces is emotions. It’s much deeper than fear and greed. Within the realm of emotions are several biases, and one that often comes in the way of making sound trading decisions is confirmation bias. That’s when you find enough evidence to support your directional bias and convince yourself that your decision is correct—and because you believe your decision is correct, if the trade goes against you, you refuse to exit the position. It could end up being a losing position for far too long.

Another bias that investors face is endowment bias. That’s when you get emotionally attached to your positions. If you were attached to that big bank stock that you’ve been holding for years, your unwillingness to let it go may be silently hurting you. That stock doesn’t care if it hurt your feelings. Why should you hate to let it go?

These types of biases are part of human nature and changing them will take great effort. The market always wins. How can you come close to defeating it?

The 2023 stock market may be volatile, but that doesn’t mean trading opportunities don’t exist. Your best path to take advantage of the market is to establish a daily routine, make a checklist, and be disciplined.

Your Trading Game Plan

Here’s the view from Your Dashboard:

Check the Market Overview (1). How are the US equity indexes performing? Scroll through the different indexes under the Equities tab and determine if they’re in an uptrend, trading sideways, or in a downtrend. View the charts in different time frames—intraday, daily, weekly, and monthly. Do all timeframes confirm the same direction? Are all indexes trending in the same direction, or are they different? What about bonds, commodities, and crypto? Having this big-picture view of the market is a great way to engage with the market.

Check the Sector Summary (2). Know which sectors are the top and bottom performers. One day doesn’t make a trend, so it helps to look at a longer-term view. Click on Sector Summary at the bottom of the panel (3) and select a longer time period, such as three or six months, from the “period” drop-down menu. If, for example, Technology is the top-performing sector, select the Sector Summary for the Technology sector to identify the top sub-sectors. If semiconductors are at the top, select it from the Name column to see which stocks make up the semiconductor sub-sector. You can then sort these based on the different columns.

Identify the strongest stocks or exchange-traded funds (ETFs)—Consider the top three sectors and sub-sectors and add five to ten of the strongest stocks you find there to your ChartLists.

Do your due diligence. Set up the charts with the indicators you prefer to look at and add trend-following indicators, breadth indicators, volume indicators, and volatility indicators. There are several indicators to choose from, so choose carefully, because you don’t want your charts to get too crowded. Use indicators that you understand well, and when you choose indicators, make sure they’re not redundant. You want to cover different facets of price action. Here are a few to consider:

Trend following. Trendlines, moving averages, average directional index (ADX).Breadth indicators. Advance-decline line, bullish percent index, McClellan Oscillator.Volume indicators. Relative volume (RVOL), negative volume index (NVI), on-balance volume (OBV).Volatility indicators. TTM Squeeze, average true range (ATR), Bollinger Band Squeeze®.

☑ Trading setup. Look through all your charts regularly and get to know all of them. Ask yourself if you’d be a buyer or a seller in the prevailing market environment. If you’d be a buyer, you want to buy into strength. Identify the industries, ETFs, mutual funds, and stocks that are outperforming the market.

Are they trending higher?Do they show strength?Do all indicators confirm a buy?Is the security showing increased participation?

If everything checks out, you may want to hit that buy button. If the stock acts the way you had hoped, ride the trade. But if you start seeing signs of price not going in your favor, be ready to sell the position. You never know how low a stock will fall. A $2 drop in price could drop another $2 the next day and continue heading lower. Your small loss could become a very large loss.

The Bottom Line

Following routines and checklists doesn’t mean you’ll have no losing trades. You will still have losses, but the key is to keep your losses small. And given how the 2023 stock market has played out so far, it may be worth your while to spend time establishing a trading game plan that is logical and aligns with your lifestyle. The key is to have the discipline to follow it so that your emotions will have less of an influence on your trading decisions.

Disclaimer: This blog is for educational purposes only and should not be construed as financial advice. The ideas and strategies should never be used without first assessing your own personal and financial situation, or without consulting a financial professional.

On this week’s edition of StockCharts TV‘s StockCharts in Focus, Grayson discusses the most important chart on all of StockCharts – your default ChartStyle! In addition to a quick review of what a ChartStyle is, you’ll learn how to save your favorite indicators, overlays and other chart settings as your default ChartStyle that will be used across the site. Whether you’re using SharpCharts or ACP, today’s show will help streamline your charting workflow by automatically loading your go-to chart template. Plus, Grayson will explore the new “Sample Chart Gallery” and show you how the growing collection of pre-built sample chart templates there can help you in your trading or investment process.

This video was originally broadcast on March 24, 2023. Click on the above image to watch on our dedicated StockCharts in Focus page on StockCharts TV, or click this link to watch on YouTube. You can also watch on our on-demand website, StockChartsTV.com, using this link.

New episodes of StockCharts in Focus air Fridays at 3pm ET on StockCharts TV. You can view all previously recorded episodes at this link.

Racing ahead of the semiconductor pack, Nvidia (NVDA) appears to be edging toward the upper regions of a parabolic curve. 

What Does This Mean for NVDA Stock Price?

It’s a sign of confidence coming off a strong Q4 2022 earnings performance on top and bottom lines. NVDA surprised Wall Street, beating analyst EPS estimates by 8.53% (the largest since the first quarter of 2021).

We’ll address the “parabolic curve” part a little later.

What’s Driving NVDA Stock Ahead of the Pack?

In short, investors see NVDA as a company that’s well-positioned to endure an economic downturn. We can say the same thing about semiconductor stocks in general, but what NVDA has going for it is its central business, which includes the production of AI chips.

Think ChatGPT and Microsoft Bing’s AI chatbot. NVDA’s chips have a tremendous capacity to power machine learning software. And if you compare NVDA’s performance against the other top US chip stocks by market cap on PerfCharts, the picture’s pretty clear.

CHART 1: SEMICONDUCTOR SECTOR PERFORMANCE. NVDA broke ahead of the pack starting in mid-January. Chart source: StockCharts.com. For educational purposes only.

If you had checked the StockCharts Technical Rank, comparing NVDA to its sector performance via VanEck Semiconductor ETF (SMH), the difference wouldn’t have been as clear, which is why pairing the two indicators proved important in this case.

CHART 2: COMPARING SCTR FOR NVDA AND SMH. NVDA’s price and technical performance advanced ahead of SMH in mid-January as seen in the SCTR. With both assets advancing (remember that NVDA is SMH’s largest holding), PerfCharts provided a much clearer picture. Chart source: StockCharts.com. For educational purposes only.

Should Investors Buy Into NVDA Strength?

Here’s where investors who are interested in timing their trades tend to get a bit wobbly, especially if fundamental data is the only thing they rely on. And, by the way, when investors hear market pundits on financial media say things like “wait for the dip,” unless investors have a relatively decent grasp of technicals, “the dip” can be virtually anywhere (which isn’t helpful at all).

In this case, I’d be careful. 

CHART 3: NVDA’S STOCK PRICE IS SKYROCKETING. How long can it sustain? There’s a potential resistance level at $289.46 and there are divergences between price and the MACD and Chaikin Money Flow indicators. The stochastics is in overbought territory. Chart source: StockCharts.com. For educational purposes only.

Trajectory: Take a look at NVDA’s projected trendline (blue trendline) versus its current parabolic trajectory. It’s skyrocketing, and typically, movements like this one can sustain themselves for too long.Resistance: Next, there’s a strong resistance level near 289.46 (one-year high). Bullish sentiment may be strong leading up to this level, but given the vertical distance price has traveled from its October low and its January pullback, bullish conviction is likely to be tested at these heights.Divergence: NVDA prices may have been advancing sharply, but watch out for divergences in the MACD and the Chaikin Money Flow indicators, both of which paint the picture of decreasing conviction or buying pressure despite NVDA’s skyrocketing price move. Plus the stochastic oscillator, which also shows a slight divergence, shows that price is well within the “overbought” range.

So, Do You Buy the Dip (Once It Declines)?

The fundamental case for buying shares of NVDA (or SMH, for that matter) is a reasonable one. After all, chip demand tends to weather most economic downturns.

But given resistance overhead and the divergence readings that signal a decline in buying pressure from a potentially overbought range, NVDA seems bound for a dip. 

Targeting the range between 205.00 and 230.00 as a potential “buy the dip” level would capture multiple areas of historical support and resistance. There are plenty of other entry points, of course, and some, like Fibonacci retracement levels, are contingent upon a temporary reversal.

CHART 4: WHERE WOULD A POTENTIAL DIP BE FOR NVDA STOCK? The range between $205 and $230 could be a “buy the dip” level, given support and resistance levels from past price data. Chart source: StockCharts.com. For educational purposes only.

NVDA stock is worth adding to your ChartLists. Click on the price charts to see the live version. From there, you can easily add the chart to any of your ChartLists.

Disclaimer: This blog is for educational purposes only and should not be construed as financial advice. The ideas and strategies should never be used without first assessing your own personal and financial situation or without consulting a financial professional.
Small-caps are leading the way lower and breadth indicators are showing some serious deterioration under the surface. Large-caps are holding up for now, but keep in mind that weakness in small-caps foreshadowed the January 2022 peak in SPY. Today’s article will compare price charts for SPY and IWM, and then look at the bearish signal in the Composite Breadth Model.

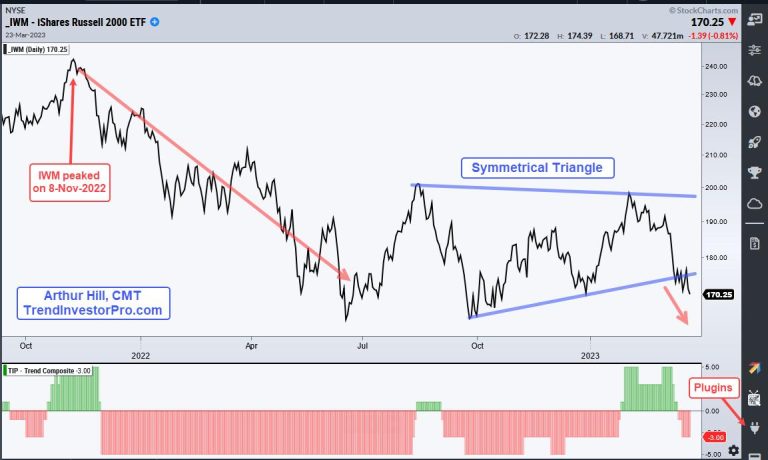
Small-caps are leading the way lower because the Russell 2000 ETF (IWM) and the Russell Microcap ETF (IWC) are in downtrends, per the Trend Composite. Also note that IWC recorded a 52-week low this week. The chart below shows IWM falling from November 2021 to June 2022 and then consolidating with a large Symmetrical Triangle. A consolidation after a large decline is typically a continuation pattern that represents a rest within the bigger downtrend. IWM broke the triangle line and this signals a continuation lower.  

Note that IWM peaked on 8-November-2021 and SPY peaked on 3-January-2022, some two months after IWM. This means IWM led the way lower and foreshadowed the market peak in January 2022. Flash forward to March 2023 and we have IWM leading lower again. SPY remains well above its December low and is down just .78% in March. IWM, on the other hand, closed below its December (closing) low on Thursday and is down 9.53% in March. The chart below show SPY breaking wedge support and this break is bearish.

The generals are likely to follow the troops. The indicator window on the chart above shows the Composite Breadth Model turning bearish on March 13th. This model uses fourteen breadth indicators from the S&P 500 and S&P 1500. There are many more small-cap stocks (troops) than large-caps stocks (generals) and this means breadth indicators reflect performance for smaller stocks. SPY is a market-cap weighted ETF that reflects performance for large-caps. Even though the generals (SPY, QQQ) are holding up, the troops (small-caps) are retreating and I expect the generals to follow.

The Composite Breadth Model (CBM) is our main market timing tool at TrendInvestorPro. This model measures the weight of the evidence for the stock market as a whole and acts as our market filter for trend and momentum strategies. Whipsaws happen, but our quantified results show that market filters improve returns and greatly reduce drawdowns over the long-term. Click here to learn more about our trend-momentum strategies and mean-reversion strategy for trading ETFs.

The Trend Composite, ATR Trailing Stop and nine other indicators are part of the TrendInvestorPro Indicator Edge Plugin for StockCharts ACP. Click here to take your analysis process to the next level.

—————————————

The Federal Reserve is raising its key interest rate by 0.25%, continuing on its crusade against inflation while warning that recent instability in the banking sector could weigh on the economy.

In announcing their ninth consecutive rate hike — which increases the benchmark federal funds rate to a range of 4.75% to 5% — Fed officials said in a statement Wednesday that the “U.S. banking system is sound and resilient.”

But after a series of historic collapses and rescues of lenders in the U.S. and overseas, they warned that “recent developments are likely to result in tighter credit conditions for households and businesses and to weigh on economic activity, hiring, and inflation.” That means potentially higher borrowing costs for home and car loans to steeper credit card interest rates.

“The extent of these effects is uncertain,” the statement continued, sounding a note of caution over the likelihood of further rate hikes as the Fed looks to get inflation back down to its 2% target.

After it jumped immediately after the decision, markets nosedived. The Dow Jones Industrial Average closed more than 500 points lower, or about 1.6% down. The S&P 500 and NASDAQ indices also finished the day down about 1.6% each.

At a news conference after the announcement, Powell addressed lingering concerns around the banking sector, reassuring U.S. depositors that their funds remain safe and that the Fed continues to use all its available tools to head off more problems.

“These are not weaknesses that are at all broadly through the banking system,” Powell said in response to a question, calling circumstances around the failed Silicon Valley Bank “an outlier.”

Powell’s reassurances coincide with efforts by Treasury Secretary Janet Yellen to soothe depositors and investors rattled by the fallout. Yellen told lawmakers Wednesday that regulators would take any necessary measures to “ensure that depositors’ savings remain safe” in U.S. banks.

However, she has said that while officials could backstop more deposits to avoid a broader contagion — as they did twice recently — the federal $250,000 insurance limit remains in effect. And on Wednesday, she emphasized that regulators are not considering offering “blanket insurance.”

The Fed also released its quarterly round of economic projections Wednesday, which include policymakers’ forecasts on inflation and rate hikes through 2025. It now foresees inflation’s remaining at a higher level for 2023 than it previously expected, while the unemployment rate for the year is now forecast to rise to 4.6% from 3.6% as of last month, higher than the previous expectation of 4.4%.

The latest 12-month inflation data came in at 6% for February. That was slightly lower than January’s 6.4% level — and down from a 9% peak last summer as price pain lingers for consumers despite gradual declines.

A more detailed inflation measure the Fed has been watching, so-called supercore inflation — which reflects price increases driven by costs for everyday services like haircuts or meals out — even increased slightly last month, which led many analysts over the past week to expect further rate hikes.

As Bankrate Chief Financial Analyst Greg McBride put it in a statement Wednesday, “Not even the second and third largest bank failures in U.S. history, or the resulting instability in U.S. and global banking, can keep the Fed from a ninth consecutive interest rate hike to corral inflation.”

That wasn’t a sure thing, however, and analysts’ expectations were unusually divided in the run-up to the decision. Some had expected a heftier half-point rate hike and others no increase at all. In the end, the Fed took a middle-ground approach.

One reason some Fed watchers had expected a pause: The central bank’s own actions to curb inflation have been seen as factors in the recent collapses. While the failed lenders had distinct problems, higher interest rates have ratcheted up pressure across the financial industry.

By raising its benchmark rate, the Fed sets off a chain reaction of rate increases in other parts of the economy, making it more expensive to borrow and invest and thus cooling demand for goods and services.

That is precisely the central bank’s desired outcome in its fight against inflation. After its nine consecutive increases, consumers now face higher borrowing costs in a variety of places, from credit card interest rates of nearly 20% to auto loan rates of about 6.5%.

This post appeared first on NBC NEWS

WASHINGTON — Treasury Secretary Janet Yellen said on Wednesday that the Federal Deposit Insurance Corporation (FDIC) was not considering providing “blanket insurance” for banking deposits following the collapse of two prominent banks this month.

Yellen made the comments at a hearing of a Senate appropriations subcommittee, where lawmakers posed questions about the administration’s efforts to protect depositors and prevent bank runs.

Yellen told the Subcommittee on Financial Services and General Government that President Joe Biden’s administration was focused on stabilizing the banking system and improving public confidence in it.

But she said the administration was not considering expanding bank deposit guarantees beyond the FDIC’s current $250,000 limit, seen as a major roadblock to swift action to stem a deeper crisis.

When a bank failure “is deemed a systemic risk, which I think of as the risk of a contagious bank run, (we) are likely to invoke (a) systemic risk exception, which permits the FDIC to protect all deposits,” Yellen said, adding the department will continue to determine systemic risks on a case-by-case basis.

Yellen said the administration was not considering “anything having to do with blanket insurance or guarantees of deposits.”

She said the Treasury Department was working to restore the Financial Stability Oversight Council’s (FSOC) ability to designate non-bank financial institutions as systemically important.

This post appeared first on NBC NEWS

DETROIT — The Chevrolet Camaro, for decades the dream car of many teenage American males, is going out of production.

General Motors, which sells the brawny muscle car, said Wednesday it will stop making the current generation early next year.

The future of the car, which is raced on NASCAR and other circuits, is a bit murky. GM says another generation may be in the works.

This post appeared first on NBC NEWS