Archive

2023

Browsing

Wisconsin wildlife officials on Friday released thousands of public comments on a new wolf management plan, some calling for the restoration of a statewide population limit and others urging a total hunting ban.

Department of Natural Resources in November released a draft of its first new wolf management plan in almost 25 years. It would eliminate the existing 350-animal population goal and recommends instead that the DNR work with local advisory committees on whether to reduce local wolf populations, keep them stable, or allow them to grow.

The window for submitting comments on the draft plan ended Feb. 28. The DNR posted about 3,500 redacted comments on its website Friday afternoon.

The comments broadly reflected all sides of the long-running debate over how to best handle the growing number of wolves in Wisconsin. DNR estimates released in September put the statewide population at about 1,000 animals.

Northern Wisconsin farmers have long complained about wolves preying on livestock. Hunters have pointed to the 350-animal number as justification for setting generous quotas during the state’s fall wolf season. Animal advocates counter that the population still isn’t strong enough to support hunting.

Several government entities in rural Wisconsin, including the Douglas, Marathon and Jackson county boards, submitted boilerplate resolutions to the DNR calling for the agency to restore the 350-animal goal, arguing that nothing has changed to warrant its elimination.

Hunting groups, including the Wisconsin Bear Hunters Association and Safari Club International, also called for the agency to restore the 350-wolf goal.

‘Without setting a definitive guideline on which to base discretionary management decisions, any effort to stabilize or even reduce the wolf population will be questioned and likely challenged,’ Safari Club International President Sven Lindquist said in a letter to the DNR. ‘Establishing a population objective would provide DNR with a specific goal to point to as it makes decisions like setting annual harvest quotas and methods of harvest.’

Republican legislators introduced a bill that would mandate the DNR establish a new population goal in the final version of the plan but doesn’t say at what level. The proposal hasn’t received a hearing yet.

Conservation groups, meanwhile, applauded the lack of a numeric goal in the draft plan.

‘Removing an arbitrary wolf population goal is important to make sure the numbers of wolves are adaptable,’ Elizabeth Ward, director of the Sierra Club’s Wisconsin chapter, said in a letter. ‘As written in the plan, the goal should be for the state to have a self-sustaining, self-regulating, and genetically diverse wolf population that maintains connectivity with wolf populations in neighboring states and fulfills their ecological roles.’

The Chippewa tribes, which regard the wolf as a sacred brother, submitted comments saying they cannot support hunting wolves and imploring the DNR to include them in discussions on plan revisions.

It’s unclear when DNR officials would submit a final draft to the agency’s policy board. Agency officials said in a statement only that they’re reviewing the comments and will use them to consider revisions. They did not offer a timeline.

DNR spokesperson Katie Grant has not responded to an email from The Associated Press.

Wisconsin law mandates a wolf season but last year a federal judge restored endangered species protections for gray wolves across most of the country, including Wisconsin. The move prohibits hunting the animals. If wolves were ever to lose those protections, the states would be responsible for managing the creatures and Wisconsin hunts would resume.

This post appeared first on FOX NEWS

The House Oversight Committee issued subpoenas to banks asking for Biden family associates’ financial records.

Fox News has confirmed that the Oversight Committee subpoenaed Bank of America, Cathay Bank, JPMorgan Chase, and HSBC USA N.A., as well as former Hunter Biden business associate Mervyn Yan, asking for financial records.

Rep. Jamie Raskin, D-Md., the top Democrat on the Oversight Committee, complained that Committee Chairman James Comer, R-Ky., was trying to hide information regarding the investigation from Democrats on the committee.

In a statement to Fox News, Comer said ‘Ranking Member Raskin has again disclosed Committee’s subpoenas in a cheap attempt to thwart cooperation from other witnesses. Given his antics with the first bank subpoena, the American people and media should be asking what information Ranking Member Raskin is trying to hide this time. No one should be fooled by Ranking Member Raskin’s games. We have the bank records, and the facts are not good for the Biden family.’

The Oversight Committee Democratic staff sent a memo to members on Thursday which accuses Republicans of conducting their investigation behind a ‘veil of secrecy.’

‘Despite this massive investment of time and resources, Republican efforts on this and other congressional committees have failed to yield any evidence of misconduct by President Biden. Nevertheless, Chairman Comer has issued six document subpoenas for financial records as part of this renewed investigation, several of which have been based on information Committee Republicans know to be false,’ the memo states.

The Democratic memo alleges that Republicans haven’t been publicizing their subpoenas or notifying Democrats, which has purportedly resulted in some targets of subpoenas being unaware that the committee is seeking their records.

‘On February 27, 2023, Chairman Comer secretly issued the Committee’s first document subpoena as part of Committee Republicans’ ongoing investigation into the Biden family to Bank of America. This subpoena sought, among other information, ‘all financial records’ from January 20, 2009, to the present — a staggering 14-year period — for John R. Walker, a private U.S. citizen… Yet, because of Chairman Comer’s use of a secret subpoena, Mr. Walker was never notified that the Committee had subpoenaed his financial records from Bank of America, he was never notified that Bank of America turned over his records to the Committee, and he was never notified that the Committee was publicly releasing information from these records,’ the memo states.

A spokesperson for Cathay Bank told Fox News Digital that the bank will cooperate with the Oversight Committee.

‘Cathay Bank, a NASDAQ-listed, U.S. financial institution for over 60 years, has cooperated with the House Committee on Oversight and Accountability’s request for information. The bank intends to continue to cooperate with the committee,’ the spokesperson said.

EDITOR’S NOTE: This story has been updated to reflect subpoenas are for Biden family associates.

This post appeared first on FOX NEWS

Arkansas lawmakers approved a proposed $6.2 billion budget and an overhaul of the state’s sentencing laws on Friday as they wrapped up an 89-day legislative session that’s been marked by approval of Republican Gov. Sarah Huckabee Sanders’ school voucher program and a push for new restrictions on transgender people.

The House and Senate approved identical versions of the legislation laying out the budget plan, which calls for increasing state spending by more than $177 million in the fiscal year that begins July 1. The biggest increases are directed toward public schools and the corrections system.

‘We have prioritized the things we should prioritize: public safety, education of our children,’ Senate President Bart Hester, a Republican, told reporters after the vote. ‘And we believe we’re going to continue to have significant surpluses in Arkansas.’

But the only lawmaker who voted against the legislation, Republican Sen. Bryan King, said he thinks the state’s budget has been growing too quickly and lawmakers should find cuts to offset the spending increases.

‘Every time we talk about Washington D.C. or Joe Biden or somebody expanding the debt, we have to first look at ourselves,’ King said.

Legislative leaders say they believe the state has some cushion against changes in the economy, noting that Arkansas has more than $1.3 billion in a catastrophic reserve fund. The budget plan also forecasts the state will build up a $391 million surplus in the coming fiscal year.

‘We’ve positioned ourselves that if there is a downturn, the state will be able to manage it and continue to provide the type of services the public expects,’ House Speaker Matthew Shepherd, a Republican, told reporters.

The Senate also gave final approval to a change in the state’s sentencing laws that will end parole eligibility for certain violent offenses. Sanders and Attorney General Tim Griffin advocated for the proposal. It would require anyone sentenced beginning in 2024 for any of 18 violent offenses — including capital murder, first-degree murder and rape — to serve 100% of their sentence.

Starting in 2025, the bill would also require prisoners to serve at least 85% of a sentence for a list of other offenses, such as second-degree murder. Offenders convicted of other crimes would be required to serve 25% or 50% of their sentences, but the table spelling out which crimes fall under those minimums will be developed later. The changes won’t apply to people who had already been sentenced before the law takes effect.

The Legislature this week approved a separate bill tapping into the state’s surplus for several needs, including $330 million for new prison space and $300 million for a new crime lab building.

Lawmakers plan to reconvene by May 1 to formally adjourn this year’s session and consider any veto overrides. Since taking office in January, Sanders hasn’t yet vetoed any bills that reached her desk, her office said.

Sanders’ top agenda items were approved during the legislative session. Those include a massive education law that will create a school voucher program and raise minimum teacher salaries. Lawmakers this week approved another key part of Sanders’ agenda, a cut in income taxes that will cost the state $124 million a year.

Lawmakers since January have pushed for several bills targeting the rights of transgender people, including a law Sanders signed that’s aimed at reinstating Arkansas’ blocked ban on gender affirming care for minors. The law, which will take effect later this summer, will make it easier to sue providers of such care for minors. The governor has also signed a law that will prohibit transgender people at public schools from using restrooms that align with their gender identity.

The top Democrat in the Senate called the series of bills ‘horrifying.’

‘I think it also sends the message to anyone outside of Arkansas that the state is not welcoming and inclusive,’ Senate Minority Leader Greg Leding said.

There are several major bills awaiting action from Sanders. They include a measure she has supported that would require age verification to use social media sites and parental approval for users under 18, which would make Arkansas the second state to enact such a restriction.

AR enjoyed a budget surplus this year

This post appeared first on FOX NEWS

A number of my conversations this week on The Final Bar dealt with the challenges presented by narrow leadership. Joe Rabil pointed out the weakness in small caps, and Jeff Huge focused on the difference between the YTD returns of FAANG stocks versus pretty much everything else.

Why is narrow leadership such a problem? 

In the end, it’s all about broad participation, and whether the “infantry” (mid-cap and small-cap stocks) are following the “generals” (mega-cap and large-cap names). In healthy bull market phases, the average stock tends to do pretty well because “a rising tide lifts all boats.”

We shared a video earlier this week outlining the issues with narrow market leadership and what we’d need to see to turn more bullish on prospects for risk assets. Today, we’ll look at the five FAANG stocks one-by-one, focusing on key levels to watch that would indicate a potential new leg lower for our major benchmarks.

The Strong: META and AAPL

When I look at the five stocks in question, I’m immediately drawn to the two with the most encouraging trends in 2023.

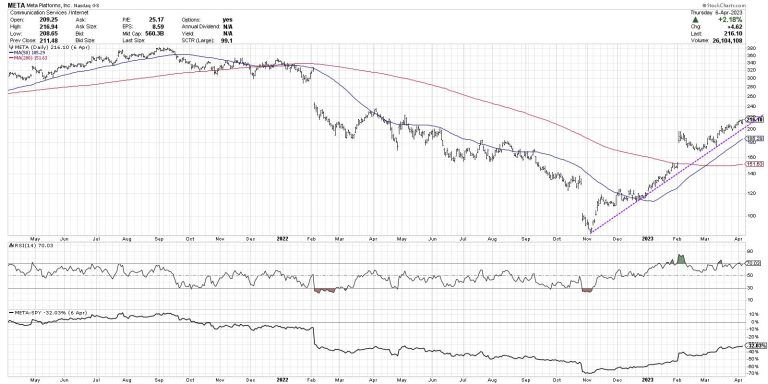
To start, META has more than doubled since its low in November and made a new high for the year again this week.

If you draw a trendline starting at the November low, you’ll see that the pace of this uptrend has been remarkably consistent. The stock remains above two upward-sloping moving averages, and the recent breakout above $200 was just the latest in a series of confirmational up moves.

Ready to upgrade your investment process, improve your understanding of market dynamics, and make real progress on your journey of behavioral investing? Check out our Market Misbehavior premium membership!

A chart like this provides a fairly straightforward game plan, in my opinion, because as long as the price remains above this trendline, the uptrend is intact. If and when the purple trendline is broken, that will tell us of a potential “change of character” on the chart.

There’s a similar look to the chart of Apple (AAPL), although in this case the ultimate low was right at the beginning of 2023.

Here, we can see the trendline connecting the recent lows show a consistent uptrend as well, which can provide a very clear sell signal when that trendline is breached.

The problem with the AAPL chart is that it is approaching a significant resistance level in the $175-180 range. This level was where the stock first topped out in December 2021, and subsequent highs in Jan 2022, Feb 2022, Mar 2022. and Aug 2022 were around that same level.

If Apple is able trade not just to resistance but through it, pushing above the key $180 level, then that would be an incredibly strong argument for a continued bullish phase for our major equity benchmarks. However, the fact that this level has been tested numerous times already tells me to be wary as AAPL attempts to breakout yet again.

The Questionable: GOOGL & NFLX

In terms of actionable signals this week, Alphabet (GOOGL) finished the week above its February high around $108. If we see further follow-through after the holiday weekend, that could indicate another bullish sign for our equity indexes.

I’ll label this chart as “questionable,” because I would argue there is still much to prove here. Note how the February high was an unsuccessful attempt to break above the 200-day moving average. In March, the price finally broke above the 200-day, then retested this moving average from above.

So, just below current levels, we have a confluence of support, based on the 200-day moving average, the most recent swing low in late March, and a “big round number” of $100 which often serves as support. If and when GOOGL breaks below $100, that would raise a serious red flag given the lack of upside follow-through.

Netflix (NFLX) has a fairly constructive chart, given that it’s currently above its 200-day moving average, but is at the risk confirming a lower high, as it pulled back in the latter half of this week.

NFLX has one of the strongest runs of performance from May 2022 to Feb 2023, but, unfortunately, the stock sort of stalled out in February and March. The high this week was around $350, well below the February peak at $375.

One of two things will happen on this chart once the current consolidation phase is complete. A break to a new swing high around $375 would confirm a new bullish phase for this stock. On the other hand, if NFLX breaks below its March low around $280, followed by a break below the 200-day moving average, that would provide a key bearish signal in a crucial mega cap stock.

The Ugly: AMZN

Now we come to what I would consider to be the clearly weakest chart of the five. Why can I say that with confidence? Because it’s the only one of the five currently below its 200-day moving average.

Look at how many times AMZN has attempted to break back above its 200-day after first breaking down in January 2022. The February rally was just the latest attempt to push above this classic long-term trend barometer.

The bullish case for Amazon would be based on the higher low in March around $90. But what would actually turn this chart from bearish to bullish? I would argue that, until AMZN can power above the February high, which would take the stock well above its own 200-day moving average, the primary trend remains down.

The most important charts I analyze every day are the weekly and daily charts of the S&P 500 index. After that, I look at literally hundreds of individual stock charts every single day. By focusing on the key levels of interest on these five charts, you’ll be monitoring the most important stocks with the greatest ability to have meaningful impact on the broader equity indexes.

Want to go through these charts through an immersive video experience? Just head over to my YouTube channel!

RR#6,

Dave

P.S. Ready to upgrade your investment process? Check out my free behavioral investing course!

David Keller, CMT

Chief Market Strategist

StockCharts.com

Disclaimer: This blog is for educational purposes only and should not be construed as financial advice. The ideas and strategies should never be used without first assessing your own personal and financial situation, or without consulting a financial professional.

The author does not have a position in mentioned securities at the time of publication. Any opinions expressed herein are solely those of the author and do not in any way represent the views or opinions of any other person or entity.

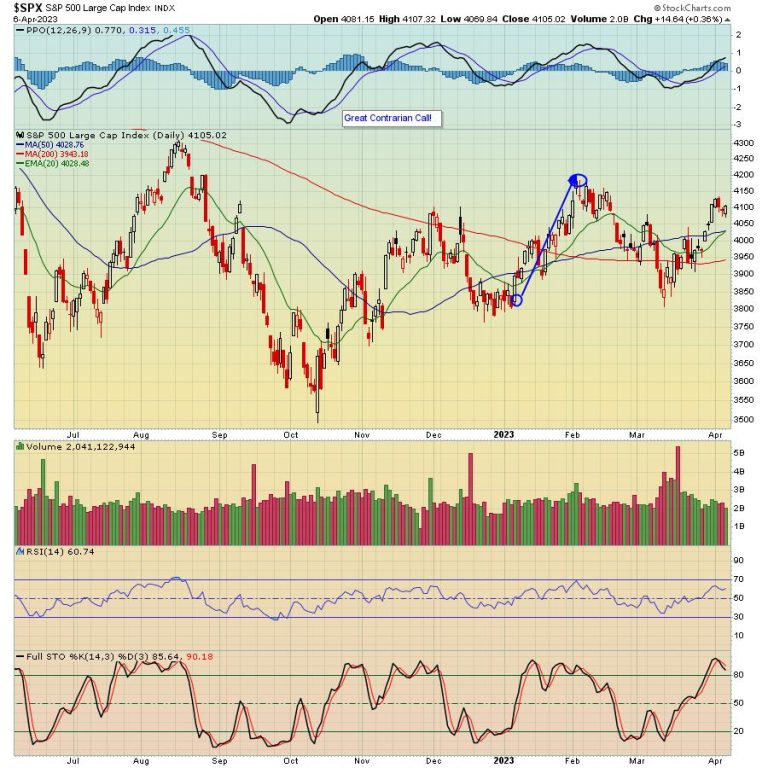
An awful lot has happened since the beginning of the year, including further rate increases, bank failures, and continuing concerns about rising inflation and weakening earnings. Yet the market shrugged it all off, with the S&P rising 7% while the tech-heavy NASDAQ rose nearly 17% as the first quarter came to an end.

Of course, if you had listened to those bearish analysts who kept insisting the market would revisit last October’s lows you would have missed out on some substantial gains. This is why you need to pay more attention to the price action than what you might be hearing from those who may not have your best financial interests at heart.

For example, even though 2022 ended on a sour note, our Chief Market Strategist Tom Bowley alerted our members on January 6 that signs were pointing to a market reversal, and, within a few weeks, the S&P climbed by 9%.

But honestly, no one really cares about the past. Everyone wants to try and guess where things might be headed in the future. And that is not so easy, especially when many market technicians continue to be bearish, pointing out that future earnings are likely to be weak, that a recession is inevitable, that the Fed will continue to raise rates. Yet as you can see in the chart above, the market has shown remarkable resilience in spite of all of the naysayers. Which brings me to the big question — what’s next?

We’re going to explore that exact subject in our upcoming webinar,“The Bull’s Eye Forecast” next Saturday, April 15, when Tom Bowley discusses Market Manipulation and Market Rotation and teaches participants profitable strategies for current market conditions. You can register for this FREE, timely event by clicking here.

No one cares about your money more than you. This is why you need to pay more attention to what is ACTUALLY happening rather than what is being communicated to you by those who have their own interests in mind.

At your service,

John Hopkins

EarningsBeats.com

In this episode of StockCharts TV‘s The MEM Edge, Mary Ellen reviews the impact of weak economic data on the markets as defensive areas outperformed and growth stocks took a break. She also details how to identify a downtrend reversal amid sector rotation.

This video was originally broadcast on April 7, 2023. Click on the above image to watch on our dedicated MEM Edge page on StockCharts TV, or click this link to watch on YouTube. You can also watch on our on-demand website, StockChartsTV.com, using this link.

New episodes of The MEM Edge air Fridays at 5pm PT on StockCharts TV. You can view all previously recorded episodes at this link. You can also receive a 4-week free trial of her MEM Edge Report by clicking the image below.

Pablo Picasso is known as the father of cubist painting. He and others used geometric shapes and patterns to represent a specific form.

Cubism, in Picasso’s mind, was created to emphasize the different ways of seeing the world around us. Picasso painted cubes and shapes using the concept of relativity while employing multiple perspectives.

The market in 2023 feels like a cubist painting. The different indices and sectors relate to one another with a similar concept of relativity and multiple perspectives. And, clearly, these multiple perspectives have distorted reality and perception, yet still are recognizable.

Using the Timeframes within Business Cycles: Expansion, Peak, Contraction, Trough

Some sectors/indices are in expansion.

Some sectors/indices are in contraction.

Others are more stagnating or not quite expanding nor contracting.

Nothing appears to have peaked yet, and possibly some areas may have seen their trough.

Even in terms of inflation/disinflation, the same cubist analogy holds true. Some areas look more disinflationary, while other areas look more inflationary.

In other words, everything is happening at the same time, which defies the logic of fitting the market or economy into a symmetrical box. Or, trying to fit a round peg in a square hole.

How do you invest at this time?

The areas in expansion are in growth and chip stocks. The precious metals, and many industrials, are as well. (DIA is closest to breaking out, with QQQs second.) A few areas in contraction are the regional banks, discretionary retail, small caps, and, in energy, natural gas.

Sectors/Indices are in stagnation, and it’s perhaps the most difficult to predict their next move. This can really be seen in the S&P 500, transportation, and oil.

The same is true with inflation and disinflation. Some areas of disinflation can be seen with the recent ISM and PMI numbers. Housing and labor patterns tend to support disinflation. Yet inflation has not gone away, especially if one considers the falling yields and dollar. We have seen a massive rally in sugar, coffee, gold, silver, and metal miners.

Looking for signs, we see that on Thursday, Regional Banks showed signs of a potential double bottom (a trough). KRE held the March low as this past week; the price came close to that low, yet held closing green for the day. (Although still red for the week.)

We want to see the price clear the cyan line or 10-Day moving average.

Momentum on our Real Motion Indicator, interestingly, showed a mean reversion in March. Since then, momentum has picked up only slightly.

KRE is key as it is a part of the small caps or Russell 2000. Should KRE continue to run from here, that will boost the entire market, offering lots of low-risk opportunities.

Some Favorites:

Both Utilities and the Agriculture ETF DBA have been recent subjects on the Daily and should remain on your radar.

Other sectors to watch are:

Global Live Streaming Sports/Music-PARA FWONA TME RUMEmerging Markets-VGK DAX FXI VNMMedical/Healthcare-VRTX BIIB TEVACommodity Staples or Commodity-based companies that have pricing power-TECK VLO

We will report more on these in the coming week. In the meanwhile, have a very Happy Easter weekend.

For more detailed trading information about our blended models, tools and trader education courses, contact Rob Quinn, our Chief Strategy Consultant, to learn more.

IT’S NOT TOO LATE! Click here if you’d like a complimentary copy of Mish’s 2023 Market Outlook E-Book in your inbox.

“I grew my money tree and so can you!” – Mish Schneider

Get your copy of Plant Your Money Tree: A Guide to Growing Your Wealth and a special bonus here.

Follow Mish on Twitter @marketminute for stock picks and more. Follow Mish on Instagram (mishschneider) for daily morning videos. To see updated media clips, click here.

Mish in the Media

Mish and Charles Payne rip through lots of stock picks in this appearance on Fox Business’ Making Money with Charles Payne.

Mish talks Beyond Meat (BYND) in this appearance on Business First AM.

In this guest appearance on the Madam Trader podcast, recorded March 20, Mish shares her journey from special education teacher to commodoties trader and now trading educator. Hear her insights on the spring 2023 market conditions and how to harness the right skills to succeed.

Follow Mish as she breaks down current market conditions for her friends across the pond on CMC Markets.

Mish talks about Dominion Energy with Angela Miles in this appearance on Business First AM.

Mish chats with Neils Christensen on Oil and Gold in this article from Kitco.

See Mish’s presentation at Real Vision’s Festival of Learning, exclusively available for Real Vision members.

Mish talks with CNBC Asia about hope, fear, and greed, and what could happen going forward.

Coming Up:

April 11th: Webinar with Bob Lang

April 13th: The Final Bar with David Keller on StockCharts TV and Twitter Spaces with Wolf Financial

April 24-26: Mish at The Money Show in Las Vegas

May 2-5: StockCharts TV Market Outlook

ETF Summary

S&P 500 (SPY): 405 support and 410 pivotal.Russell 2000 (IWM): 170 support, 180 resistance still,Dow (DIA): Through 336.25, could go higher.Nasdaq (QQQ): 325 resistance, 314 10-DMA supportRegional banks (KRE): 41.28 March 24 low held, now has to clear 44.Semiconductors (SMH): 247 is the most significant support.Transportation (IYT): Held weekly MA support and now must clear 224.Biotechnology (IBB) Great job changing phases to bullish, but must confirm over 130.Retail (XRT): Don’t want to see this break under 59.75, and best if clears 64.50.

Mish Schneider

MarketGauge.com

Director of Trading Research and Education

On this week’s edition of Moxie Indicator Minutes, markets look poised to move higher, so TG takes a look at higher time frame charts to get a feel for how they begin. He then drills down to the Daily and Hourly to find out exactly how they moved.

This video was originally broadcast on April 7, 2023. Click this link to watch on YouTube. You can also view new episodes – and be notified as soon as they’re published – using the StockCharts on demand website, StockChartsTV.com, or its corresponding apps on Roku, Fire TV, iOS, Chromecast, Android, and more!

New episodes of Moxie Indicator Minutes air Fridays at 1:15pm ET on StockCharts TV. Archived episodes of the show are available at this link.

TG also hosted the Thursday, April 6 edition of StockCharts TV’s Your Daily Five, where he examines charts that have consistently shown patterns and themes that indicate they are ready to go up.

On this week’s edition of StockCharts TV‘s StockCharts in Focus, Grayson is back to walk you through the scanning tools on StockCharts and explain the basics of creating custom screens. He digs into one of his own custom checklist scans, breaking things down line by line to help you more clearly understand the way scans work on StockCharts. He also shows you how easy it is to create your own custom scans without writing any syntax yourself by using the Scan Components section of the workbench. At the end of the show, Grayson shares some of the key resources you need to learn more about advanced scanning, and highlights two tools that you can use to run scans in just a single click.

This video was originally broadcast on April 7, 2023. Click on the above image to watch on our dedicated StockCharts in Focus page on StockCharts TV, or click this link to watch on YouTube. You can also watch on our on-demand website, StockChartsTV.com, using this link.

New episodes of StockCharts in Focus air Fridays at 3pm ET on StockCharts TV. You can view all previously recorded episodes at this link.

You invest in the stock market to make money, but you also want to preserve your capital. And in an investment environment dominated by uncertainty—regional bank fallout, inflation, rising interest rates, geopolitical tensions—investors are leaning towards implementing defensive strategies for their portfolios.

One of the defensive sectors that have gained traction in the last month is Consumer Staples. So it shouldn’t come as a surprise to see a stock in that sector like Procter & Gamble (PG) gain favor among investors (click on chart below for a live version).

CHART 1: DAILY CHART OF PG STOCK. The stock price is almost at a resistance level. It could pull back from there, but what happens after the pullback could indicate whether the upward move is likely to continue.Chart source: StockCharts.com. For illustrative purposes only.

Looking at the daily chart of PG, the stock price is approaching a resistance level of just above $153. There’s a high probability that PG stock will pull back, not because it’s close to its resistance level, but because volume has stayed below its 25-day moving average in the last four trading days.

It may help to look at a longer-term chart of PG, such as a weekly chart (see chart below), to confirm the price movement in the stock.

CHART 2: WEEKLY CHART OF PG. The stock is trading above its 50-, 100-, and 200-day moving averages and could reach its all-time high price of $161.67 and may even bust through it, depending on underlying economic conditions. Chart source: StockCharts.com. For illustrative purposes only.

So, if the stock is ripe for a pullback, why would it be one to add to your ChartLists? For the following reasons:

Momentum. Price action during the pullback can indicate the strength of the next upward move. If the stock were to pull back to around $148 (blue dashed line) and bounce back up from there on strong momentum, there’s a high probability of the stock hitting its all-time high of $161.67 (red dashed line). And if the Consumer Staples sector continues to outperform, then the stock could hit a new all-time high.Moving averages. The stock is trading above its 50-, 100-, and 200-day moving averages. This further confirms the uptrend.Price relative/relative strength. The relative strength with respect to the S&P 500 index ($SPX) is trending higher. For as long as that uptrend is in play, PG would be a great candidate for a long position, all else equal.StockCharts Technical Ranking. After running a SCTR scan that scans for large-cap stocks with a SCTR that has crossed above 80, PG was a chart that deserved some more insight. If the SCTR stays above 70 during the pullback and moves higher on the bounce, the likelihood of a further upward move in the stock’s price would be strengthened.

The Final Word

Although it may not be time to hit the buy button just yet, it’s worth watching how the overall economic environment plays out. The March jobs report suggests the labor market could be softening, and, if that’s the case, there’s a chance the Fed will slow down its interest rate hikes to maybe just one more quarter-point hike this year. If that’s the case and we’re in an economy that’s in “slow growth” mode, then Consumer Staples stocks will probably be in favor. And that could give PG a boost.

Disclaimer: This blog is for educational purposes only and should not be construed as financial advice. The ideas and strategies should never be used without first assessing your own personal and financial situation, or without consulting a financial professional.