Archive

2023

Browsing

House Republican Conference Chair Elise Stefanik is renewing criticism of what she called an ‘unacceptable’ trip to China by Secretary of State Antony Blinken last month, after reports that the State Department discovered a hack into official emails just as Blinken was about to embark on the trip.

‘The State Department knew Communist China was carrying out an extensive hacking campaign to collect intelligence against the United States, yet Secretary Blinken still went to Beijing, legitimizing the CCP’s aggressive behaviors in the process,’ Stefanik, R-N.Y., said in a statement to Fox News Digital. 

‘This is unacceptable and exactly why I called for the cancellation of Secretary Blinken’s trip,’ she said.

The New York Times reported that the State Department discovered a hack, which began in May, into the email accounts of Commerce Secretary Gina Raimondo as well as State Department officials before Blinken made the trip to Beijing — which had been delayed over the Chinese spy balloon incident in February. The Times reported that the State Department discovered the intrusion on June 16, the same day Blinken left from Washington, D.C., for the trip.

‘The Department of State detected anomalous activity, took immediate steps to secure our systems, and will continue to closely monitor and quickly respond to any further activity. As a matter of cybersecurity policy, we do not discuss details of our response and the incident remains under investigation,’ the department said this week in a statement.

‘The Department of State has a robust cybersecurity program to protect our systems and information and works continuously to build resilience and stay ahead of malicious actors. We continuously monitor our networks and update our security procedures.’

Officials said classified information was not accessed through the emails, The New York Times reported.

It marks the latest hostile action by the Chinese regime, which not only launched a spy balloon across the U.S. earlier this year, but has also sought to build spy bases in Cuba. It has also launched a widespread hacking campaign against the U.S. and other nations.

The intelligence community’s annual threat assessment stated that China represents the ‘broadest, most active, and persistent cyber espionage threat to U.S. Government and private-sector networks.’

Officials have warned that China is ‘capable of launching cyberattacks that could disrupt critical infrastructure services within the United States, including against oil and gas pipelines, and rail systems.’

Reuters reported that Blinken told China’s top diplomat this week that any action targeting the U.S. government, companies or citizens ‘is of deep concern to us, and that we will take appropriate action to hold those responsible accountable.’

But Republicans have criticized the Biden administration for what they see as a soft and dismissive approach to the threat from communist China as it seeks to create good relations with Beijing. 

President Biden last month said that the balloon incident was ‘more embarrassing than it was intentional’ and said he hopes he could speak to President Xi Jinping about how the U.S. and Beijing could ‘get along.’

Stefanik doubled down on that criticism this week.

‘President Biden’s desire for a ‘thaw’ in relations with the CCP continues to be the incorrect approach,’ Stefanik said in her statement. ‘Instead, we must pursue peace through strength in order to deter further CCP aggression.’

Fox News’ Nicholas Kalman contributed to this report.

This post appeared first on FOX NEWS

President Biden’s latest weird interaction with a little girl has once again drawn attention to his frequent awkward behavior with the children of other people.

The president appeared to nibble at the shoulder of a startled young Finnish girl during his departure from Helsinki on Thursday, according to video taken as he greeted embassy staff members and their families before boarding Air Force One.

The video showed Biden leaning into the girl, who was being held by a woman who appeared to be her mother, and placing his mouth on her shoulder as he nibbled lightly. The girl appeared frightened, and later turned away when Biden tried to give her a peck on the head.

In October, Biden was ripped on social media for telling a young girl not to have a serious relationship until she turns 30.

‘Now a very important thing I told my daughters and granddaughters — no serious guys until you’re 30!’ Biden said to the unknown young woman at an event in Irvine, California.

‘Ok,’ the woman said as the president leaned in close. ‘I’ll keep that in mind.’

During a speech to the National Education Association a month earlier, Biden left people disturbed and confused following a cryptic remark about a friendship he had with a 12-year-old girl when he was 30.

The instance occurred when Biden interrupted his speech to address a woman in the crowd he apparently knew long ago. He said, ‘And everybody found out, there’s not a lot of total climate deniers anymore after they’ve seen what happened this year. But guess what, we got a lot to do.’ 

He then pointed into the crowd, and in a low voice said, ‘You gotta say hi to me.’ The crowd laughed and Biden said, ‘We go back a long way. She was 12 and I was 30, but anyway. This woman helped me get an awful lot done. Anyway.’

In 2021, Biden made what some referred to as a ‘creepy’ comment about a young girl looking 19 ‘with her legs crossed’ during a speech to military families in Virginia ahead of Memorial Day.

He stopped his speech at one point to give a shoutout to the young daughter of a veteran who also addressed the crowd. 

‘I love those barrettes in your hair,’ Biden said to the girl in the audience. ‘Man, I’ll tell you what, look at her. She looks like she’s 19 years old sitting there like a little lady with her legs crossed.’

On another occasion years earlier, Biden discussed his younger days serving as a lifeguard at a pool in Delaware, but oddly described how children would rub his wet leg hair.

‘I got hairy legs that turned … blonde in the sun. And the kids used to come up and reach into the pool and rub my leg down so it was straight and watch the hair come back up again,’ Biden recalled during a speech at the Joseph R. Biden Jr. Aquatic Center in Wilmington, Delaware in June 2017. 

He then said he ‘learned about kids jumping on my lap, and I loved kids jumping on my lap.’

One of the most famous instances of Biden acting awkwardly around children was in 2015, while serving as vice president, when he oddly whispered into the ear of Sen. Chris Coons’ daughter during his swearing in ceremony for another Senate term.

In video that captured the exchange, the girl looked visibly uncomfortable and pulled away when Biden tried to give her a peck on the cheek.

Coons later defended Biden, telling Fox News in an interview at the time that his daughter didn’t think he was ‘creepy.’

Fox News’ Kyle Morris, Gabriel Hays, Joseph A. Wulfsohn, Ronn Blitzer and Andrew Mark Miller contributed to this report.

This post appeared first on FOX NEWS

Inflation is expected to remain a hot topic as the 2024 campaign season ramps up. The price of gasoline has consistently been an issue front and center in most recent elections.

‘Voters feel the impact of rising gasoline prices, perhaps more than any policy that a politician puts in place,’ said Phil Flynn, a senior market analyst at The PRICE Futures Group. ‘Politicians are very cognizant of oil prices. They’re cognizant of gasoline prices because voters care about them probably more than they do on most issues.’

During President George W. Bush’s first term in office, the average weekly price per gallon of gas was $1.59. That is the lowest price among recent presidential terms. In the 2002 midterm elections, Republicans gained seats in the House and Senate. They picked up even more in 2004 as President Bush was re-elected.

‘There’s a really strong inverse relationship between pump prices and approval ratings at a presidential level, and it hasn’t changed in four decades,’ Clearview Energy Partners Managing Director Kevin Book said.

Prices were higher and more volatile during President Bush’s second term. The average price was $2.77. Costs spiked in July 2008 to a weekly high of $4.17. By Election Day in November, prices had fallen to $2.46. The steep drop did little to help the Republican Party. Democrats added seats in the House and Senate, and Barack Obama was elected president.

According to the American Petroleum Institute, the amount of oil produced on federal lands plummeted while President Obama was in office.

‘When a president comes into office, they can set the stage as far as energy policies that signals to the market that can have a big impact on whether prices rise or fall,’ Flynn said. ‘The reality is the president can make policies that can make prices cheaper than they would have been.’

The average gas price during President Obama’s first term was $3.12. During the 2010 midterm elections, prices were on the rise as Republicans picked up more than 60 seats in the house. Two years later, 2012 marked the highest average price per gallon for any year during Obama’s presidency. Prices fell nearly 40 cents in the two months leading up to election day. Republicans lost eight seats in the house – and two in the senate as President Obama won re-election.

When President Trump came into office, he vowed to increase domestic oil production. During his single term, the U.S. recorded the lowest gas prices since President George W. Bush’s first term. The average cost was $2.57. The average price during President Biden’s partial term, has been more than one dollar higher per gallon with $3.60 as the average cost.

President Biden recently faced criticism over releasing oil from the strategic reserve ahead of the 2022 midterm elections. Prices fell from more than $5.00 in June to around $3.80 in November.

‘Presidents know that their popularity ratings can go up and down with gasoline prices, and they have done some major things to try to cool off prices before the election,’ Flynn said.

President Biden and Democrats have blamed Russia’s invasion of Ukraine for the high gas prices. They also said the release was necessary as the U.S. recovered from the global pandemic. Some energy experts argue the release was in fact strategic.

‘The Biden administration started releasing our strategic reserves as a way to bring energy prices down, which is clearly not what our strategic reserves are meant for. They’re meant for short-term supply disruptions to address short-term price spikes, not as a long-term market manipulation tool in the run-up to the election,’ said Anne Bradbury, CEO at American Exploration and Production Council.

Analysts also acknowledge while policy can influence gas prices, the November drop has more to do with timing.

‘More than likely, what’s happening, before the election in November, it’s less people are driving. Usually gasoline prices go up into Labor Day and then crash after Labor Day because everybody’s back in school, nobody’s traveling,’ Flynn said. ‘It’s a normal seasonal pattern.’

As the 2024 campaign heats up, seasonal patterns likely will not stop politicians from blaming each other for the rise and fall of gas prices.

‘People care an awful lot about the price at the pump, and they don’t care about a lot of the details,’ Book said. ‘It’s very hard to explain a price going up when you’re going to the polls.’

This post appeared first on FOX NEWS

In this episode of StockCharts TV‘s The MEM Edge, Mary Ellen reviews where the markets closed after two positive inflation reports. She also shares the strongest areas with specific stocks while highlighting what to be on the lookout for as we head into earnings season.

This video originally premiered July 14, 2023. Click on the above image to watch on our dedicated MEM Edge page on StockCharts TV, or click this link to watch on YouTube.

New episodes of The MEM Edge premiere weekly on Fridays. You can view all previously recorded episodes at this link. You can also receive a 4-week free trial of her MEM Edge Report by clicking the image below.

On this week’s edition of StockCharts TV‘s StockCharts in Focus, Grayson presents some of the exciting new features that have just rolled out across the site. These new tools are going to help you stay on top of all the action this earnings season, showing which companies are beating, which companies are missing, and everything in-between. We have new data and visualizations that are all designed to help you make informed decisions with trading and investing.

This video originally premiered on July 14, 2023. Click on the above image to watch on our dedicated StockCharts in Focus page on StockCharts TV, or click this link to watch on YouTube.

You can view all previously recorded episodes of StockCharts in Focus at this link.

On this week’s edition of Moxie Indicator Minutes, TG notes that it’s been a very strong 5 days and the market is starting to take a well-deserved break. This behavior is similar, but opposite, to the 5 down days we had the week before 4th of July, where the market sprung up after the pullback. So now the market could use a rest, but, overall, TG sees strength.

This video was originally broadcast on July 14, 2023. Click this link to watch on YouTube.

New episodes of Moxie Indicator Minutes premiere weekly on Fridays. Archived episodes of the show are available at this link.

In this special episode of StockCharts TV‘s The Final Bar, Dave answers questions from the mailbag on all things technical analysis and market strategy. He shares best practices on charting inflation rates, how the put/call ratio can be used for trend analysis, Elliott Wave corrective patterns, back testing technical indicators, and how to pick which technical indicators to use in your trading!

This video was originally broadcast on July 14, 2023. Click on the above image to watch on our dedicated Final Bar page on StockCharts TV, or click this link to watch on YouTube.

New episodes of The Final Bar premiere every weekday afternoon. You can view all previously recorded episodes at this link.

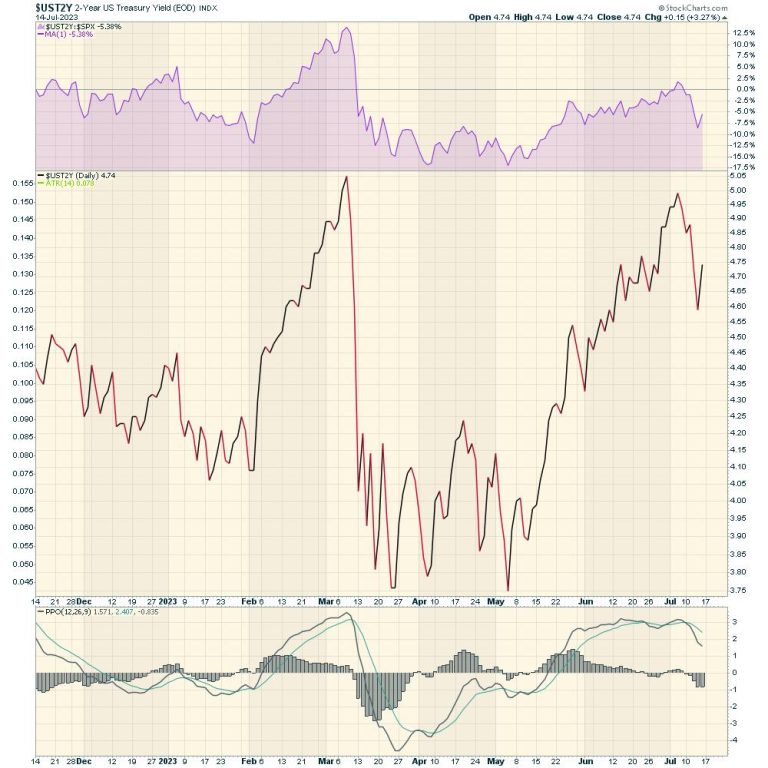
US bond yields dropped sharply this week. Below is the 2-year yield. One of the important technical characteristics of the chart is a double top. When a chart tests a prior high, we want to see if it succeeds or fails at the prior level which was resistance once before. Clearly the 2-year stopped and did a hard reversal. This pattern suggests the recent top could be a more intermediate top for the bond market, rather than just a short term stall in price action.

With such a big focus on equity market gains recently, perhaps the bond market is waking up. The short term notes have higher yields than longer term bonds which means the yield is inverted. You would expect a lender to get a higher rate of interest for loaning further out into the future. When they don’t get that premium, it is called an inverted yield curve.

What I noticed about the yield chart for the USA was the speed of the decline this week. The 2-year yield is down 40 basis points or almost 10% from last weeks high. The 3- and 5-year yields were down more on a percentage basis!

The spread between the 5-year yield and the 30-year yield last week was more than 30 basis points. On Thursday the difference was just 3 points so the spread dropped 90%. If we have put in the highs for the bond yields, that means we have put in the lows for the bond prices. Even if the bond market continues to drift sideways, the investor is still collecting a significant yield. But if we do have a recession next year, typically the bond prices will rise as the Fed lowers rates paying us yield and capital gain.

On the Market Buzz this week, I showed how the rest of the world equity charts were starting to slip. Perhaps this will start a rotation into bonds in foreign markets?

I started to hunt down some foreign government bond ETF’s perking up. There were some bond charts that showed up as more interesting than in recent weeks. As an example, emerging market bond fund ETF’s look good based on the charts. One of the things to watch for is will bond prices start to rally if we have equity market weakness?

This leads to two scenarios:

If the rest of world is entering the recession before America, perhaps their government bonds are starting to move higher which could provide a regular dividend payment and capital gains.On the other hand, if the recession fears are overblown, then some of the other high yield or corporate bond charts might improve more as the central banks pause or start lowering rates.

Let’s look at both ideas below.

Emerging Market High Yield Bonds

The case for emerging market high yield bonds getting better is shown below.

The chart ticker is EMHY. The chart is high yield emerging markets. This chart pays a 7% dividend and is starting to break out to the upside. That suggests an improving outlook.

Corporate Bonds

The next chart is for emerging market corporate bonds, but not high yield (higher risk). This chart is also turning up, and made the highest high since February. It pays a 4.4% dividend. Are the emerging market economies starting to improve as both of these charts look good?

Government Bonds

Now if the emerging market world struggles as their equity charts appear to be saying, it might be better to buy emerging market government bonds in an economic downturn. In 2022, we had an interesting year as both bonds and equities fell together. Usually, we tend to see bonds do well when stocks are weakening. If we are going back to a normal rotation, perhaps we’ll see the interest in government bond markets perk up. As yields fall, bond prices rise. Capturing a yield as well as capital appreciation makes the trade work out nicely. The yield is 5.4% on this government bond ETF!

What these charts suggest to me is the highs for the emerging market bond yields are in, and we are starting to see bond prices rise. Will high yield continue to go higher with government bonds?

Every week, the stock market continues to surprise on the upside. We have been talking about the big moves up in commodities over the last few weeks. I’ll have a lot more ideas after rolling through the charts this weekend. If you would like to sample our work, there is a $7 – 1 month trial subscription offer that you can try at OspreyStrategic.org. This will also allow you to read up on our past newsletters and watch our previous videos.

One of the things our members have found helpful is the Osprey Opportunities page, with good looking charts provided based on themes or industries.

I think you’ll find using the Osprey Opportunities pages to be helpful. Feel free to try it at OspreyStrategic.org for just $7.

In the Bible story, David and Goliath represent resilience and overcoming odds. David, a small sheepherder, places a stone in a sling to hurl at Goliath’s head. David gets a clean hit and Goliath falls. David then uses Goliath’s sword to kill and decapitate the giant.

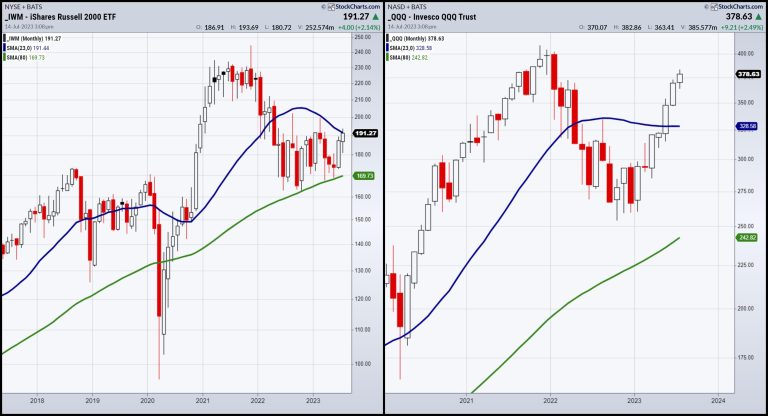
If we look at the small caps and the large caps as seen through the lens of IWM and QQQ, it certainly has similarities to the parable.

Small caps, like David, have had to overcome odds to show resilience. In October 2022, both IWM and QQQs bottomed out. Then, in February 2023, it almost looked like the small caps were ripe to take out the 23-month moving average in blue (or about a 2-year business cycle)… until the commercial bank crisis.

If you are new to the Dailys, I have written extensively on the 2-year cycle as key this year, given the bull run of 2021 and the bear run of 2022. This year, we knew could be pivotal. But is it really?

Once the small caps fell from the key resistance, Goliath woke up. Large caps began to rally, departing from the weakness of the small caps. QQQs kept going and, by May, cleared the 23-month, and off it went. Meanwhile, IWM struggled to hang on to the 80-month or about the 6-to-8-year business cycle low. Except for the COVID crash, IWM has been above the 6-8 year low for over a decade. In fact, we avoided the recession from a technical perspective as not only did that business cycle low hold, but in June the IWM began to run up as well.

Anyway, back to our story. It seemed that, this past week, small caps were once again ripe to run. Of course, NASDAQ has not stopped. After all, technology, according to market sentiment is the savior of everything… but is it really?

Here is where David v. Goliath comes in. Small caps once again ran right to the 23-month moving average and closed the week below it. Now, it may clear it later on this month. If IWM does clear, we think that will take some thunder from the large caps with another rotation to value, but not necessarily the final blow for QQQs. However, if IWM cannot clear, then we can begin to speculate that David has slung the rock at NASDAQ’s giant head. Only this time, they both may fall.

Why might IWM not clear the 23-month MA? Inflation, Fed hikes, bonds back in vogue, poor earnings, consumers cutting back??? Take your pick. It is though, too soon to tell.

But let’s end with a potential stone.

Consumer Staples (XLP).

As this just cleared the 50-daily moving average, a move over 75.00 could indeed signal that the consumer is shifting away from toys, and more towards things they really need.

For more detailed trading information about our blended models, tools and trader education courses, contact Rob Quinn, our Chief Strategy Consultant, to learn more.

“I grew my money tree and so can you!” – Mish Schneider

Get your copy of Plant Your Money Tree: A Guide to Growing Your Wealth and a special bonus here.

Follow Mish on Twitter @marketminute for stock picks and more. Follow Mish on Instagram (mishschneider) for daily morning videos. To see updated media clips, click here.

Mish in the Media

Mish talks her approach to being a professional trader in this Options Insight interview with Imran Lakha.

Nicole Petallides and Mish discuss crypto, basic materials, inflation and gold in this appearance on TD Ameritrade.

Mish and Ash Bennington cover a lot in this video from Real Vision, discussing everything from the Fed, to inflation, to the incredible move in stocks and what is next.

Mish talks day-trading tactics, currency pairs, gold, oil, and sugar futures in this video from CMC Markets.

Mish and Angie Miles talk tech, small caps and one new stock in this appearance on Business First AM.

Mish examines the old adage “Don’t Fight the Fed” in this interview on Business First AM.

Mish and Charles Payne talk the Fed, CPI, Inflation, yields, bonds and sectors she likes on Fox Business’ Making Money with Charles Payne.

Mish, Brad Smith and Diane King Hall discuss and project on topics like earnings, inflation, yield curve and market direction in this appearance on Yahoo Finance.

Mish reviews her first-quarter trades in this appearance on Business First AM.

Mish talks women in the trading space and covers a wide variety of ideas in this interview for FreeFX.

Mish runs through bonds, modern family, commodities ahead of PCE on Benzinga.

Coming Up:

July 21: BNN Bloomberg

ETF Summary

S&P 500 (SPY): 450 pivotal area failed 440 support.Russell 2000 (IWM): 193 is the 23-month holy grail.Dow (DIA): 34,000 pivotal.Nasdaq (QQQ): Great weekly close, so IWM will definitely be key.Regional banks (KRE): 42.00-44.00 range.Semiconductors (SMH): Where Goliath goes, so do semis — another potential reversal top.Transportation (IYT): Under 250, some trouble.Biotechnology (IBB): 121-130 range.Retail (XRT): 65.00 key support for this coming week.

Mish Schneider

MarketGauge.com

Director of Trading Research and Education

As the trading week ends, the better-than-expected earnings from three big banks, Delta Airlines (DAL), and Pepsi Co (PEP) added more excitement to end an exciting trading week.

The one sticking point is the University of Michigan consumer sentiment survey, which showed that confidence in the economy boomed but suggested that inflation may not be as soft as the CPI and PPI indicated earlier this week. That news saw a bit of a selloff in the S&P 500 index ($SPX) and the Nasdaq Composite ($COMPQ) but the Dow Jones Industrial Average ($INDU) closed higher, its best weekly performance since March. Communication Services and Technology sectors are still holding strong, which has brought more investor optimism into the financial market. 

You have probably heard about how the largest seven stocks have been driving the stock market rally. But it looks like other stocks are joining that rally. If you look up the chart of the Direxion Nasdaq-100 Equal Weighted Index (QQQE) and compare it with the Invesco QQQ Trust (QQQ), the two have been moving in sync. And the Accumulation/Distribution line in the lower panel shows that accumulation is rising—an indication of good upside follow-through.

CHART 1: MARKET PARTICIPATION IS BROADENING. QQQE and QQQ are moving in sync, and accumulation is trending higher. Chart source: StockCharts.com (click on chart for live version). For educational purposes.

There’s a lot of positive momentum in the market. Many stocks are reaching new all-time highs or 52-week highs. If you run these two scans, you may be surprised at the number of stocks and ETFs that meet the scan criteria.

How to Run Scans. From Your Dashboard or Charts & Tools, scroll down to the Sample Scan Library. Click Browse Scan Library and run the New All-Time Highs and New 52-Week Highs scans.

When so many stocks and ETFs are reaching new highs, it’s hard to argue against a bull market. Great traders trade with the trend. And when the market has strong momentum behind it, it’s best to take advantage of trading opportunities.

There’s the likelihood of many of these stocks reaching overbought levels, which may make them pullback candidates. Using shorter moving averages such as the 20- or 25-day can act as an initial support level for a pullback. One example is the daily chart of Nvidia Corp. (NVDA) below.

IS NVDA READY FOR A PULLBACK? NVDA may be entering overbought territory. Keep an eye on the stochastic oscillator, especially if the stock pulls back to its 20-day moving average. Chart source: StockCharts.com (click chart for live version). For educational purposes.

NVDA has been a top-ranking SCTR candidate since February 2023. Looking at the Stochastic Oscillator in the bottom panel, you see that, when the stock pulled back to its 20-day moving average, the stochastic fell. But the stochastic didn’t reach the 50 level. When NVDA bounced off the 20-day MA and rallied higher, the stochastic oscillator turned higher and moved into overbought territory. Looking at the stochastic oscillator, the stock may have further upside movement. If it pulls back to the 20-day MA, it could present a buying opportunity.

Great traders trade with the trend.

And now that smaller caps, other sectors such as Industrials, and international equities are showing signs of catching up with the larger caps, there may be some lower-priced stocks you can jump on.

Earnings Season is Here

So far, this quarter’s earnings have been solid but this is just the start. Next week is chock full of earnings. Wall St. will focus on guidance, since that will indicate what to expect in the future. In a rising market, a little bit of bad news could send stocks lower. So, it’s a good idea to keep an eye on the big picture. A couple of points to keep in mind as we head into the thick of earning season:

The US Dollar Index ($USD) has fallen below 100. The last time the index was at this level was in April 2022. The lower dollar sent gold, silver, and copper prices higher.Crude oil prices showed signs of a rebound but fell after hitting resistance at its 200-day moving average.Bond yields are also lower. The 10-Year US Treasury Yield Index ($TNX) is trading around 3.8%, which is well below its >4% levels it reached in early July.

The Bottom Line

If the S&P 500 closes above 4500, there’s a chance it could reach its all-time high of 4818.62. The index may hit resistance close to the 4637 level (March 2023 highs), but it may not be a very strong level. And if the S&P 500 pulls back, look at the 4200 level as a support, which aligns with the 200-week moving average. It may also be worth keeping an eye on earnings. Some heavyweights are reporting next week (see below for a list), and any mention of weak guidance could impact the stock market.

End of Week Wrap Up

US equity indexes mixed; volatility down

$SPX down 0.10% at 4505.42, $INDU up 0.33% at 34509.03 (best week since March); $COMPQ down 0.18% at 14113.70$VIX down 2.28% at 13.30Best performing sector for the week: Consumer DiscretionaryWorst performing sector for the week: EnergyTop 5 Large Cap SCTR stocks: Super Micro Computer, Inc. (SMCI), NVIDIA Corp. (NVDA), Coinbase Global Inc. (COIN), Palantir Technologies, Inc. (PLTR), DraftKings Inc. (DKNG)

On the Radar Next Week

Earnings season in full swing. Some companies reporting next week: Bank of America (BAC), Morgan Stanley (MS), Charles Schwab (SCWB), Goldman Sachs (GS); Tesla (TSLA), Netflix (NFLX), United Airlines (UAL), American Airlines (AAL), Taiwan Semiconductor Manufacturing Co. (TSMC), Johnson and Johnson (JNJ), and much more.June US Retail SalesJune US Housing StartsJuly Philadelphia Fed Manufacturing Index

Disclaimer: This blog is for educational purposes only and should not be construed as financial advice. The ideas and strategies should never be used without first assessing your own personal and financial situation, or without consulting a financial professional.