Archive

2023

Browsing

Fargo is suing the state of North Dakota over a new law that bans zoning ordinances related to guns and ammunition, continuing a clash over local gun control.

The state’s biggest city has an ordinance that bans people from selling guns and ammunition out of their homes. The Republican-controlled Legislature passed a law this year that limits cities and counties from regulating guns and ammunition. The law, which took effect Tuesday, also voids existing, related ordinances.

The city’s lawsuit says the ‘stakes are much higher’ and gets at whether the Legislature can ‘strip away’ Fargo’s home rule powers. Fargo voters approved a home rule charter in 1970 that gave the city commission certain powers, including the power to zone public and private property.

‘As it relates to this present action, the North Dakota legislative assembly is upset that the City of Fargo has exercised its home rule powers to prohibit the residents of the City of Fargo – and no one else – from the home occupation of selling firearms and ammunition and the production of ammunition for sale,’ the lawsuit states. ‘Effectively, the City of Fargo does not want its residents to utilize their homes in residential areas as gun stores.’

The city successfully challenged a similar law two years ago.

North Dakota Attorney General Drew Wrigley told The Associated Press his office will evaluate the complaint. Fargo city spokesperson Gregg Schildberger said the City Commission will discuss the lawsuit on Monday during a regular meeting.

Bill sponsor and Republican state Rep. Ben Koppelman told a state Senate panel in April that the issue came to greater attention in 2016 when, because of the ordinance, the federal Bureau of Alcohol, Tobacco, Firearms and Explosives refused to renew the federal firearms licenses of Fargo dealers who sold out of their homes.

‘What is at issue is whether we want local governments creating gun control or whether we want gun regulations to remain a state-controlled issue,’ Koppelman said in April. ‘Without this bill and in light of the (2021) court opinion, I think local political subdivisions could propose all sorts of local gun control, and based on the anti-gun track record of the City of Fargo Commission, I think we could expect it.’

Koppelman did not immediately respond to a phone message for comment.

<!–>

This post appeared first on FOX NEWS

–>

They ran for their lives.

They were told to do so.

And after dashing down three flights of spiraling staircases, reporters trying to flee the Russell Senate Office Building ran directly into a wall of U.S. Capitol Police officers pointing their guns directly at the press corps.

‘Show me your hands!’ one officer demanded. ‘Hands! Now!’

UFO REVELATIONS HAVE LAWMAKERS IN A SHAKESPEAREAN CONUNDRUM
 

Even the U.S. Capitol complex is not immune to ‘swatting.’

This may have been what happened Wednesday afternoon when Capitol Police thought an active shooter roamed the Senate hallways.

Police instructed aides and journalists to get out of the building as fast as they could.

‘Swatting’ is when someone phones in a prank to police. They might report a hostage situation. Call in a bomb threat. The hoax is an effort to prompt dispatchers to send a contingent of law enforcement — perhaps the SWAT team, short for special weapons and tactics — to a given address. 

What sometimes happens is an innocent person targeted in the swatting is taken into custody or sometimes even injured by police.

No one was injured during this week’s incident on Capitol Hill.

But here’s what went down.

Washington, D.C., police received a 911 call Wednesday afternoon. They were warned on an ‘active shooter’ inside the Hart Senate Office Building. The D.C. police then relayed this to the U.S. Capitol Police.

U.S. Capitol Police Chief Tom Manger said they were looking for ‘a heavyset Hispanic male wearing body armor.’

Manger said about 20 officers immediately started combing through the Senate office buildings, ‘going floor to floor’ looking for a possible gunman.

Fox was told they first believed the threat may be in the Russell Senate Office Building.

No one ever heard any gunshots. And no one in the Senate office buildings ever spotted anyone with a gun.

USCP advised those working in the Senate office buildings of ‘an internal security threat.’ They advised people inside the buildings to ‘move inside your office or the nearest office.’ 

Those in public spaces should ‘find a place to hide or seek cover.’ But officers shouted for some people to evacuate. That included reporters, producers and photographers on the third floor of the Russell building.

News crews occupy an array of spaces on the third floor of Russell near its ornate rotunda full of arcades and columns. The complete compliment of Senate aides might not be toiling away in senators’ offices during the August congressional recess. But you can bet the swarm of members from the Capitol Hill press corps is present — recess or not.

USER’S MANUAL TO DEVON ARCHER’S CLOSED-DOOR INTERVIEW TOMORROW

And so they sprinted down the stairs.

Descending from the third floor.

To the second floor.

To the first.

That’s when the reporters encountered a phalanx of several Capitol Police officers, weapons drawn.

In fairness to the officers, they were likely worried about this scampering horde racing down the staircase, only hearing shouting and galloping from above. No wonder the officers took a defensive posture in these circumstances.

But more than one source present that day confided to Fox they worried someone may have actually gotten injured considering the chaos. Others complained of ‘mixed messages’ from the Capitol Police.

‘It wasn’t clear at all what we were supposed to do,’ one reporter said.

Another source who works in the basement of the Russell Senate Office Building said officers demanded they exit — quickly.

Someone else said officers directed them to hide in their offices.

So, everyone’s on edge — yet again — here on Capitol Hill.

Those who work in the Capitol complex were already rattled Wednesday. That was just ahead of former President Trump’s appearance in federal court Thursday. Special Counsel Jack Smith indicted the former president in connection with the 2021 riot at the Capitol and efforts to overturn the certification of the Electoral College during the joint session of Congress.

The E. Barrett Prettyman federal courthouse rests at the foot of Capitol Hill, just off Constitution Ave., NW.

That’s where Mr. Trump appeared Thursday. Capitol Police had not yet visibly increased security around the Capitol complex when the security incident unfolded Wednesday. However, Fox was told additional forces were ready to go. 

By nightfall Wednesday, a ‘bicycle rack’ type fence began encircling the Capitol square. This was not the type of towering fence officials erected around the Capitol after the riot. In fact, the smaller fence is similar to what authorities put up for big events at the Capitol or when certain dignitaries come for meetings.

‘We’ve all been working together in preparation for when and if the indictment did happen,’ Manger said at a press briefing after the scare Wednesday. ‘We’ve been talking about this for a couple of weeks now. We’ve had a couple of phone calls today. So, yeah, we’re prepared for whatever might happen.’

The fence and other preparations were a reminder of Jan. 6.

And the false report of the active shooter propelled those who work on Capitol Hill back to the terror of the riot.

To say nothing of the many other security incidents over the years.

A panicked evacuation of the Capitol in 2022 after authorities thought a plane was inbound.

The killing of Capitol Police Officer Billy Evans in 2021 when Noah Green rammed his car into a Senate barricade.

The wild car chase and shooting during the middle of the 2011 government shutdown.

The killing of two Capitol Police officers by Russell Weston Jr., in July 1998.

Those are only a few of the episodes.
 

The Capitol even elevated its defensive posture this spring when a ‘zombie’ plane with an unresponsive pilot briefly pierced Washington’s hyper-restricted airspace. That prompted F-16 jet fighters to give chase before the errant plane crashed in rural Virginia.

Dozens of security incidents unfold around the Capitol each year. Some just entail closing off a hallway for 45 minutes or so while police investigate. But many are more serious. Havoc ensues.

This is the cycle. Over and over.

We haven’t even talked about the baseball practice shooting or the shooting of former Rep. Gabrielle Giffords, D-Ariz.

An outside observer may say that Wednesday’s episode was ‘nothing.’

That’s true. There was never any bona fide security threat.

But that’s not ‘nothing’ to those who work on Capitol Hill. It’s not nothing to those who scurried down flights of stairs, some screaming in fear, only to face officers, guns drawn, thinking they may be the culprit.

The Capitol complex will always face security threats and evacuations.

But multiple people who have worked on Capitol Hill for years told Fox the regular bedlam and actual risk of life and limb has become too much.

‘No workplace in America is like this,’ said one longtime Senate hand.

On Wednesday afternoon, there was pandemonium. But in the end, officers found nothing.

‘This may have been a bogus call,’ said Manger.

It may have been bogus.

This post appeared first on FOX NEWS

As I returned from vacation last weekend and began to dig through the charts to prepare for the week, I immediately focused on Thursday with both Apple (AAPL) and Amazon (AMZN) reporting earnings. Would this provide the upside catalyst needed for the mega-cap growth stocks to find support at their 50-day moving averages?

By Friday’s close, the answer appeared to be a resounding no, as a number of key market breadth indicators signaled a clear rotation from bullish phase to bearish phase. In today’s article, we’ll break look a little more closely at these bearish breadth indicator patterns, gauge the technical damage to stocks like AAPL after earnings, and consider some downside targets for the S&P 500.

The Market Develops Bad Breadth

As our equity benchmarks have become more top-heavy over time, given the outsized overweight of the mega-cap FAANG stocks, market breadth indicators have become much more important. Market breadth measures participation, usually using some sort of equal-weighted methodology. So while the value of the S&P 500 or Nasdaq 100 is based largely on the performance of the FAANG stocks, an equal-weighted market breadth indicator can tell you much more about the performance of all the other stocks that comprise those indices.

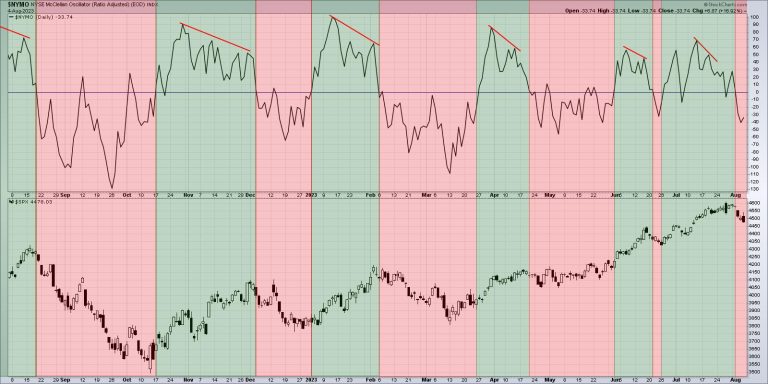
The McClellan Oscillator is based on daily advance-decline data for the NYSE, but smooths out the data using exponential moving averages to form an oscillator. When the indicator is above zero, conditions are bullish, and a level below zero suggests bearish conditions.

The McClellan Oscillator (top panel) just turned negative this week after being bullish through all of July. If you look back at the other red-shaded areas on the chart, you’ll note that all the major pullbacks in the last 12 months have been identified with this sort of bearish rotation.

The Bullish Percent Indexes are a series of breadth indicators based on point & figure charts. Abe Cohen from ChartCraft is credited with taking the simplicity of point & figure chart and adapting the signals to create measures of market breadth.

Here, we’re running a Bullish Percent Index for the Nasdaq 100 index, which means the indicator (top panel) tells you the percent of NDX names that are currently showing a bullish signal on their own point & figure chart. When the indicator breaks above 70% and then back below this extreme level, it suggests a negative rotation.

This bearish signal was triggered this week, indicating that the broad advance through July has set us up for a downside rotation into August. Note the vertical red lines which indicate previous occurrences and you’ll see that the Nasdaq 100 has pulled back to some degree pretty much every time this signal has dropped.

When the market moves higher on stronger breadth, that confirms a broad and healthy advance, with many stock participating in the upside phase. When these breadth indicators turn back negative, as they have this week, it usually confirms the end of the previous bullish phase.

AAPL and AMZN Appear Similar Until They Don’t

It’s always newsworthy when the largest companies are reporting earnings, and this week did not disappoint, with two of the FAANG stocks announcing their latest results on Thursday. What’s so interesting about this particular set of results is that the two stocks — AAPL and AMZN — had very similar technical setups going into their earnings report, but two very different reactions soon after.

Both stocks have been above an upward-sloping 50-day moving average, confirming a consistent uptrend phase. Both names pushed to a new swing high in July, and both saw weaker price momentum going into that new high as the pace of the advance began to dissipate.

After both companies reported earnings on Thursday, Amazon gapped up by about $13, while Apple gapped down to open about $7 lower. What’s very telling, however, is that both stocks finished near their low for the session.

Now we’re looking at a two-month daily candle chart of AAPL, which magnifies Friday’s gap below the 50-day moving average. So after the gap lower at the open, the price rallied into mid-day, only to rotate lower in the afternoon to close at the low. So that means that, while some buyers jumped in and bought AAPL at a discount from Thursday’s close, eventually sellers took control and pushed the price even lower.

AMZN actually gapped higher on Friday, pushing the price well away from its 50-day moving average. But note Friday’s candle, which is called a “shooting star” pattern. This is where the open and close are near the lows of the day, and there is a long upper shadow. This shows that, while the stock did gap higher on the earnings beat, the end of the day was marked by profit-taking as investors were willing to cash in after the bounce higher.

In both cases, the short-term reaction on Friday after earnings suggest that market participants were happy to get out of these names going into the close. This lack of buying power into next week could lead to much further downside for these and other growth stocks.

Considering Downside Targets for the S&P 500

When a chart begins to rotate from a bullish phase to a bearish phase, it’s always a good idea to start thinking about downside objectives. If for no other reason, it forces you out of your predetermined narrative and encourages you to consider different probabilistic outcomes.

Assuming the S&P 500 has reached its peak for this part of the cycle, and is indeed heading lower in August, I’m immediately drawn to the 4200 level for two reasons. First, this would represent a 38.2% retracement of the bullish phase from October 2022 to July 2023. Second, it would bring the price down to a trendline using the October 2022 and March 2023 lows.

Depending on how long it would take to reach that price level, the 200-day moving average could end up being right around that level as well. So there we have three different technical indicators all indicating around 4200 as a reasonable downside target.

A move down to S&P 4200 would mean about a 9% pullback from the July high around 4600. If you study your market history, you’ll see that even the most bullish years usually have two to three pullbacks of around 5-10% each. So this sort of further drop would not be unusual at all, but rather just the normal push and pull of the stock market cycle.

Our latest YouTube video digs into the bearish rotation in market breadth indicators, along with background on how they are derived!

RR#6,

Dave

P.S. Ready to upgrade your investment process? Check out my free behavioral investing course!

David Keller, CMT

Chief Market Strategist

StockCharts.com

Disclaimer: This blog is for educational purposes only and should not be construed as financial advice. The ideas and strategies should never be used without first assessing your own personal and financial situation, or without consulting a financial professional.

The author does not have a position in mentioned securities at the time of publication. Any opinions expressed herein are solely those of the author and do not in any way represent the views or opinions of any other person or entity.

In this episode of StockCharts TV‘s The Final Bar, Dave tracks the bearish rotation for the technology sector as earnings misses for AAPL, PANW, FTNT, and others put downside pressure on the Nasdaq. He answers viewer questions on On Balance Volume, Chaikin Money Flow, and technical analysis techniques when considering LEAPS.

This video was originally broadcast on August 4, 2023. Click on the above image to watch on our dedicated Final Bar page on StockCharts TV, or click this link to watch on YouTube.

New episodes of The Final Bar premiere every weekday afternoon. You can view all previously recorded episodes at this link.

We finished a very heavy week filled with all kinds of data:

Fitch downgradeEarnings — Amazon up, Apple downJobs report — wages risingTreasury Yields higher — at October 2022 highsRecord temperatures around the globe, including winter in S. AmericaOil prices rise 6 weeks in a row

The metals are holding their ground.

The first chart shows gold in contango, which is when the futures price of a commodity is higher than the spot price. Contango occurs when an asset’s price is expected to rise over time. 

Gold spot futures closed right round $1957 per ounce. The GLD ETF chart shows it in a caution phase under the 50-DMA.

The leadership indicator shows GLD slightly outperforming the SPY or benchmark. SPY closed down on the week from $456.92 down to $447, or about 2.2% lower. Gold closed down from $181.86 to $180.20, or about 1.1% lower. Stronger than the SPY on a percentage basis.

GLD’s momentum on the Real Motion indicator turned up some, yet remains in a bearish divergence to price. SPY’s momentum also fell and sits just below the 50-DMA (first time it broke that momentum line since March) while the price is above it — that is a bearish divergence in momentum.

The point is, that if SPY falters more from here and GLD rises, this will confirm the first indication of risk off… something to watch for the coming week.

Silver is still underperforming gold and is also in contango.

Silver futures closed under the 50-daily moving average but over the 200-DMA. $23.50-24.00 gives us a good range to start from this week. Above $24 and we would be encouraged to think silver has more upside. And in the case of the next chart…

We would think that SLV could gain leadership against gold, which the leadership indicator currently has underperforming. If so, that would be positive for both metals and a sign inflation is increasing.

SLV the ETF, like the silver futures, closed under the 50-DMA and is in a warning phase. The momentum indicator has silver waning in momentum, so the decision on the next price move for silver could be evident as quickly as this week.

For more detailed trading information about our blended models, tools and trader education courses, contact Rob Quinn, our Chief Strategy Consultant, to learn more.

If you find it difficult to execute the MarketGauge strategies or would like to explore how we can do it for you, please email Ben Scheibe at Benny@MGAMLLC.com.

“I grew my money tree and so can you!” – Mish Schneider

Get your copy of Plant Your Money Tree: A Guide to Growing Your Wealth and a special bonus here.

Follow Mish on Twitter @marketminute for stock picks and more. Follow Mish on Instagram (mishschneider) for daily morning videos. To see updated media clips, click here.

Mish in the Media

Mish and Nicole Petallides discuss market in correction, oil concerns, and some new picks on TD Ameritrade.

Mish runs the rule over the S&P 500 and key commodities in this video from CMC Markets.

Mish gives reasons why gold could return as a safe haven on Business First AM.

Mish talks about opportunities related to EVs in this video from Business First AM.

Mish and Jared go over oil and what might happen with small caps and regional banks in this appearance on Yahoo! Finance.

This has been a very heavy week with the Fed meeting, tons of earnings, and, not to mention, all of the geopolitical issues around the world. Something that Mish has been thinking a lot about is store houses for raw materials, the places that actually hold every kind of raw material from mining, commodity trading houses etc. Mish dives into the stocks she’s looking at on the Wednesday, July 26 edition of StockCharts TV’s Your Daily Five.

Mish looks at a selection of popular instruments and outlines their possible direction of travel in this video from CMC Markets.

In this episode of The Breakfast Show from Money FM 89.3 Singapore, Mish makes sense of the recent resilience and worrisome trends in the market, delving on the various factors driving consumer confidence in the face of rising rates and inflation, the impact of A.I.-driven companies, and the ongoing geopolitical risks on commodities and equities.

Mish talks PCE inflation picks in this video from Business First AM.

Coming Up:

August 7: Making Money with Charles Payne on Fox Business

August 10:The Final Bar on StockCharts TV

October 29-31: The Money Show

ETF Summary

S&P 500 (SPY): 450 pivotal, 440 support at the 50-DMA.Russell 2000 (IWM): 191 is the 23-month holy grail; 193 July 6-month range high.Dow (DIA): 35,000 support.Nasdaq (QQQ): 365-380 range.Regional Banks (KRE): Back over 48 looks okay; under 44 not so much.Semiconductors (SMH): 161 now more in the rear view; 150 in focus.Transportation (IYT): July 6-month calendar range high at 259.30, closed below it — caution.Biotechnology (IBB): Compression between 123-130.Retail (XRT): 66-67.40 short-term range.

Mish Schneider

MarketGauge.com

Director of Trading Research and Education

It’s been at least a week in the making, but the pullback that TG thought was going to happen late last week showed up middle of this week, due to the Fitch downgrade of the US from AAA to AA+. On this week’s edition of Moxie Indicator Minutes, TG explains that that news really just greased the wheels of what he’s been expecting since the market was overbought.

This video was originally broadcast on August 4, 2023. Click this link to watch on YouTube.

New episodes of Moxie Indicator Minutes premiere weekly on Fridays. Archived episodes of the show are available at this link.

On this week’s edition of StockCharts TV‘s StockCharts in Focus, Grayson announces a brand new stock market service from Larry Williams called “Focus On Stocks”. Available now for all StockCharts Members, Larry’s newsletter brings you exclusive market insights from one of the most renowned traders in modern market history. In addition to written content from Larry, subscribers will also have access to his live monthly “Family Gathering” webinar where you join Larry Williams to talk markets, see some of the things he’s working on and ask any questions that you may have. Grayson shows you exactly how to access Larry’s latest “Focus On Stocks” newsletter and shares details on how you can access the first two months for free.

This video originally premiered on August 4, 2023. Click on the above image to watch on our dedicated StockCharts in Focus page on StockCharts TV, or click this link to watch on YouTube.

You can view all previously recorded episodes of StockCharts in Focus at this link.

It was quite a week in the stock market. The early part was relatively calm, but then things got a little hairy. You can thank the Fitch Ratings downgrade of US long-term debt from AAA to AA+ for the quick pivot in investor sentiment.

The reason for the downgrade: “Expected fiscal deterioration over the next three years, an erosion of governance in light of repeated debt-limit political standoffs, and a generally growing debt burden.” The last time something similar to this happened was in 2011, when Standard & Poor’s downgraded US credit.

When the news was released—after Tuesday’s close—S&P 500 futures fell. This carried forward into the next trading day as stocks opened lower. And while equities sold off, Treasury yields and the US dollar moved higher.

A Short-Lived Hiccup?

It remains to be seen how much of an impact the Fitch downgrade had on the stock market. One thing is for sure: investors become more cautious.

Earnings. After Amazon (AMZN) reported positive earnings and upbeat guidance, the stock price rallied in after-hours trading. The company’s revenues from its cloud-computing unit, AWS, helped lift other cloud stocks. Things weren’t so great for Apple (AAPL). While it also beat Wall Street estimates, the slowdown in overall sales didn’t help the stock much. AAPL stock price fell and is trading below its 50-day simple moving average (SMA).

July jobs report. Now that earnings season is beginning to wrap up, investors were eagerly awaiting the jobs report data. Non-farm payrolls were up 187,000, less than the 200,000 economists expected. It’s also the lowest level since December 2020, which is encouraging in that job growth is slowing. But there are some sticky areas. The 3.5% unemployment rate is slightly lower than last month’s, and average hourly earnings went up by 0.4%. This suggests that the labor market is still tight.

Labor participation has flatlined, which could be because a large segment of people are retiring. And the number of new participants seems to stay the same as the number leaving the workforce.

Investors may be worried the Fed isn’t getting inflation down to 3%. Energy prices are going up, as are food and services prices. Despite these possible headwinds, the jobs report was considered optimistic.

Market pullback. In the daily chart of the S&P 500 index ($SPX) below, you can see that the index pulled back and has moved back below its 21-day EMA. The percentage of S&P 500 stocks above the 200-day moving average and Advance-Decline Percent also dipped during the index’s pullback. All indications suggest a potential pullback, which could present buying opportunities if the stock market reverses. Keep an eye on the 50-day SMA as the next support level.

CHART 1: S&P 500 INDEX ($SPX) PULLS BACK. The index dipped below its 21-day EMA and is approaching its next support level at the 50-day SMA.Chart source: StockCharts.com (click chart for live version). For educational purposes.

After the Fitch Ratings’ downgrade and the Treasury’s plans to borrow $1 trillion, it’s worth looking at other assets besides equities. The 10-year US Treasury Yield Index ($TNX) rose to the highest 2023 level as equities sold off. After the July jobs report, 10-year yields moved lower, but remain above 4%. This brings up the next point—mortgage rates. The 30-year fixed-rate mortgage is close to 7%, the highest rate in about two decades.

It’s almost as if the forecast for how long the Fed will continue to raise interest rates keeps getting pushed out further. While some data seems to be trending in the right direction slowly, others seem to be supporting the idea that inflation is still around. If the 10-year yield hovers around 3.75%, it would be healthy for stocks, but if the 10-year yield continues to remain above 4%, stocks may sputter.

Another area to watch closely is crude oil. Price rose to the April 2023 levels, and, if price breaks above $84 a barrel, it could soar higher. If this happens, it could impact inflation, since energy is a large component of household expenses.

CHART 2: CRUDE OIL PRICES RISE. Crude oil futures are trading well above their 200-day SMA. The rise in oil prices may impact inflation.Chart source: StockCharts.com (click chart for live version). For educational purposes.

End of Week Wrap Up

US equity indexes down; volatility up

$SPX down 0.53% at 4478.03, $INDU down 0.43% at 35065.62; $COMPQ down 0.36% at 13909.24$VIX up 7.41% at 17.10Best performing sector for the week: EnergyWorst performing sector for the week: UtilitiesTop 5 Large Cap SCTR stocks: Super Micro Computer (SMCI), Palantir Technologies (PLTR), Pohang Iron & Steel (PKX), Li Auto (LI), NVIDIA (NVDA)

On the Radar Next Week

30-Year Mortgage RateMortgage applicationsJuly CPIJuly PPIMichigan Consumer Sentiment

Disclaimer: This blog is for educational purposes only and should not be construed as financial advice. The ideas and strategies should never be used without first assessing your own personal and financial situation, or without consulting a financial professional.

The last few weeks, metals have been swinging wildly. I have been following Copper and Gold and it has been a wild ride to say the least. I’ll cover off Copper and related miners today. As we wait for the world of electric cars to consume every ounce of copper, the focus for copper mining and production remains high as inventories remain low.

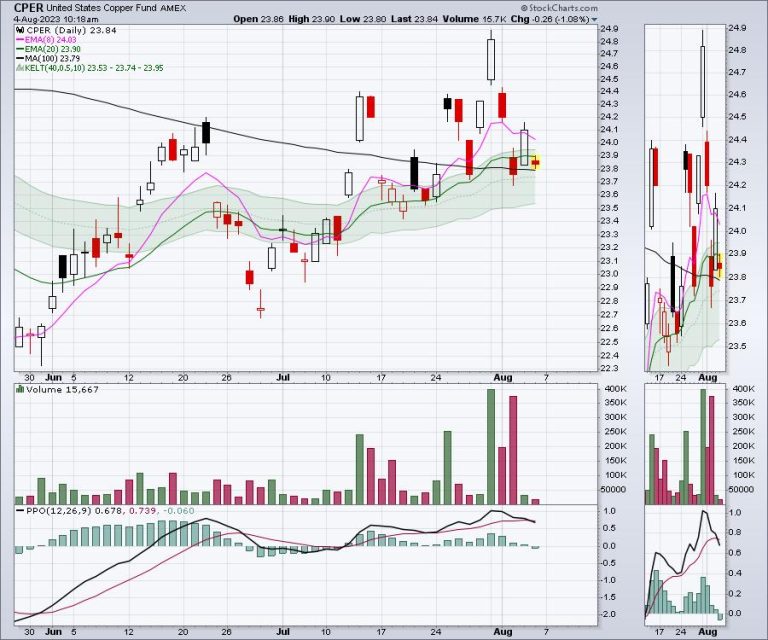
One of the metal mining ETF’s is CPER, which trades like copper. It broke out to a higher high in mid July continuing a series of higher lows and highs, only to gap back down on Monday, July 17th. After a sideways week, copper surged on July 25th and tested the prior highs. In a choppy week copper darted around but closed near the highs. On Monday, July 31, Copper surged higher with a clear break above resistance. By Wednesday, all sense of a new high was gone and copper was back below the 100 MA.

There is a trend of rising highs and rising lows. The volume has been improving, but the volume this week was well outside the June period. With the PPO rolling over onto a sell signal to end the week, its an awfully hard trade to hold.

The hard part is copper is making higher highs and higher lows, but every day is sudden move either supportive or damaging, making it hard to hold. While many investors might not own copper directly, some copper miners have been a robust trade making higher highs.

The chart below is COPX, which is the copper miners ETF. Clearly, a case can be made for higher highs and higher lows. The difficult part is the opening gaps up and down every day. The high volume bars seem to be indicative of short term tops. Now that the COPX ETF is back on a sell signal on the PPO, is it worth holding the metals throughout the third quarter?

When I look at names like FCX and Southern copper, their charts look good. The FCX chart has been pushing higher since June 1 through to July 31, but the PPO is rolling over onto a sell signal again. Which way will price go now?

Looking at SCCO, the chart is even nicer. The stock is up 56% from late November 2022 and broke out to new 52 week highs last week! However, the PPO looks like it is ready for a sell signal.

The bottom line is the copper stocks have been hard to hold and with the indexes starting to retrace, the best gains in copper names might be behind us for a few months. It is so frustrating, as the stocks are just starting to make higher highs, but then rolled over in earnest to start August.

In a Republican presidential nomination race that’s dominated by former President Donald Trump, the former president’s indictment and arraignment this week on charges he attempted to overturn his loss in the 2020 election will likely only increasingly eclipse efforts by his rivals to stand out and further cement his position as the commanding front-runner.

‘In the short term, it helps Trump because it’s going to galvanize his base, and it’s going to take all of the oxygen out of the race for every other candidate and rather than talk about themselves,’ longtime New Hampshire based Republican consultant Jim Merrill told Fox News‘It will be inescapable.’

Merrill, a veteran of numerous GOP presidential campaigns, emphasized that the blockbuster developments are ‘going to force them to talk about Donald Trump. And the longer that goes on, the harder it is for the other candidates to make a compelling case for their own campaigns.’

Trump’s wasting no time in getting back on the campaign trail.

The former president on Friday evening headlines the Alabama GOP’s summer meeting. And on Saturday he’s in South Carolina – which holds the third contest in the Republican presidential nominating calendar – as he speaks at the state party’s annual Silver Elephant fundraising gala. Both appearances were scheduled ahead of the former president’s indictment on Tuesday. Next week, Trump heads to New Hampshire, which holds the first primary and votes second in the GOP nominating schedule.

Trump, who’s making his third straight White House run, earlier this year became the first sitting or former president in U.S. history to be charged with a crime.

The former president pleaded not guilty in early April in New York City to charges brought by the Manhattan District Attorney’s Office. He was indicted for allegedly giving hush-money payments to adult film actress Stormy Daniels in 2016 to keep her quiet ahead of that year’s presidential election over her claims she had sexual encounters years earlier with Trump. He denies sleeping with Daniels and denies falsifying business records to keep the payment concealed.

Trump was indicted and arraigned in early June for his alleged improper retention of classified records. He pleaded not guilty in federal court in Miami to criminal charges that he illegally retained national security records at his Mar-a-Lago estate in Palm Beach, Florida, following the end of his term as president and that he obstructed federal efforts to recover the documents.

On Thursday the former president pleaded not guilty to four counts: conspiracy to defraud the United States, conspiracy to obstruct an official proceeding, obstruction of official proceeding, and conspiracy against rights. 

Trump was informed two weeks ago that he was a target in the probe into his actions and state of mind on Jan. 6, 2021, and in the lead-up to that infamous day – when hundreds stormed the U.S. Capitol. The attack temporarily disrupted congressional certification of Biden’s Electoral College victory over Trump.

The indictment alleges that Trump pursued unlawful means of discounting legitimate votes and subverting the 2020 presidential election results and that he corruptly obstructed and impeded the certification of the electoral vote.

Trump world is confident that the latest indictment will further energize his supporters. 

‘It is absolutely true that, politically speaking, these indictments have been rocket fuel for his campaign,’ an adviser in Trump’s political orbit told Fox News.

The adviser, who asked for anonymity to speak more freely, argued that ‘too many Washington insiders don’t appreciate the extent to which Republican voters do not believe in the system. Republican voters believe our system of government is completely corrupt and corrupted against Republican. So, when Trump gets indicted and indicted multiple times, all it does is send a signal to Republican voters that Trump is the greatest the threat to the very corrupt establishment that they hate and don’t believe.’

Another source in Trump world suggested that the latest indictment fuels a potential general election rematch with Biden.

 ‘They’ve fast-tracked the general election, which has already started. While there are plenty of Republican candidates marching around the country, the adults in the room and the nominees of the respective parties have already started their general election campaigns,’ the source predicted.

Ryan Williams, a Republican strategist, communicator and veteran of multiple presidential campaigns, told Fox News that the latest indictment ‘politically doesn’t affect Donald Trump’s support with Republican primary voters at all. If anything, it rallies support around him.’

And pointing to Trump’s rivals, Williams said that ‘there’s no oxygen left in the room. The entire race is about Donald Trump, and as we’ve seen thus far, the more people talk about Donald Trump, the stronger his poll numbers get in the Republican primary. The focus on Trump and his circus has diminished other candidates.’

But there are still five and a half months to go until Iowa and New Hampshire kick off the voting in the race for the GOP nomination. Merrill noted that while the Trump indictments ‘create challenges for the opposing campaigns, there’s time … I think one thing we’ve learned over the last eight years is that anything can happen in these things.’

And he emphasized that for Trump’s rivals, the mission ahead is ‘to make that case that these indictments make it difficult if not impossible for Trump to beat Joe Biden.’

Ryan pointed to another factor – money.

This week’s indictment came amid headlines that Trump’s political committees were spending more money so far this year than they were raising, with millions in expenditures going to his legal bills.

‘Increasing legal costs that will drain his campaign bank account,’ Williams noted. ‘Preparing for trial and going to trial will result in larger legal bills that will essentially render his campaign as a legal defense fund.’

And he suggested that ‘at a time when Joe Biden and Democrats will be stockpiling resources to run hundreds of millions of dollars of ads against Trump, he’ll be forced to take his resources to pay lawyers.’

This post appeared first on FOX NEWS