Archive

2023

Browsing

In this week’s edition of Trading Simplified, Dave shows his methodology in action with a short side setup that recently triggered. He also touches upon a simple way to stay on the right side on the market – so far, so good! After that, he resumes expounding on the wisdom of Jesse Livermore. Although Livermore accomplished some amazing things, he also exhibited a lot of bad behavior. Therefore, in this episode, Dave focuses on what not to do as a trader.

This video was originally published on August 30, 2023. Click anywhere on the Trading Simplified logo above to watch on our dedicated show page, or at this link to watch on YouTube.

You can view all recorded episodes of the show at this link. Go to davelandry.com/stockcharts to access the slides for this episode and more. Dave can be contacted at davelandry.com/contact for any comments and questions.

Whether you’re bungee jumping or investing in the stock market, fear, uncertainty, and doubt can cause anxiety. The fear that inflation is still high and interest rates could rise, for example, makes investors further hesitant to invest in equities.

But have you considered looking at the macro view of the market? If you were to pull up a chart of any broad market index, you would find no signs of massive selling pressure. Even AI stocks, which pushed the market higher, have had a relatively modest pullback.

August may have been a disappointing month for the stock market, but the S&P 500 index ($SPX) remained above its 100-day simple moving average. The JOLTS report, which indicated that the number of job openings lowered, helped ease some investor anxiety and lifted the broader market higher.

But now we are approaching September, which, historically, has been one of the worst months as far as stocks go. Will there be a further pullback, or will the market continue rallying higher?

Hear What Larry Williams Has To Say

If you’ve been watching the StockCharts.com Larry Williams’ “Family Gathering” webinars, you would have heard Larry saying that the bull market signal is still in play and the broader market is moving higher. So far, there are no indications of a bear market.

So, in a bull market, you want to get in when the market pulls back. We may have just had a pullback, or maybe not yet.

The Index Trifecta

Before deciding to enter a position (long or short), it’s a good idea to get a macro view of the market. 

The three broader market indexes—the Dow Jones Industrial Average ($INDU), S&P 500 ($SPX), and the Nasdaq Composite ($COMP)—are showing a similar pattern, rallying until July–August, then pulling back. Since mid-to-late August, the three indexes have been moving higher.

Going back to Larry Williams’ cycle analysis, it’s possible that the pullback will continue till mid-September and, from there, rally to the end of the year. Remember, September tends to be a weak month for stocks, so this scenario is possible. When and if it happens, it’s good to be prepared to enter positions.

The Williams Insider Accumulation Index  

There are many tools you can use to strategize when to enter positions. A great way is to keep tabs on what the insiders are doing. If you’re considering buying stocks, the Williams Insider Accumulation Index can be helpful. You’ll want to look for divergences between price action and the indicator. If the stock price is falling, but the indicator is rising, it’s a good idea to pay attention to the stock.

How To Add the Williams Insider Accumulation Index to Your Charts

In the StockChartsACP platform, enter a stock symbol in the symbol box.Scroll down the indicator list to the Larry Williams plug-in.Select Williams Accumulation Index.

For example, in the weekly chart of Meta Platforms (ticker symbol: META) below, when META’s stock price was falling from April to October, the Williams Accumulation Index was trending higher. This would have indicated that institutional investors were accumulating the stock.

CHART 1: DIVERGENCE BETWEEN PRICE AND INDICATOR IN META. While META’s stock price declined from April to October, the Williams Accumulation Index trended higher.Chart source: StockChartsACP. For educational purposes.

So, after the recent pullback, would it be a good time to jump into META? On the weekly chart, it’s hard to say, since it looks like the accumulation is lessening. To make an entry or exit decision, it may be worth switching to the daily chart (see chart below).

CHART 2: DAILY PRICE CHART OF META STOCK. The divergence between the price and Williams Accumulation Index would have indicated that the uptrend may weaken. After META broke below its upward-sloping trendline, the Williams Accumulation Index started moving higher. A potential trading opportunity?Chart source: StockChartsACP. For educational purposes.

The daily chart tells a different story. Between June and August, while the stock price was rising, the Williams Accumulation Index was trending lower. But since the stock price broke below its upward-sloping trendline, accumulation picked up slightly. The stock is now trading sideways. If the price breaks out above its 20- and 50-day moving averages and shows signs of trending higher, accompanied by an uptrend in the Williams Accumulation Index, it could present a viable long trading opportunity. It’s something to watch for and, if you haven’t done so yet, a stock to add to your ChartLists.

Let’s look at another example. The weekly chart of AT&T (ticker symbol: T) shows that, in the last few months, the stock was in a relatively steep down move. However, after reaching a low in mid-July, the Williams Accumulation Index started rising. The last bar on the chart has a pretty wide range, but the volume is low.

CHART 3: COULD THIS BE A TURNING POINT? After a steep fall, AT&T stock may be showing signs of recovery. Keep an eye on the Williams Accumulation Index to see if accumulation continues.Chart source: StockChartsACP. For educational purposes.

Switching to the daily chart, you can see that the Williams Accumulation Index has been rising in August, while the stock price was trading sideways.

CHART 4: DAILY CHART OF AT&T. The stock may trend higher, but there could be room for further pullback. Watch to see if the 50-day moving average acts as a support level.Chart source: StockChartsACP. For educational purposes.

The Bottom Line

Regardless of which stocks you identify as potential long candidates, it’s always worth going back to the macro view of the market. Know how the overall market is doing and determine if the bull market is still in play. The last thing you want to do is buy long positions when there’s a chance the entire market might move lower. September is coming up, so please be sure to tread with caution.

Disclaimer: This blog is for educational purposes only and should not be construed as financial advice. The ideas and strategies should never be used without first assessing your own personal and financial situation, or without consulting a financial professional.

SPX Monitoring Purposes: Neutral.

Gain since 12/20/22: 15.50%

Monitoring Purposes GOLD:  Long GDX on 10/9/20 at 40.78.

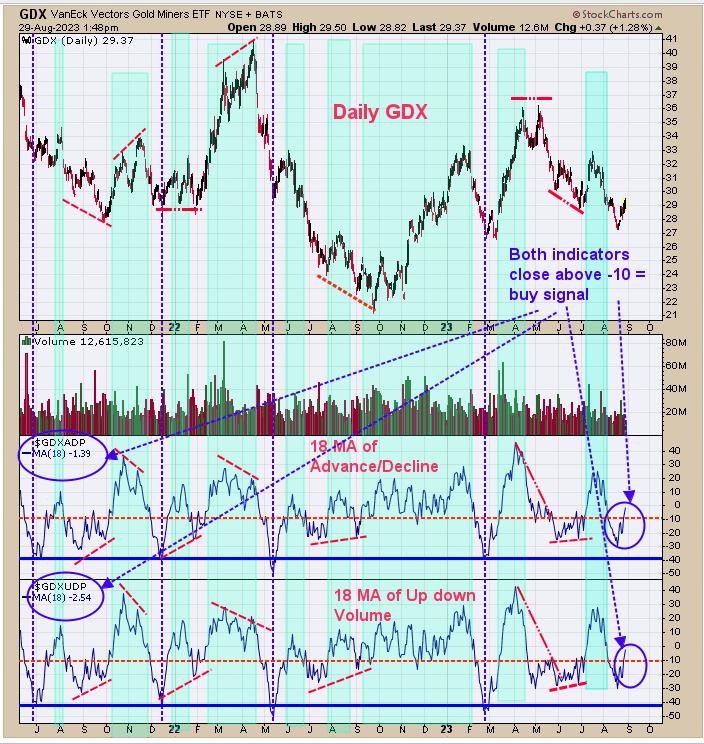
Yesterday, we said, “the light blue-shaded areas are when the 18-day averages for up down volume percent and advance/decline percent for GDX are above -10. When both indicators are above -10, GDX is in an uptrend. Currently, the 18-day average for the up down volume stands at -11.33 (almost there) and the 18-day average Advance/Decline percent stands at -9.33 (bullish). For buy signals, both indicators need to be above -10 and stay above -10 for the buy signal to continue. Unless something weird happens, it looks as though a rally phase in GDX is about to begin.” Today, the up down volume indicator trades at -2.54 (bottom window) and the advance/decline indictor trades -1.39; both above -10 and bullish. As long as both indicators hold above -10, the uptrend in GDX should continue.

Join me on TFNN.com Tuesday 3:30 Eastern Time and Thursday 3:20 Eastern Time.

Tim Ord,

Editor

www.ord-oracle.com. Book release “The Secret Science of Price and Volume” by Timothy Ord, buy at www.Amazon.com.

Signals are provided as general information only and are not investment recommendations. You are responsible for your own investment decisions. Past performance does not guarantee future performance. Opinions are based on historical research and data believed reliable; there is no guarantee results will be profitable. Not responsible for errors or omissions. I may invest in the vehicles mentioned above.

Tesla has received a special order from federal automotive safety regulators requiring the company to provide extensive data about its driver assistance and driver monitoring systems, and a once secret configuration for these known as “Elon mode.”

Typically, when a Tesla driver uses the company’s driver assistance systems — which are marketed as Autopilot, Full Self-Driving or FSD Beta options — a visual symbol blinks on the car’s touchscreen to prompt the driver to engage the steering wheel.

If the driver leaves the steering wheel unattended for too long, the “nag” escalates to a beeping noise. If the driver still does not take the wheel at that point, the vehicle can disable the use of its advanced driver assistance features for the rest of the drive or longer.

As CNBC previously reported, with the “Elon mode” configuration enabled, Tesla can allow a driver to use the company’s Autopilot, FSD or FSD Beta systems without the so-called “nag.”

The National Highway Traffic Safety Administration sent a letter and special order to Tesla on July 26, seeking details about the use of what apparently includes this special configuration, including how many cars and drivers Tesla has authorized to use it. The file was added to the agency’s website on Tuesday and Bloomberg first reported on it.

In the letter and special order, the agency’s acting chief counsel John Donaldson wrote:

“NHTSA is concerned about the safety impacts of recent changes to Tesla’s driver monitoring system. This concern is based on available information suggesting that it may be possible for vehicle owners to change Autopilot’s driver monitoring configurations to allow the driver to operate the vehicle in Autopilot for extended periods without Autopilot prompting the driver to apply torque to the steering wheel.”

More from CNBC

Under Armour founder used TV anchor’s advice when facing negative coverage, court records show Lego sales increase while other toy makers struggle The Bank of England is facing major losses on its bond purchases — and it’s set to get much worse

Tesla was given a deadline of Aug. 25 to provide all the information demanded by the agency, and replied on time but they requested and their response has been granted confidential treatment by NHTSA. The company did not immediately respond to CNBC’s request for comment.

Automotive safety researcher and Carnegie Mellon University associate professor of computer engineering Philip Koopman told CNBC after the order was made public, “It seems that NHTSA takes a dim view of cheat codes that permit disabling safety features such as driver monitoring. I agree. Hidden features that degrade safety have no place in production software.”

Koopman also noted that NHTSA has yet to complete a series of investigations into crashes where Tesla Autopilot systems were a possible contributing factor including, a string of “fatal truck under-run crashes” and collisions involving Tesla vehicles that hit stationary first responder vehicles. NHTSA acting administrator Ann Carlson has suggested in recent press interviews that a conclusion is near.

For years, Tesla has told regulators including NHTSA and the California DMV that its driver assistance systems including FSD Beta are only “level 2” and do not make their cars autonomous, despite marketing them under brand names that could confuse the issue. Tesla CEO Elon Musk who also owns and runs the social network X, formerly Twitter, often implies Tesla vehicles are self-driving.

Over the weekend, Musk livestreamed a test drive in a Tesla equipped with a still-in-development version of the company’s FSD software (v. 12) on the social platform. During that demo, Musk streamed using a mobile device he held while driving and chatting with his passenger, Tesla’s head of Autopilot software engineering Ashok Elluswamy.

In the blurry video stream, Musk did not show all the details of his touchscreen or demonstrate that he had his hands on the steering yoke ready to take over the driving task any moment. At times, he clearly had no hands on the yoke.

His use of Tesla’s systems would likely comprise a violation of the company’s own terms of use for Autopilot, FSD and FSD Beta, according to Greg Lindsay, an Urban Tech fellow at Cornell. He told CNBC, the entire drive was like “waving a red flag in front of NHTSA.”

Tesla’s website cautions drivers, in a section titled “Using Autopilot, Enhanced Autopilot and Full Self-Driving Capability” that “it is your responsibility to stay alert, keep your hands on the steering wheel at all times and maintain control of your car.”

Grep VC managing partner Bruno Bowden, a machine learning expert and investor in autonomous vehicle startup Wayve, said the demo showed Tesla is making some improvements to its technology, but still has a long way to go before it can offer a safe, self-driving system.

During the drive, he observed, the Tesla system nearly blew through a red light, requiring an intervention by Musk who managed to brake in time to avoid any danger.

This post appeared first on NBC NEWS

Tesla is set to defend itself for the first time at trial against allegations that failure of its Autopilot driver assistant feature led to death, in what will likely be a major test of Chief Executive Elon Musk’s assertions about the technology.

Self-driving capability is central to Tesla’s financial future, according to Musk, whose own reputation as an engineering leader is being challenged with allegations by plaintiffs in one of two lawsuits that he personally leads the group behind technology that failed. Wins by Tesla could raise confidence and sales for the software, which costs up to $15,000 per vehicle.

Tesla faces two trials in quick succession, with more to follow.

The first, scheduled for mid-September in a California state court, is a civil lawsuit containing allegations that the Autopilot system caused owner Micah Lee’s Model 3 to suddenly veer off a highway east of Los Angeles at 65 miles per hour, strike a palm tree and burst into flames, all in the span of seconds.

The 2019 crash, which has not been previously reported, killed Lee and seriously injured his two passengers, including a then-8-year-old boy who was disemboweled. The lawsuit, filed against Tesla by the passengers and Lee’s estate, accuses Tesla of knowing that Autopilot and other safety systems were defective when it sold the car.

Musk ‘de factor leader’ of Autopilot team

The second trial, set for early October in a Florida state court, arose out of a 2019 crash north of Miami where owner Stephen Banner’s Model 3 drove under the trailer of an 18-wheeler big rig truck that had pulled into the road, shearing off the Tesla’s roof and killing Banner. Autopilot failed to brake, steer or do anything to avoid the collision, according to the lawsuit filed by Banner’s wife.

Tesla denied liability for both accidents, blamed driver error and said Autopilot is safe when monitored by humans. Tesla said in court documents that drivers must pay attention to the road and keep their hands on the steering wheel.

“There are no self-driving cars on the road today,” the company said.

The civil proceedings will likely reveal new evidence about what Musk and other company officials knew about Autopilot’s capabilities — and any possible deficiencies. Banner’s attorneys, for instance, argue in a pretrial court filing that internal emails show Musk is the Autopilot team’s “de facto leader.”

Tesla and Musk did not respond to Reuters’ emailed questions for this article, but Musk has made no secret of his involvement in self-driving software engineering, often tweeting about his test-driving of a Tesla equipped with “Full Self-Driving” software. He has for years promised that Tesla would achieve self-driving capability only to miss his own targets.

Tesla won a bellwether trial in Los Angeles in April with a strategy of saying that it tells drivers that its technology requires human monitoring, despite the “Autopilot” and “Full Self-Driving” names. The case was about an accident where a Model S swerved into the curb and injured its driver, and jurors told Reuters after the verdict that they believed Tesla warned drivers about its system and driver distraction was to blame.

Stakes higher for Tesla

The stakes for Tesla are much higher in the September and October trials, the first of a series related to Autopilot this year and next, because people died.

“If Tesla backs up a lot of wins in these cases, I think they’re going to get more favorable settlements in other cases,” said Matthew Wansley, a former General Counsel of nuTonomy, an automated driving startup and Associate Professor of Law at Cardozo School of Law.

On the other hand, “a big loss for Tesla — especially with a big damages award” could “dramatically shape the narrative going forward,” said Bryant Walker Smith, a law professor at the University of South Carolina.

In court filings, the company has argued that Lee consumed alcohol before getting behind the wheel and that it is not clear whether Autopilot was on at the time of crash.

Jonathan Michaels, an attorney for the plaintiffs, declined to comment on Tesla’s specific arguments, but said “we’re fully aware of Tesla’s false claims including their shameful attempts to blame the victims for their known defective autopilot system.”

In the Florida case, Banner’s attorneys also filed a motion arguing punitive damages were warranted. The attorneys have deposed several Tesla executives and received internal documents from the company that they said show Musk and engineers were aware of, and did not fix, shortcomings.

In one deposition, former executive Christopher Moore testified there are limitations to Autopilot, saying it “is not designed to detect every possible hazard or every possible obstacle or vehicle that could be on the road,” according to a transcript reviewed by Reuters.

In 2016, a few months after a fatal accident where a Tesla crashed into a semi-trailer truck, Musk told reporters that the automaker was updating Autopilot with improved radar sensors that likely would have prevented the fatality.

But Adam (Nicklas) Gustafsson, a Tesla Autopilot systems engineer who investigated both accidents in Florida, said that in the almost three years between that 2016 crash and Banner’s accident, no changes were made to Autopilot’s systems to account for cross-traffic, according to court documents submitted by plaintiff lawyers.

The lawyers tried to blame the lack of change on Musk. “Elon Musk has acknowledged problems with the Tesla autopilot system not working properly,” according to plaintiffs’ documents. Former Autopilot engineer Richard Baverstock, who was also deposed, stated that “almost everything” he did at Tesla was done at the request of “Elon,” according to the documents.

Tesla filed an emergency motion in court late on Wednesday seeking to keep deposition transcripts of its employees and other documents secret. Banner’s attorney, Lake “Trey” Lytal III, said he would oppose the motion.

“The great thing about our judicial system is Billion Dollar Corporations can only keep secrets for so long,” he wrote in a text message.

This post appeared first on NBC NEWS

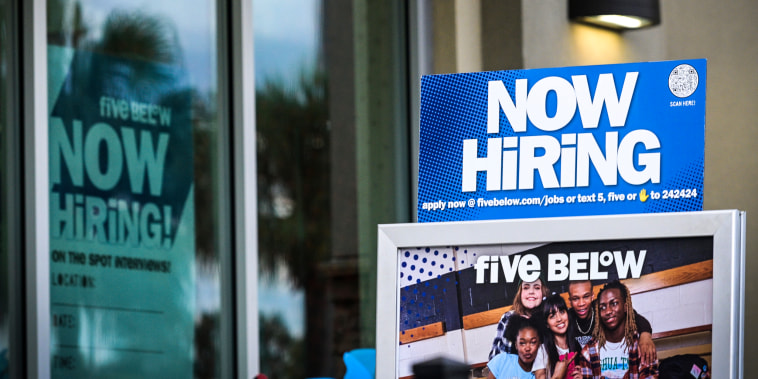
U.S. job openings dropped to the lowest level in nearly 2-1/2 years in July as the labor market gradually slowed, bolstering expectations that the Federal Reserve will keep interest rates unchanged next month.

The Job Openings and Labor Turnover Survey, or JOLTS report, from the Labor Department on Tuesday also showed the number of people quitting their jobs dropped to levels last seen in early 2021, indicating that Americans were becoming less confident in the labor market.

That was reinforced by a survey from the Conference Board showing consumers’ perceptions of the labor market cooled in August.

Nevertheless, labor market conditions remain tight, with 1.51 job openings for every unemployed person in July, compared to 1.54 in June. While that was the lowest ratio since September 2021, it is well above the 1.0-1.2 range considered consistent with a jobs market that is not generating too much inflation. Layoffs are very low by historical standards.

“Although the labor market is still tight, the degree of excess demand is declining and is coming about through companies reducing the number of vacancies rather than increasing layoffs and unemployment,” said Conrad DeQuadros, senior economic advisor at Brean Capital in New York. “There is plenty here to make the case that not only is the labor market rebalancing but at this point it is doing so without pushing up unemployment.”

Job openings, a measure of labor demand, were down 338,000 to 8.827 million on the last day of July, the lowest level since March 2021. Economists polled by Reuters had forecast 9.465 million job openings.

The decrease was led by the professional and business services sector, where job openings dropped 198,000. There were 130,000 fewer vacancies in healthcare and social assistance, while open positions fell 67,000 in state and local government, excluding education.

State and local government education job openings declined by 62,000 and there were 27,000 fewer federal government vacancies. But unfilled jobs rose by 101,000 in the information sector. There were an additional 75,000 open positions in the transportation, warehousing and utilities sector.

The job openings rate fell to 5.3%, the lowest level since February 2021, from 5.5% in June. The decline in vacancies was more pronounced in the South, which has experienced an employment boom. The Midwest reported a modest drop, while job openings increased in the Northeast and West.

Declining job openings are likely to be mirrored by slower job growth in August. Economists expect the increase in nonfarm payrolls moderated further in August after posting in July the second-smallest gain since December 2020.

Fed Chair Jerome Powell said at the annual Jackson Hole economic conference in Wyoming on Friday that the U.S. central bank “will proceed carefully as we decide whether to tighten further or, instead, to hold the policy rate constant and await further data.” Financial markets expect the U.S. central bank will leave its benchmark overnight interest rate unchanged at its policy meeting next month, according to the CME Group’s FedWatch Tool.

“With reports like this, the Fed can most likely keep rates unchanged in September,” said Jeffrey Roach, chief economist at LPL Financial in Charlotte, North Carolina.

Stocks on Wall Street were trading higher. The dollar fell against a basket of currencies. U.S. Treasury prices rose.

Workers less confident

The labor market has largely been resilient despite 525 basis points in interest rate hikes from the Fed since March 2022, in part as employers filled positions that opened up during the COVID-19 pandemic.

Companies have also been reluctant to lay off workers after experiencing difficulties finding labor during the pandemic. At 3.5% in July, the unemployment rate was near levels last seen more than 50 years ago.

But the jobless rate could rise in August. The Conference Board’s so-called labor market differential, derived from data on respondents’ views on whether jobs are plentiful or hard to get, narrowed to 26.2% this month. That was the lowest level since April 2021 and was down from 32.4% in July.

This measure correlates to the unemployment rate in the Labor Department’s closely followed employment report.

Waning labor market optimism combined with a surge in gasoline prices to weigh on consumer confidence this month, erasing the back-to-back increases in June and July.

Though there is no strong link between confidence and consumer spending, economists viewed the ebb in morale as sign of a slowing economy.

Many economists believe the Fed’s rate hiking cycle is over, increasing the odds of tepid growth rather than a recession as had been feared since last year.

“The labor market is slowly cooling and this helps make the case for an economic soft landing where inflation can be brought under control without triggering the massive job losses seen in recessions,” said Christopher Rupkey, chief economist at FWDBONDS in New York.

The JOLTS report showed hiring dropped 167,000 to 5.773 million, the lowest level since January 2021. The hires rate fell to 3.7%, the lowest since April 2020, from 3.8% in June.

Resignations decreased 253,000 to 3.549 million, the lowest level since February 2021. The decline was concentrated in the accommodation and food services industry. There were also decreases in wholesale trade, transportation, warehousing and utilities as well as education and health services, and finance.

Fewer people job-hopping could help restrain wage inflation. The quits rate, viewed as a measure of labor market confidence, fell to 2.3%. That was the lowest reading since January 2021 and was down from 2.4% in June.

Layoffs and discharges were little changed at 1.555 million.

“The quits rates … suggests workers are becoming less confident in their ability to find a new, perhaps higher paying job,” said Scott Anderson, chief economist at the Bank of the West in San Francisco.

This post appeared first on NBC NEWS

In this week’s edition of StockCharts TV‘s Halftime, Pete reexamines the chart he posted before the Jackson Hole meeting; Chairman Powell validated his thinking that the Fed Policy will remain tight until the unemployment rate increases. He then gives a quick review of the SPX and the channel trend to the upside, plus a review of oil, the TLT and the US Dollar. Finally, he presents a sneak peek at a list of names that are changing trend to the upside.

This video originally premiered on August 29, 2023. Click on the above image to watch on our dedicated Halftime by Chaikin Analytics page on StockCharts TV, or click this link to watch on YouTube.

You can view all previously recorded episodes of Halftime by Chaikin Analytics with Pete Carmasino at this link.

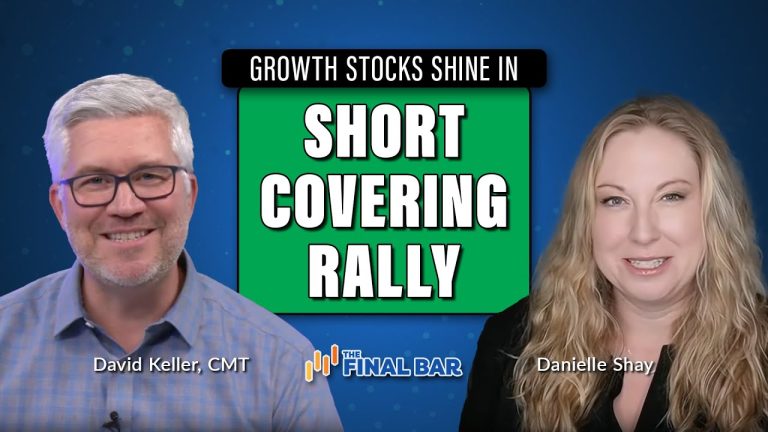
In this special edition of StockCharts TV‘s The Final Bar, Danielle Shay of Simpler Trading breaks down the current short-covering rally and walks through her current setups for QQQ, NVDA, MSFT, and TSLA. Host Dave tracks the recent drop in interest rates and shows how Bitcoin has bounced off clear technical support levels.

This video originally premiered on August 29, 2023. Watch on our dedicated Final Bar page on StockCharts TV, or click this link to watch on YouTube.

New episodes of The Final Bar premiere every weekday afternoon LIVE at 4pm ET. You can view all previously recorded episodes at this link.

Conference Board Economic Forecast: 

Looking into 2024, we expect the volatility that dominated the US economy over the pandemic period to diminish. In the second half of 2024, we forecast that overall growth will return to more stable pre-pandemic rates, inflation will drift closer to 2 percent, and the Fed will lower rates to near 4 percent. However, due to an aging labor force we expect tightness in the labor market to remain an ongoing challenge for the foreseeable future.

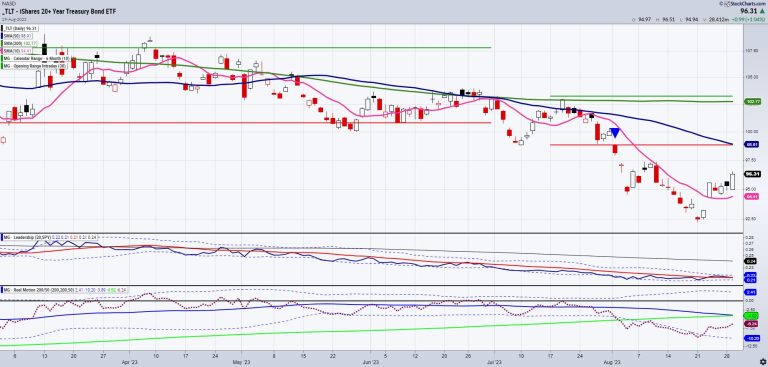
Yesterday, we had this to say about Bonds:

“The good news is the market has absorbed the bond’s performance. A better risk-on environment is when the SPY outperforms the long bonds.

“Talking technically, we are watching the October 2022 lows carefully. A potential double bottom exists if TLTs can clear back able 98. A move under 95, though, points more to a retest and possible break of the low 91.85.”

The whole market rallied, from bonds to small caps to metals and oil. Clearly, the economic statistics coming at us with blinding speed, more of a can-can than a waltz, has begun. Can everything move up together, or will the rally today resolve lower for some instruments while higher for others?

The relief rally in bonds, coupled with the dollar reversing closer weaker, helped everything run higher. If you watch the clip from The Final Bar that Mish guest-hosted alongside Keith, we showed you how this rally could happen, especially with volatility look like anything but volatility.

In the spirit of the forecasts, the expectation for 2024 remains for lower inflation, no recession, steady growth and a Fed that will begin to ease up on rates.

Sounds amazing right?

Enter the Dragon.

Silver is in a bullish phase. It is also outperforming the gold market, using the ETFs SLV and GLD. Furthermore, on the leadership indicator, silver is nowhere near overbought relative to gold. The gold-silver ratio has fallen below the 80 level, suggesting that silver will outperform gold prices going forward. Two reasons why are stimulus measures in China and robust industrial demand, as the U.S. looks to spend $45 million to develop domestic manufacturing with the solar power sector. Historically, silver often outperformed gold during periods of strong economic expansion and tended to underperform gold during periods of economic stress.  

With inflation persistent, we will continue to watch bonds and the gold to silver ratio. Plus, we are still focused on small-caps and IWM clearing 190. In the meantime, you all have a wonderful rest of the week and long weekend.

Mish is taking a few days off and will return September 5th.

Happy Labor Day weekend!

For more detailed trading information about our blended models, tools and trader education courses, contact Rob Quinn, our Chief Strategy Consultant, to learn more.

If you find it difficult to execute the MarketGauge strategies or would like to explore how we can do it for you, please email Ben Scheibe at Benny@MGAMLLC.com.

“I grew my money tree and so can you!” – Mish Schneider

Get your copy of Plant Your Money Tree: A Guide to Growing Your Wealth and a special bonus here.

Follow Mish on Twitter @marketminute for stock picks and more. Follow Mish on Instagram (mishschneider) for daily morning videos. To see updated media clips, click here.

Mish in the Media

Mish served as guest host for the Monday, August 28 edition of StockCharts TV’s The Final Bar! Mish puts her own spin on the Market Recap, starting with the indices and then exploring sectors using her “Economic Modern Family” analysis. She then sits down with Keith Schneider for an insightful interview. Keith discusses topics such as agricultural commodities, biotechnology, and volatility.

Mish and Charles discuss a secular bear market in bonds and why gold could outshine expectations in this appearance on Fox Business’ Making Money with Charles Payne.

Mish and Paul Gruenwald discuss soft landings, recession, inflation, GDP and China on Yahoo Finance.

Mish looks at a selection of popular instruments and outlines their possible direction of travel in this appearance on CMC Markets.

Mish talks NVDA and “Trading the Weather” in these two appearances on Business First AM.

Coming Up:

Mish will be on break starting August 30 and return Tuesday, September 5th.

September 7: Singapore Breakfast Radio, 89.3 FM

September 12: BNN Bloomberg & Charting Forward, StockCharts TV

September 13: Investing with IBD podcast

October 29-31: The Money Show

ETF Summary

S&P 500 (SPY): 440 support, 458 resistance.Russell 2000 (IWM): 185 pivotal, 190 has to clear.Dow (DIA): 347 now pivotal support.Nasdaq (QQQ): 363 support and over 375 looks good.Regional banks (KRE): Needs to hold 44 to be convincing.Semiconductors (SMH): 150-161 range to watch.Transportation (IYT): 252 biggest overhead resistance.Biotechnology (IBB): Compression between 124-130.Retail (XRT): 62.90 key support to hold.

Mish Schneider

MarketGauge.com

Director of Trading Research and Education

What if you had access to a forecasting tool capable of predicting the most likely path prices may take roughly in the next three months? The caveat here is that it can’t accurately pinpoint the peaks and troughs, but it can approximate them with relative accuracy.

This is essentially what market cycle methods or indicators attempt to do. Markets move in cycles; they have highs and lows. We also know that these cycles are consistent, though not always symmetrical. That last part is what makes their predictability aspect frustrating and unreliable.

As part of his suite of indicators designed to help you time market entries, Larry Williams developed the Williams Cycle Forecast, partly out of the same frustration many traders experience when adopting cyclical analysis to time the markets. Williams’ indicator was designed differently.

Introducing the Williams Cycle Forecast

The Williams Cycle Forecast is a technical analysis indicator designed to anticipate and predict an asset’s peak-and-trough cycles. On the daily chart, the forecast goes as far as three months into the future.

As its name suggests, the indicator homes in on the repetitive cyclical patterns that a stock (or any other financial asset) exhibits over time. The point of the indicator is to harness these cyclical patterns and predict probable price peaks (tops) and troughs (bottoms).

How does the Williams Cycle Forecast achieve this? Larry Williams took what he saw as the three most consistent short-term cycles and amalgamated them into a single cycle. This approach, he believes, ensures a balanced interplay between the three, offering a more reliable price projection over the subsequent three months.

How Do You Interpret the Williams Cycle Forecast?

First, look at the peaks and troughs. Note how the price aligns (sometimes roughly, other times more accurately). Note that the peaks, troughs, and movements to and fro were forecasted up to three months in advance.

After you identify these alignments, be sure to look ahead on the chart. Are there any particular patterns, trend continuations, or reversals that can help you anticipate buy or sell points in the weeks ahead? Let’s look at a few examples.

CHART 1: MICROSOFT (MSFT) DAILY CHART SHOWING CORRELATION BETWEEN PRICE AND FORECAST. Chart source: StockChartsACP. For educational purposes.

Note the Vantage Points

First, look at the top green arrows marking the “vantage points” of each observation period in May and August. At each point, all you could see were the price predictions generated by the Williams Cycle Forecast.

Look at the Forecasts

Remember that market cycles are more “art” than “science.” They’re not always accurate. But, in this case, they approximate the price movements quite closely.

A— Back in May, the Williams Cycle Forecast called the bottom accurately. Remember, at this time, the forecast would have preceded the actual prices (which hadn’t yet unfolded).

B— This marked a buy point based on a trend breakout in the Williams Cycle Forecast. It was a little late (as you could have entered earlier upon a price breakout), but still, not a bad approximation.

C— By the beginning of June, you would have seen a peak in a trend projected toward the end of August, after which a decline toward a periodic trough was soon to be projected.

D— The trough occurred, as predicted, right at the beginning of October. By then, another peak was projected by the end of the month.

E— The forecast approximated the peak in prices a little early, but still, that’s what to expect when using market cycles to forecast prices. Again, it’s about approximating market turns, not pinpointing them.

Still, cycles can be way off in trend direction, but relatively accurate in approximating the peaks and troughs that mark potential turns in the market.

Let’s now look at an intraday chart, as the Williams Cycle Forecast also works well with intraday charts. The chart below is a 15-minute chart of Amazon (AMZN).

CHART 2: AMZN 15-MINUTE CHART. The chart displays the Williams Cycle Forecast 66 candles ahead of prevailing prices.Chart source: StockChartsACP. For educational purposes.

Note the two vantage points marked by the green arrows. The line following each arrow shows the 66-candle projection you would have seen during each vantage point. The last vantage point is current to the time of writing, and we can see the forecast ahead of prices.

Look at the Forecasts

A— The forecast called the bottom quite accurately.

B— This shows a buy point based on a breakout of the Williams Cycle Forecast trend. An earlier breakout in price (see the price chart above the indicator) would have been more effective; yet again, the cycle forecasts were not designed to pinpoint these triggers (there are other methods and tools to help you pinpoint market entries and exits).

C— From the first vantage point on the left, you would have seen a projection of an uptrend culminating in a peak. Would this have been helpful beforehand? Arguably, yes, it would have been, especially as prices began to decline a few candles after the initial starting point.

D, E, and F— Will we see a continued uptrend and a decline in the next 66 candles? 

The Williams Cycle Forecast is a versatile tool if you apply it correctly. As you can see, it’s suitable for daily and intraday charts, making it adaptable for different types of trading. By default, it operates on a time frame of 66 trading days, roughly three months. Note, however, that this default setting isn’t rigid. You can modify this “displacement value” to find a cycle duration that best matches the particular stock you’re examining.

The Bottom Line

The Williams Cycle Forecast is a unique tool you can use to anticipate potential peaks and troughs in the market. It’s designed to provide a predictive framework that extends up to three months (or 66 candles). And it works for short-term to intermediate-term timeframes, making it versatile for various trading styles. While the tool doesn’t guarantee precise market turn timings, it often does a decent job of approximating these shifts.

Some traders feel that’s enough of an edge to aid their strategies. You’ll have to decide for yourself whether that rings true for you as well. Remember that all market cycles lean more toward art than exact science. This means that it helps to use it in conjunction with other tools and methods. But if gaining access to an effective forecast indicator can help enhance your trading, as it does for Larry Williams, then it might be worth the cost to gain that extra edge. Happy trading!

Disclaimer: This blog is for educational purposes only and should not be construed as financial advice. The ideas and strategies should never be used without first assessing your own personal and financial situation, or without consulting a financial professional.