Archive

2023

Browsing

A second delivery driver has died in Texas amid record-high temperatures, just as the regulation of workplace heat safety enters a new legal limbo across the state.

A law eliminating several cities’ mandated water breaks for construction workers during heat waves took effect Friday, after the state appealed a judge’s Wednesday ruling finding the Republican-led measure unconstitutional. In the meantime, cities like Houston said they planned to continue enforcing their mandates while the case moves forward.

The wrangling comes days after Christopher Begley, a 57-year-old UPS driver of nearly 30 years, died at a hospital Sunday after collapsing during his route outside Dallas the preceding Wednesday, according to the company and union representatives. The U.S. Occupational Safety and Health Administration is investigating. An autopsy report hasn’t been released, but co-workers and local union leaders say they believe his death was heat-related.

It has been a deadly summer for workers across the country, including in Texas, which has seen some of the worst of this year’s climate-change-fueled heat waves. OSHA told NBC News it has opened investigations into more than 20 heat-related workplace fatalities in Texas this year alone.

Begley died less than a week after UPS workers approved a new five-year contract with historic heat safety provisions covering 340,000 employees. The protections — some of the best in the industry — include air conditioning and exhaust heat shields in new vehicles and more fans in package cars, but they will take time to phase in. Begley fell sick on the job on Aug. 23, the day after the vote approving the contract was announced.

It’s been a real struggle for us in the southern region because of the heat. You never know how your body is going to react until it starts to go down.

Garfield Hooper, UPS union steward, Mckinney, texas

“We are saddened by the loss of our driver Christopher Begley and extend our deepest condolences to his family and friends,” UPS said in a statement. “We are cooperating with the authorities as they continue to investigate the cause of death. We train our people to recognize the symptoms of heat stress, and we respond immediately to any request for help.”

UPS said that a supervisor came to assist Begley after he collapsed and that he was provided with water and a cool place to rest but declined medical attention. After approving him to take the rest of the week off, the company was notified four days later that Begley had been hospitalized and later died on Aug. 27, a spokesperson said.

Garfield Hooper, a longtime co-worker and Begley’s union shop steward at their UPS building said, “It’s been a real struggle for us in the southern region because of the heat. You never know how your body is going to react until it starts to go down.”

Two months earlier, 66-year-old U.S. Postal Service mail carrier Eugene Gates collapsed on his Dallas route, during a June day when the National Weather Service issued an excessive heat warning, and later died. USPS acknowledged Gates’ death at the time, saying it was “deeply saddened,” but didn’t comment on the circumstances. OSHA is investigating the fatality as potentially heat-related.

The agency lists over 70 industries, including delivery, construction, agriculture and many types of manufacturing, as high-risk for heat illness. Recent research has found that hotter temperatures significantly raise the likelihood of injury on the job — not just in outdoor settings but at indoor workplaces, too, like the nation’s fast-growing warehouses — including injuries that aren’t obviously heat-related.

Determining that heat caused a death can be difficult for medical officials who sign death certificates, said Kristie Ebi, a professor in the University of Washington’s Center for Health and the Global Environment who studies health and heat waves.

“Official counts of people who die from heat and heat causes during a period of high temperatures are a significant undercount,” she said, adding that heat can exacerbate many factors in workplace fatalities. Researchers have found excess deaths during heat waves to be “an order of magnitude larger than what the official number is,” she said.

Heat safety concerns have drawn increasing attention from Washington officials, primarily Democrats, as temperatures rise. But federal efforts to ramp up protections are racing against both the political calendar and the climate.

Rep. Greg Casar, D-Texas, held a news conference Thursday with acting Labor Secretary Julie Su to draw attention to workplace heat risks. “It is not rational and it is not right to take workers’ water breaks and other protections away from them in the middle of a historic heat wave,” he said, citing the policy dispute in his home state.

It is not rational and it is not right to take workers’ water breaks and other protections away.

Rep. greg Casar, D-Texas

Casar, one of the lawmakers pushing to heighten heat safety measures on the Hill, was previously a labor organizer who campaigned for several of the water break ordinances that the Texas law targets. “We should be providing workers with more protections, not fewer protections,” he said.

Current federal workplace heat safety requirements are minimal, though OSHA recently made the issue a top priority through several initiatives, including ramping up heat-related inspections. The agency is also working on a heat risk prevention rule that would beef up enforcement, but that will take years to go into effect. In the meantime, state and local governments can pass their own measures, experts said, often far more quickly, as Oregon and Washington state did after the 2021 heat dome.

Heat waves are becoming longer, hotter and more frequent, Ebi said, but government and corporate decisions will affect how steeply heat-related deaths rise. “The understanding of what heat does to our bodies is well known,” she said. “There are so many actions that can be taken to protect people during those periods.”

A small number of city and county governments have created chief heat officer positions to improve those protections, including in Miami, Phoenix and Los Angeles. Ebi said she isn’t aware of any such roles in Texas.

“Essentially all heat deaths are preventable,” she said.

This post appeared first on NBC NEWS

After rising steadily since January, home prices may now be turning lower again.

The latest read on home prices shows they hit another all-time high in July, rising 2.3% from the same month last year, according to Black Knight.

That’s a bigger annual gain than the roughly 1% recorded in June, and August’s annual comparison will likely be even larger because prices began falling hard last August.

A for sale sign in front of a home in Arlington, Va., on Aug. 22, 2023. Andrew Cabellero-Reynolds / AFP – Getty Images

But prices weakened month to month, according to Black Knight. While still gaining, which they usually do at this time of year, the gains fell below their 25-year average. This after significantly outdoing their historical averages from February through June. It’s a signal that a slowdown in prices may be underway again.

“In addition to monthly gains slowing below long-term averages, Black Knight rate lock and sales transaction data also points to lower average purchase prices and seasonally adjusted price per square foot among recent sales,” said Andy Walden, vice president of enterprise research at Black Knight. “All of these factors combined underscore the need to focus on seasonally adjusted month-over-month movements rather than simply relying on the traditional annual home price growth rate.”

Behind the cooling off: mortgage rates. They rose sharply last summer and fall, causing prices to drop. They then came down for much of the winter and a bit of the spring, causing home prices to turn higher again. Now rates are back over 7% again, hitting 20-year-plus highs in August.

Add to that, new listings rose from July to August, atypical for that period of the year. Some sellers may be trying to cash in on these historically high prices. Active inventory, however, is about 48% below the levels seen from 2017 to 2019.

“While the uptick in new listings is good news for home shoppers, inventory remains persistently low, even with record-high mortgage rates putting a damper on demand,” said Danielle Hale, chief economist for Realtor.com.

More from CNBC

Dell has best day on stock market since its relisting in 2018 after earnings sail past estimates Here’s where the jobs are for August 2023 — in one chart Welcome to spooky season: Horror movies will dominate movie theaters from now until Halloween

A drop in prices would come as some relief to buyers, but unlikely enough.

The jump in home prices since the start of the Covid pandemic, combined with much higher mortgage rates has crushed affordability.

It now takes roughly 38% of the median household income to make the monthly payment on the median-priced home purchase, according to Black Knight. That makes homeownership the least affordable it’s been since 1984.

This post appeared first on NBC NEWS

In this episode of StockCharts TV‘s The MEM Edge, Mary Ellen reviews the new uptrend in the markets and shares where the current strength is, as well as the best ways for you to participate. She also highlights the move back into earnings winners from last month as the markets rebound.

This video originally premiered September 1, 2023. Click on the above image to watch on our dedicated MEM Edge page on StockCharts TV, or click this link to watch on YouTube.

New episodes of The MEM Edge premiere weekly on Fridays. You can view all previously recorded episodes at this link. You can also receive a 4-week free trial of her MEM Edge Report by clicking the image below.

On this week’s edition of StockCharts TV‘s StockCharts in Focus, Grayson walks you through a “bottom-up” stock-picking approach that he uses daily on StockCharts, which helps him find the strongest stocks and best technical setups out there in the market. Learn how to customize your scans for stocks making new 3-month, 6-month, 9-month, 52-week and all-time highs, then see how to further narrow your search by only looking at specific groups like the S&P 500 stocks or the NASDAQ 100 members. After that, Grayson presents his favorite method for reviewing the results across multiple timeframes, and also demonstrates how to schedule scans to run automatically so that your research and discovery process can be semi-automated.

This video originally premiered on September 1, 2023. Click on the above image to watch on our dedicated StockCharts in Focus page on StockCharts TV, or click this link to watch on YouTube.

You can view all previously recorded episodes of StockCharts in Focus at this link.

In this edition of StockCharts TV‘s The Final Bar, Dave wraps the market week with a discussion of higher interest rates, their implication for growth stocks, and why charts like TSLA shouldn’t get an “all clear” until they break above the 50-day moving average. He answers questions from The Final Bar Mailbag covering price and volume techniques, Chaikin Money Flow, and why interest rates are often quoted at 10x their value.

This video originally premiered on September 1, 2023. Watch on our dedicated Final Bar page on StockCharts TV, or click this link to watch on YouTube.

New episodes of The Final Bar premiere every weekday afternoon LIVE at 4pm ET. You can view all previously recorded episodes at this link.

The much-awaited August jobs report was released on Friday. While it came in higher than estimates—187K vs. 170K jobs created—there were other areas of the report that eclipsed the stronger-than-expected figure.

Notably, the average wage increase was less than expected, and average hourly earnings rose 0.2%. What moved the needle there was that the revised job gains numbers for June and July, which went downward by a significant amount. Additionally, the labor force participation rate rose by 0.2 percentage points, and there was an increase in the number of people entering the workforce. The healthcare sector saw the most job increases, with leisure and hospitality, social assistance, and construction not far behind. This was welcome news for the stock market—an increase in workers can bring down wage inflation.

What It Means for the Financial Market

Does the jobs report show enough cooling in the labor market for the Fed to stop raising interest rates? Let’s look at some areas of the stock market that tend to react to the jobs data. 

The 10-year Treasury Yield closed higher. After pulling back from reaching a high of 4.36%, yields rose closing at 4.17%, which is above the 21-day exponential moving average (EMA).

CHART 1: 10-YEAR TREASURY YIELDS ROSE. After the August jobs report, yields rose higher closing above its 21-day EMA. Chart source: StockCharts.com (click on chart for live version). For educational purposes.

Oil prices also rose—the Energy sector was the best-performing sector on Friday. The rise was mainly on the news that Russia and possibly Saudi Arabia would cut their production. Crude oil prices closed above the August highs (see chart below).

CHART 2: OIL PRICES ROSE. A rise in oil prices could add to inflationary pressures but that won’t be determined until the next CPI report. Chart source: StockCharts.com (click on chart for live version). For educational purposes.

The US dollar Index ($USD) has been trending higher and is now close to its May high. It may face resistance at the $104.40 level.

CHART 3: THE US DOLLAR INDEX HAD A STRONG MOVE TO THE UPSIDE. $USD could face resistance at the $104.40 level. Chart source: StockCharts.com (click on chart for live version). For educational purposes.

Equities, on the other hand, were lukewarm and showed little directional movement. However, the broader indexes have managed to hold on to their uptrend. 

CHART 4: THE S&P 500 INDEX SAW LITTLE MOVEMENT. There’s very little directional movement in equities. The S&P 500 index is still in an uptrend, trading above its 50-day moving average. Chart source: StockCharts.com (click on chart for live version). For educational purposes.

Looking at the CME FedWatch Tool, there’s a 93% probability that the Fed will hold interest rates steady in their September 2023 meeting. But that probability reduces to 63.9% for the November meeting. 

The Big Picture

The macro view looks stable, with the possibility of a recession pretty much diluted. If future data shows a cooling in inflation, there’s a chance the Fed may stop raising rates. It almost seems like the market is going through a phase where it’s behaving well. It’s not making any surprising moves, and maybe investors are not opening new positions before Labor Day weekend.

That said, there’s little in terms of economic data next week. It’s possible that nothing much might happen till the Fed meets next. But then again, anything unexpected could happen between now and then.

End-of-Week Wrap-Up

US equity indexes mixed; volatility down

$SPX up 0.18% at 4515.77, $INDU up 0.33% at 34837.71; $COMPQ down 0.02% at 14031.81$VIX down 3.54% at 13.09Best performing sector for the week: TechnologyWorst performing sector for the week: UtilitiesTop 5 Large Cap SCTR stocks: Super Micro Computer, Inc. (ticker symbol: SMCI); Celsius Holdings Inc. (CELH); NVIDIA Corp. (NVDA); Dell Technologies (DELL); XP Inc. (XP)

On the Radar Next Week

July factory ordersAugust S&P Global Services PMI August ISM Services PMIJuly Wholesale Inventories

Disclaimer: This blog is for educational purposes only and should not be construed as financial advice. The ideas and strategies should never be used without first assessing your own personal and financial situation, or without consulting a financial professional.

CEDAR KEY, Fla. — As cleanup begins in the aftermath of Hurricane Idalia, the storm has served as a stark reminder that Florida’s insurance industry remains in flux.

Idalia made landfall in Florida’s Big Bend just before 8 a.m. Wednesday as a Category 3 hurricane. It killed at least three people in Florida before it battered Georgia and other states on the East Coast as a downgraded tropical storm.

Idalia moved offshore Thursday morning, leaving around 330,000 customers without power in Florida, Georgia and South Carolina.

Powerful storms have regularly pummeled Florida’s coastal communities in recent years. The hurricanes have brought high winds, lashing rains and deadly storm surge. Idalia brought much of the same, and it has forced many homeowners to turn to their insurance policies in hope that repairing their homes and replacing their belongings might be covered.

But many of those homeowners face uncertainty amid the upheaval that has emerged in Florida’s insurance industry in recent years.

Burned rubble where a house stood after a power transformer exploded in the community of Signal Cove in Hudson, Fla., on Wednesday, after Hurricane Idalia made landfall.Miguel J. Rodriguez Carrillo / AFP – Getty Images

A thinning insurance market that is beset by more regular hurricanes has caused insurance policy costs to skyrocket. An average home premium in Florida is about $6,000 per year, according to the Insurance Information Institute, an industry trade organization. The U.S. average is about $1,700. 

The state’s insurance industry is preparing to lose four insurers since last year — Farmers Insurance, Bankers Insurance, Centauri Insurance and Lexington Insurance. Farmers Insurance announced just last month that it intends to leave Florida, affecting about 100,000 policy holders, and that it would not be writing new policies. 

Still, it appears Florida is better-positioned to handle insurance claims than it was last year after the state’s insurers acquired adequate levels of reinsurance — a reimbursement system that insulates insurers from very high claims. 

“With all the weather and hurricane events that have come through, the reinsurance market has hardened on the Florida insurance companies,” said Chris Draghi, who specializes in the state’s insurance market as an associate director at AM Best, a global credit agency. “That’s led to material increases and reinsurance costs, which, of course, then strain bottom line results to afford the same level of protections as in the past.”

That could mean that, as the costs for insurers rise further, Floridians’ premiums will be affected. 

Gregory Buck, the president and owner of National Risk Experts Insurance, based in Florida, said that his company’s premiums last year were four times the national average but that those prices are largely based on reinsurers. He expects rates to increase further.

The remains of a destroyed home built atop a platform on piles in Keaton Beach, Fla., on Wednesday during a flight provided by mediccorps.org after Hurricane Idalia passed through.Rebecca Blackwell / AP

“If you look at year on year for the last three to five years, you’re probably talking about between 100 and 300% (in insurance cost increases) depending on where you are and obviously the age and the construction of the homes themselves” Buck said by email. “But absolutely, we are looking at more increases.”

Homeowners in the state said they expect the cost to jump once again, which has led some to consider going without insurance because of the price.

Aimee Firestine stood outside her hotel, the Faraway Inn, in Cedar Key as she said her homeowners insurance rate doubled last year. She said it has left her “thinking about whether you can keep paying for that.”

“That’s one of the issues in Florida is Mother Nature does what it wants and we have to just rebuild and hope insurance can help us out with it,” Firestine said.

The cost of insurance policies could be a major contributing reason that as many as 15% of Florida homeowners are living without property insurance. That is the highest percentage in the country, according to the Insurance Information Institute.

In Florida, 16 severe storms or hurricanes since 2020 have caused $100 billion to $200 billion in damage. That has pushed many in the state to turn to Citizens Property Insurance Corp., the state-backed insurer of last resort, which has quickly become Florida’s fastest-growing insurer. 

The company now has more than 1.4 million policies, centered largely in southeast Florida, up precipitously from 500,000 in 2019. It now covers roughly 1 in 8 Florida households. 

It is a reflection of how private insurers have left the state as the storms walloping Florida grow in number and strength, said Amy Bach, the executive director of United Policyholders, a nonprofit consumer advocacy group. Because the agency is a state-run entity, it could also have an effect on taxpayer dollars.

“As they retreat and government is having an increasing role, that basically translates into taxpayers,” Bach said. “So really, we’re talking about a huge shift in risk-bearing from the private sector to the public, and it’s a big deal.”

Four new insurance companies will join the Florida market next year after legislative reforms designed to promote market stability were passed and signed into law, which could help address the problem. It is unclear, however, what market share the companies might be able to soak up or what their rates might be. 

A flooded house in Crystal River, Fla., on Thursday after Hurricane Idalia made landfall.Chandan Khanna / AFP – Getty Images

Aggravating the problem, 82% of Floridians do not have flood insurance, which is typically operated by the National Flood Insurance Program, a federal program run by the Federal Emergency Management Agency. Congress created the program in 1968 because of a similar issue — the lack of private insurers in flood-prone areas. 

Analysts and experts said few people purchase flood insurance because many do not realize that most homeowners or hurricane policies do not cover flooding, even though hurricanes are a key threat to Florida’s low-lying areas.

Hundreds of thousands of Florida homes lie in flood-risk areas that are not designated as such by the federal government, leaving many homeowners vulnerable to massive out-of-pocket costs for damage after hurricanes.

More than 785,000 properties in the state face flood hazards but are not recognized as high risks in FEMA’s flood maps, according to data from the First Street Foundation, a nonprofit research group. 

The First Street Foundation said that it factors in heavy rainfall, the impact of small waterways’ flooding and climate change and that it updates its models annually, while FEMA does not. On its website, FEMA said it “consistently releases new flood maps and data, giving communities across America access to helpful, authoritative data that they can use to make decisions about flood risk.”

Meanwhile, Mark Friedlander, a spokesman for the Insurance Information Institute, said Florida has major flood events year-round.

“We’re going to see very significant flood losses from the hurricane this week, and only a small percentage of homeowners have that coverage,” he said.

In Taylor County, where Idalia made landfall, for example, only 5.4% of homeowners have flood insurance, Friedlander said. The county, in the Big Bend area of Florida, is home to about 21,000 people, according to the latest census data.

“That entire community is under water,” Friedlander said.

Gabe Gutierrez reported from Cedar Key. Phil McCausland and Melissa Chan reported from New York City.

This post appeared first on NBC NEWS

GoNoGo Charts help investors retain an objective evidence-based view on what is actually happening in the markets, and this week has shown the weight of the evidence on the side of the bulls. In this edition of the GoNoGo Charts show, Alex and Tyler examine the fade of US Dollar strength (UUP) and US Treasury rates ($TNX) moving lower within a sideways range.

This video originally premiered on August 31, 2023. Click this link to watch on YouTube.

Learn more about the GoNoGo ACP plug-in with the FREE starter plug-in or the full featured plug-in pack.

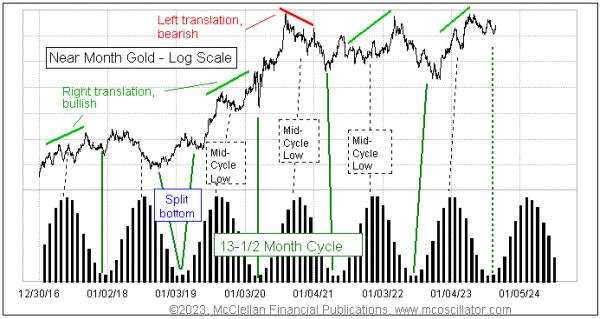
Some analysts talk about seasonality in gold prices, but this does not make sense because of a very important factor. Gold prices have a dominant 13.5-month cycle, not an annual cycle, and so looking at annual seasonality does not make for reliable projections.

This 13.5-month cycle was due for its major cycle low in July to August 2023. I always speak of its due dates in extremely approximate terms, because gold’s actual bottoms can arrive a month or two early or late versus the ideal, while still be considered as arriving normally. And more than once in history, the cycle bottom has seen gold prices split their bottom into two separate ones, each equidistant before and after the ideal cycle low date. In other words, the existence of the 13.5-month cycle is not a great timing tool for identifying the moment of the bottom in gold prices.

That does not mean it is without value, though, because gold’s interaction with this cycle has a lot more to tell us. When a major cycle low in gold prices can be identified as having arrived, as appears to be the case now, the first few months of the new 13.5-month cycle are a reliably bullish time for gold prices. That is what we are facing over the next few months.

This cycle also sees a less important mid-cycle low about halfway between the major cycle lows. So, as the peak of the sine wave representation is approaching, it becomes an environment wherein it is better to be a “trader” for a while than an “investor”. Additionally, the arrangement of prices before and after that mid-cycle low has important information to tell us about what is coming next.

“Left translation” occurs when the price high before the mid-cycle low is higher than the prices after it. That is a bearish configuration, and it says that troubles will persist even after the next major cycle price low. The opposite condition, “right translation”, shows a pattern of a higher high after the mid-cycle low. That is the condition we just saw on the last full cycle, and even though it does not excuse the need for prices to dip in honor of the major cycle low, it does carry a soft promise of good things to come on the next cycle, which is what should be just starting now. 

It is hard to imagine gold prices doing well in an environment of high short-term interest rates, especially high “real” rates, meaning that short term T-Bill rates are above the inflation rate. That is not usually a recipe for gold doing well. The counterpoint to that, though, is that everyone knows about this already, and gold investors may be overly discounting it. The Fed raising short-term rates did not stop gold prices from going up during the last cycle’s bullish phase.

Contrarian wisdom is nothing new to the market’s ears, and it probably speaks to you with some familiarity. You know what it generally says …

“Be fearful when others are greedy, and greedy when others are fearful.” (Warren Buffett)”The time of maximum pessimism is the best time to buy, and the time of maximum optimism is the best time to sell.” John Templeton

Those are two of the more famous maxims. There are hundreds more, and they say pretty much the same thing. If there’s anything we can learn from this, it’s the idea that “most of the time, the crowd is wrong,” to quote Larry Williams himself.

Though top traders and investors have been repeating these maxims like centuries-old vinyl stuck on a repeating groove, it tells us that the contrarian message penetrates us like water penetrating a dry stone. Meaning hardly anyone follows it.

If true, wouldn’t this give you something of a perpetual edge? All you’d need is a reliable means to measure crowd sentiment.

So How Can You Reliably Measure Crowd Sentiment?

A simple but laborious way to do this is to measure what most analysts and influencers are saying. This was easier done before the digital age, when most materials were published in print. As Larry Williams put it, Jim Sibbet pioneered this kind of analysis in the 1960s, when he measured the percentage of bullish newsletters on given commodities.

Nowadays, it’s tougher. There are thousands of content channels—from print and television to social media networks, blogs, and podcasts—to consider. Plus, you have a large crowd of influencers who may or may not be financially savvy, yet many people follow them anyway.

The Williams Sentiment Index: What It Measures and How to Interpret It

The Williams Sentiment Index is an indicator Larry Williams developed to measure and display what many financial analysts and advisors say about a given market. It’s a contrarian indicator available as a plug-in in StockChartsACP.

CHART 1: A CLOSER LOOK AT THE WILLIAMS SENTIMENT INDEX. The blue and red lines are thresholds for bullish and bearish investor sentiment.Chart source: StockChartsACP. For educational purposes.

The indicator is relatively simple to use. The blue and red lines are threshold levels for bullish and bearish sentiment.

Exceedingly Bullish. When the index crosses above the blue line, it indicates that investor sentiment may be too bullish on a given stock and that a decline is likely to emerge. This is a signal to sell.Exceedingly Bearish. When the index crosses below the red line, it indicates investor sentiment may be too bearish and that a rally is likely to emerge. This is a signal to buy.

In terms of timeframe, the Williams Sentiment Index is designed for weekly and daily charts. This makes sense, considering advisors’ focus on intermediate-to-longer-term timeframes.

The Williams Sentiment Index in Action

Let’s look at a weekly chart of Cisco (CSCO) to see how the Williams Sentiment Index might have given a glimpse of market turns before they happened.

CHART 2: WILLIAMS SENTIMENT INDEX IDENTIFYING EXTREMELY BULLISH AND BEARISH INVESTOR SENTIMENT. When reading this indicator, it’s important to focus on context.Chart source: StockChartsACP. For educational purposes.

Like every indicator, don’t treat every signal with equal significance. Context is king.

A— The Williams Sentiment Index signals extreme bullishness, considering how the index spiked above the blue line three times. But what was it spiking against? A resistance level that seemed to hold. That should have told you something—namely, weakening momentum contradicted the bullish sentiment. Prices plunged in a few weeks after the last signal.

B— The index fell below the red line, indicating extreme bearishness. This coincides with prices bottoming out (see green circle).

C— The resistance level a few weeks earlier served as a technical headwind for the rallying stock. Note that prices formed an ascending triangle, which was a bullish indication. However, the extremely bullish sentiment indicated by the index suggested that prices would fall, which eventually happened.

D— As the index shows, now, market sentiment is even more bearish than before. Interestingly, this extreme bearishness marked the beginning of a nine-month uptrend.

What about the subsequent bullish readings? The indicator revealed ultra-bullish readings, yet prices continued to rally. Here’s a question: Once the breakout above the critical resistance area (shown on the left side of the chart) marked the beginning of a strong uptrend, would you go short because the Williams Sentiment Index signaled potential bullish exuberance? The smart answer is “no”, because it would put you on the wrong side of the market. Those readings are insignificant, and the price action that just took place gives you a strong indication that the index readings are producing noise. As we said earlier, context is king.

Prices eventually declined, but you shouldn’t take action until you get confirmation of a reversal.

Now, let’s see how this applies to a daily chart. Below is a chart of Bank of America (BAC).

CHART 3: WILLIAMS SENTIMENT INDEX APPLIED TO BANK OF AMERICA. The indicator anticipated market reversals, but each instance unfolded differently.Chart source: StockChartsACP. For educational purposes.

A— Sentiment was hitting several highs. Interestingly, market sentiment was bullish while price was falling, until the crowds quickly realized they were on the wrong side of the market.

B— Maximum bearishness took hold just as the “informed money” started accumulating shares, as evidenced by the sharp six-week rally that followed. As contrarian wisdom suggests, buy when everyone is most bearish.

C— In this case, the financial crowd was generally in sync with the informed-money crowd. During this period, the index highs gradually tapered off, peppered in with a few index lows. How do you interpret these seemingly mixed signals? Pay attention to the context. When prices are trending up, wait for the trend to break down before you decide to sell, lighten your load, or go short.

So, generally, you get the picture, plus a general idea as to how you can use this tool.

The Bottom Line

The age-old wisdom of contrarian thinking says that going against the crowd often presents the best market opportunities. Yet, only some heed this advice. A contrarian approach isn’t for everyone. But if it resonates with you, or if you’re already going against the grain of popular market-think, then the Williams Sentiment Index might be a good addition to your arsenal. Happy trading!

Disclaimer: This blog is for educational purposes only and should not be construed as financial advice. The ideas and strategies should never be used without first assessing your own personal and financial situation, or without consulting a financial professional.