Archive

2023

Browsing

President Biden had an explosive reaction when he was told the president of Afghanistan had fled Kabul ahead of the Taliban’s takeover of the city in 2021, according to a new book.

On Friday, Aug. 12, 2021, Biden left D.C. for what was expected to be a mid-August vacation to Camp David. Three days later, National Security Advisor Jake Sullivan told him the news that the then-president of Afghanistan, Ashraf Ghani, had fled as the Taliban was poised to march into the capital.

‘Biden exploded in frustration’ when he heard the news and exclaimed, ‘Give me a break!’ according to the forthcoming book ‘The Last Politician’ by journalist Franklin Foer, which describes the inner workings at the White House during the calamitous withdrawal from Afghanistan in 2021.

Biden wasn’t the only one on vacation when Ghani escaped and it became clear to the world that the American withdrawal from Afghanistan would be far more chaotic than the administration expected.

The Biden White House had expected a gradual handover of responsibility to the Afghan government until Aug. 31, 2021, when the Taliban would begin to take an active role in governing the country. Instead, the Taliban rapidly took over territories as the U.S. moved out of various bases and were marching on Afghanistan before Ghani fled, fearing for his life.

However, in the first weeks of August 2021, multiple high-ranking White House officials left for vacation. Biden went to Camp David. Secretary of State Antony Blinken was in the Hamptons. And then-White House press secretary Jen Psaki took her family to the beach.

On Aug. 16, 2021 — the day after Ghani fled Kabul — a U.S. C-17 military transport aircraft filled with evacuees took off from then-Hamid Karzai International Airport, but some people on the crowded runway grabbed on to the landing gear in a desperate attempt to escape as the plane took off.

Upon seeing the ‘images of Afghans falling from the sky,’ which became some of the most dramatic scenes of the evacuation, Psaki knew she had to leave her family vacation, Foer wrote.

According to Foer, Psaki wrote to then-White House Chief of Staff Ron Klain: ‘I’m contemplating coming back,’ and Klain responded: ‘I’m sorry. I think you need to.’

Foer’s book notes that Biden took an active interest in the evacuation, throwing out ideas to get more people on planes and out of the country and asking to be updated when individual people had made it safely out of the Afghanistan.

The Biden administration evacuated more than 120,000 people from Afghanistan as the country collapsed under Taliban pressure. However, that ‘improvised feat of logistics’ failed to overcome the impression that the Biden administration was reacting slowly, Foer wrote.

The White House was ‘stung’ by the fact that the toughest criticism was not just coming conservative media but also from ‘the columnists and venerable reporters that Biden’s inner circle respected and tended to heed,’ Foer’s book states.

Foer writes that ‘[i]n the thick of the crisis, Biden didn’t have time to voraciously consume the news, but he was well aware of the tough coverage. ‘We’re getting killed,’ he would admit. It frustrated him to no end.’

However, the criticism did nothing to change Biden’s mind about leaving Afghanistan nor change his detestation for ‘the conventional wisdom of the foreign policy elites,’ Foer said. ‘After defying their delusional predictions of progress for so long, [Biden] wasn’t going to back down now.’

‘In fact, everything he’d witnessed from his seat in the Situation Room confirmed his belief that exiting a war without hope was the best and only course,’ Foer writes.

Foer’s book recounts the first two years of Biden’s presidency from his inauguration through the 2022 midterm elections. The book is to be released Tuesday by Penguin Random House.

This post appeared first on FOX NEWS

–>

GOP presidential candidate and Florida Gov. Ron DeSantis hammered climate change alarmists in no uncertain terms during Hurricane Idalia’s aftermath.

DeSantis cited an 1896 storm that reportedly had 125 mph winds and Florida’s Labor Day hurricane in 1935, saying during a Sunday press conference that those storms resulted in massive destruction and deaths.

‘So, I think the notion that somehow hurricanes are something new, that’s just false. And we’ve got to stop politicizing the weather and stop politicizing natural disasters,’ DeSantis said. ‘We know from history there’s been times when it’s very busy in Florida, late ‘40s, early ‘50s, you had a lot of hits of significant hurricanes.’

‘So, I think sometimes people need to take a breath and get a little bit of perspective here,’ he said. ‘But the notion that somehow if we just adopt, you know, very left-wing policies at the federal level that somehow we will not have hurricanes, that is a lie. And that is people trying to take what happened with different types of storms and use that as a pretext to advance their agenda on the backs of people that are suffering. And that’s wrong, and we’re not going to do that in the state of Florida.’

DeSantis declined to meet with President Biden during his trip to Florida in the hurricane’s aftermath. Idalia made landfall early Wednesday morning along Florida’s sparsely populated Big Bend region as a Category 3 storm, causing widespread flooding and damage before moving north to drench Georgia and the Carolinas.

Earlier in the same press conference in Yankeetown, Florida, a reporter asked DeSantis if he trusted the federal government to help given what happened in Hawaii and East Palestine, Ohio.

‘I think that the state of Florida, we prepare for this stuff. We were prepared. We responded,’ he said. ‘And really what the federal government’s role is just turning on programs Congress has enacted over many, many years. So, it’s basically serving as a checkbook to get people reimbursed for debris clean up, to give people individual assistance. And so, in that sense, I think that has been turned on, I anticipate that that will go smoothly, but most of the nuts and bolts is done by our local communities and by the state of Florida. And that’s really how it should be. Disaster response is really bottom up.’

DeSantis said most people heeded local warnings of dangerous storm surge and chose to evacuate, noting there’s been no coastal fatalities reported.

The governor said there was one traffic fatality in Alachua County, Florida, related to the storm that has been confirmed so far. Categorizing local and state officials working together as the ‘bread and butter’ of hurricane response, DeSantis said ‘the checkbook from the feds is great, and whatever resources are available as the governor, I’m going to pull those levers to be able to help Floridians, but we’re certainly not relying on the federal government to do the day-to-day heavy lifting.’

Biden faced staunch criticism over his response to the Maui wildfires that obliterated the seaside tourist town of Lahaina last month.

The number of people listed as missing from the fires stood at 385 on Friday, according to state officials.

The Associated Press contributed to this report.

This post appeared first on FOX NEWS

Vice President Harris hosted George Soros heir Alex Soros at her private residence, along with several other top Democratic donors earlier this year, White House visitor logs show.

The White House released Harris’ May 2023 visitor logs late last week, and a May 31 entry showed that Soros visited her private residence, listed in the documents as ‘1st Floor VPR.’ Joining Soros were supermodel Savannah Huitema and seven other prominent Democratic donors.

Soros posted a picture of himself with Harris on X, the platform formerly known as Twitter, on June 6, and boasted about a meeting with the vice president. Details of where and when the meeting took place were not previously known, however.

The meeting was the 21st time Soros has met with a member of President Biden’s administration, according to analysis by the Washington Free Beacon.

‘Great to catch up with Madame Vice President, Kamala Harris!’ Soros wrote at the time.

The visitor logs say Soros and the other guests arrived at the residence at 4 p.m. and stayed until midnight.

When Soros first bragged of the meeting earlier this year, it caught the attention of many conservative media figures, as well as one U.S. senator.

‘It’s laughable that the Left wants you to believe that the Soros family has no influence in politics,’ said Sen. Marsha Blackburn, R-Tenn.

‘Is it still offensive to say the Soros family has an outsize influence on Democratic politics,’ added political operative Logan Dobson.

The younger Soros also maintains close contact with Democratic lawmakers, which he often brags about and posts about on social media. His Instagram shows dozens of pictures with top Democrats in the House and Senate between 2018 and 2022.

Soros’ visit came just days before he publicly announced that he was taking over control of Open Society Foundations, his father’s philanthropy group. The younger Soros is considered to be ‘even more radically leftist than his father.’

Fox News’ Joe Schoffstall contributed to this report.

This post appeared first on FOX NEWS

Republican presidential candidate Nikki Haley on Sunday called for term limits and mental competency tests in Congress, arguing that ‘we need people at the top of their game’ after Senate Minority Leader Mitch McConnell’s latest episode of freezing up in public.

Haley, a former U.S. ambassador and governor of South Carolina, said on CBS News’ ‘Face the Nation’ that aging members of Congress need to understand when ‘it’s time to step away,’ after McConnell froze for more than 30 seconds while fielding questions from reporters in Covington, Kentucky, on Wednesday.

‘Here you have Mitch McConnell, who’s done great service to the country,’ Haley said. ‘You have Dianne Feinstein who had a great career. You’ve got Nancy Pelosi who’d been there a long time – at what point do they get it’s time to leave?’

‘This is not just a Republican or Democrat problem, this is a congressional problem, and they’ve got to know when to leave,’ she said. ‘It’s time to pass this down to a new generation of conservative leaders that want to take our country to a better place.

‘We need people at the top of their game,’ she continued. ‘We have too many issues on the table that need to be dealt with. We can’t continue to have these people who think they know better than the American people.’

While Haley has previously supported mental competency tests for politicians aged 75 and older, she said Sunday that she would support them across the board as a requirement to run for office.

‘When a candidate files to run for office, incumbent or a newcomer, they have to give their financial disclosures,’ she said. ‘They should also give a notice from the doctor that tells about their mental capacity. I think that we need that.’

‘Our enemies are watching all of this, and every time they have an instance like that, America is less safe, because our enemies think we’re out of control, and that’s got to stop,’ she added.

Haley, who is currently polling fourth in the crowded 2024 GOP primary, came under fire last week after she mocked the U.S. Senate as a ‘nursing home’ when asked about McConnell’s episode.

‘It’s sad,’ she told Fox News. ‘No one should feel good about seeing that any more than we should feel good about seeing Dianne Feinstein, any more than we should feel good about a lot of what’s happening or seeing Joe Biden’s decline.

‘What I will say is, right now, the Senate is the most privileged nursing home in the country,’ she said. ‘I mean, Mitch McConnell has done some great things and he deserves credit. But you have to know when to leave.’

McConnell has been cleared to resume his ‘schedule as planned’ after the instance on Wednesday.

‘I have consulted with Leader McConnell and conferred with his neurology team. After evaluating yesterday’s incident, I have informed Leader McConnell that he is medically clear to continue with his schedule as planned,’ Dr. Brian Monahan, Congress’ attending physician, wrote in a note Thursday. 

The long-standing GOP lawmaker previously froze for about 30 seconds during a news conference alongside other Republican lawmakers on Capitol Hill in Washington, D.C., a month ago.

McConnell’s office did not respond to Fox News Digital’s request Sunday for a response to Haley’s criticism.

Fox News’ Timothy Nerozzi contributed to this report.

This post appeared first on FOX NEWS

The dog days of August are mercifully over. And as Wall Street gets back to work, new trends are emerging which could influence what the stock market does for the rest of the year.

Here are the macro crosscurrents to sort through:

The Fed is on the bubble as some Fed governors want to pause the rate hikes, while others want to push rates higher;The jobs market seems to be cooling;The bond market is focused on inflation, but is off its worse levels as it ponders what the Fed will do next, whether the job market is going to get weaker, and whether the price of oil will upset the apple cart;Stocks are working on putting in a credible bottom; andThe oil market looks set to erupt.

Altogether, these variables suggest the fourth quarter has the potential to be a potentially profitable quarter for investors who can discern where the smart money is flowing and successfully follow it.

Bond Volatility Increases as Data Shifts Rapidly

The bond market’s inflation fears eased over the last few weeks ,but the most recent round of purchasing manager data (ISM and PMI), suggesting festering inflation in the manufacturing sector, erased the glee generated by the apparent cooling of the jobs market via lower-than-expected JOLTS and ADP data, which was boosted by the rise in the unemployment rate and a tame payrolls report.

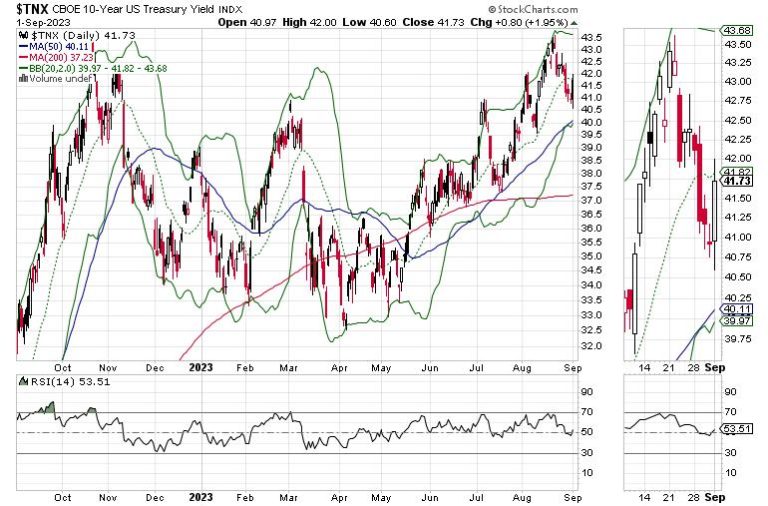
The U.S. Ten Year Note Yield (TNX) reversed its downward move toward 4% in response to the purchasing manager’s data, which was interpreted as a picture of stagflation. The yield is nervously trading between its 20- and 50-day moving averages.

Smart Money Roundup: Watching NVDA Effect on QQQ

Calls for the death of the so-called AI bubble may have been premature, although the jury is still out for the sector in the short-term. Certainly, the action in AI bellwether Nvidia’s shares (NVDA) is an important metric to keep an eye on.

The stock’s recent volatility suggests that investors are thinking about what comes next, although the company continues with its bullish guidance. On the other hand, the slowly developing downslope in the Accumulation/Distribution (ADI) line is cautionary, as it suggests short sellers are starting to bet on lower prices for the stock.  

On Balance Volume (OBV) is in better shape, which suggests that a sideways pattern or a steady uptrend is the most likely path for the stock after the consolidation. You can see the NVDA effect reflected in the shares of the Invesco Nasdaq 100 Trust (QQQ) which is also consolidating. Support for QQQ is at $370.

Oil is Getting Hot

Tech is consolidating, but the smart money is moving into oil. You can see that in the bullish breakout of West Texas Intermediate Crude (WTIC), which is now above $85. Recall my May 2023 article, titled “Never Short a Dull Market,”, where I predicted that tight oil supplies were in the works and that the odds of higher prices were better than even.

And that’s exactly what’s happened. In the last three weeks, the U.S. Energy Information Agency (EIA) has reported a nearly 30 million barrel drawdown in U.S. oil inventories. Moreover, there are two coincident developments unfolding, which are likely to further decrease supplies:

OPEC + is likely to maintain its current production cuts in place for at least another month; andThe U.S. is quietly refilling its Strategic Petroleum Reserves.

These two factors, combined with stable-to-possibly-rising consumer demand for gasoline, and perhaps a rise in demand for heating oil as the weather turns cooler, are likely to keep prices on an upward trajectory for the next few weeks to months, and perhaps longer.

Expressed in more investor-accessible terms, you can see the shares of the U.S. Oil Fund ETF (USO) have broken out above the $75 resistance level, with excellent confirmation from a rise in the Accumulation/Distribution (ADI) and On Balance Volume (OBV) indicators as short sellers step aside (ADI) and buyers move in (OBV).

The bullish sentiment in oil also includes the oil stocks including the Van Eck Oil Services ETF (OIH), which is nearing its own breakout. This is due to the rise in global exploration, which has been steadily developing over the last twelve months, but which the market has mostly ignored, despite CEO comments of an oil service “super cycle” unfolding.

Things are happening fast. Oil, tech, housing, bonds, are all making their move. What’s your plan of action in this market? Join the smart money at Joe Duarte in the Money Options.com. You can have a look at my latest recommendations FREE with a two week trial subscription. You can also review the supply demand balance in the oil market and what the future may hold here. And if you’re a Tesla (TSLA) fan, I’m reviewing some interesting developments in the stock, which you can review free of charge here.

Breadth Recovery Shows Staying Power

Last week, I noted the worst may be over in the short term for stocks, as the market’s breadth is showing signs of resilience. This bullish trend is showing some staying power, as the New York Stock Exchange Advance Decline line moved above its 50-day moving average while maintaining its position above the 200-day moving averages. Another bullish sign is that RSI is nowhere near overbought, which means the rally still has legs.

On the other hand, the Nasdaq 100 Index (NDX) ran into resistance at the 15,600 area, where there is a moderate size cluster of Volume-by-Price bars (VBP) offering a bit of turbulence, as investors who bought the recent top are trying to get out “even”. Accumulation/Distribution (ADI) and On Balance Volume (OBV), may have bottomed out, but are showing some short-term weakness.

The S&P 500 (SPX) is acting in a similar way, although it remained above 4500, but above 4350, and it its 20-day and its 50-day moving averages. ADI is flat, but OBV is improving as investors put money to work in the oil and related sectors.

VIX Remains Below 20

VIX has been a bright point in the market for the last couple of weeks, as it has failed to rally above the 20 area. This is good news, as a move above 20 would be very negative, signaling that the big money is finally throwing in the towel on the uptrend.

When the VIX rises, stocks tend to fall, as rising put volume is a sign that market makers are selling stock index futures to hedge their put sales to the public. A fall in VIX is bullish, as it means less put option buying, and it eventually leads to call buying, which causes market makers to hedge by buying stock index futures. This raises the odds of higher stock prices.

Liquidity Remains Stable

Liquidity is stable. The Secured Overnight Financing Rate (SOFR), which recently replaced the Eurodollar Index (XED) but is an approximate sign of the market’s liquidity, just broke to a new high in response to the Fed’s move. A move below 5.0 would be more bullish. A move above 5.5% would signal that monetary conditions are tightening beyond the Fed’s intentions; that would be very bearish.

To get the latest information on options trading, check out Options Trading for Dummies, now in its 4th Edition—Get Your Copy Now! Now also available in Audible audiobook format!

#1 New Release on Options Trading!

Good news! I’ve made my NYAD-Complexity – Chaos chart (featured on my YD5 videos) and a few other favorites public. You can find them here.

Joe Duarte

In The Money Options

Joe Duarte is a former money manager, an active trader, and a widely recognized independent stock market analyst since 1987. He is author of eight investment books, including the best-selling Trading Options for Dummies, rated a TOP Options Book for 2018 by Benzinga.com and now in its third edition, plus The Everything Investing in Your 20s and 30s Book and six other trading books.

The Everything Investing in Your 20s and 30s Book is available at Amazon and Barnes and Noble. It has also been recommended as a Washington Post Color of Money Book of the Month.

To receive Joe’s exclusive stock, option and ETF recommendations, in your mailbox every week visit https://joeduarteinthemoneyoptions.com/secure/order_email.asp.

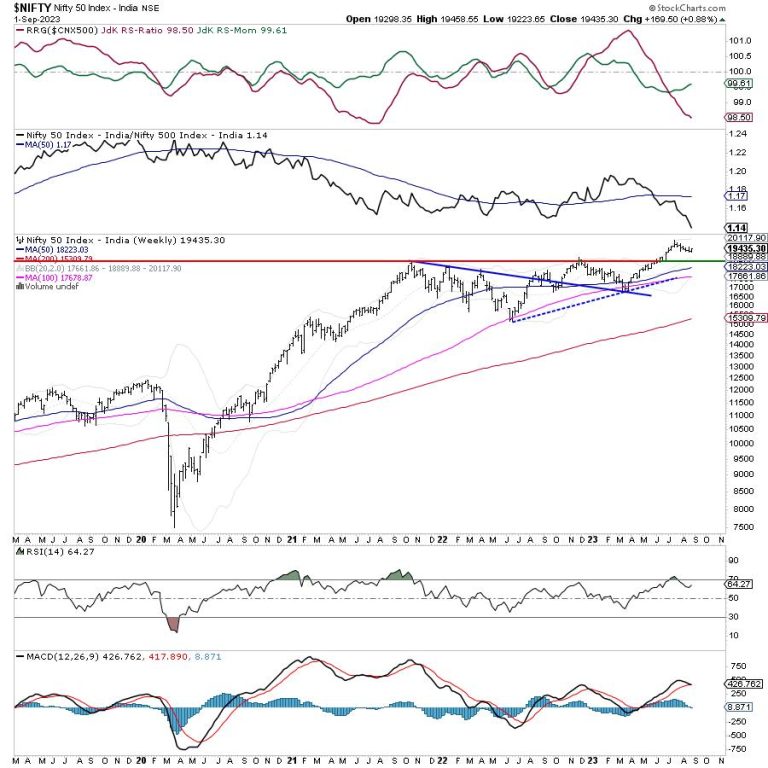
The past five sessions of the week saw the Indian equities trading in a defined and narrower range. The first four sessions were seen leading the markets to a weekly loss but the strong trending session on Friday saw Nifty recouping its losses. As compared to the previous week, the index oscillated in a narrower 234.90 points range. The price action over the past five sessions has led to the formation of a bar with a similar bottom and lower high for the index. Following a strong rebound in the previous session, the headline index closed with a net gain of 169.50 points (+0.88%) on a weekly basis.

There is one important change that is happening; beginning next week, Banknifty’s weekly options expiry is being moved to Wednesday. Until now, both Nifty and Banknifty weekly options expired every Thursday; but from now on, Banknifty Options will expire/settle every Wednesday and Nifty on Thursday.

The Nifty 50 had been lingering around the 19,250 mark until a recent rebound that occurred on Friday. The significance of this support level cannot be overstated in the days ahead. It is absolutely essential for the Nifty’s ongoing upward trajectory to sustain a weekly closing above 19,250. Should it dip below this threshold, it may indicate additional vulnerability, possibly resulting in a test of the 18,800 support level. It is advisable to closely monitor the Nifty’s weekly closing figures, with a specific focus on the 19,250 level. If there is a consistent breach below this threshold, it may signify a change in market sentiment and the possibility of additional declines. On the other hand, a resurgence from this level could rekindle bullish momentum.

Volatility dropped over the past week; INDIAVIX came off by 5.94% to 11.36 on a weekly basis. The coming week is expected to see the levels of 19600 and 19730 acting as resistance levels. The supports come in at 19250 and 19000 levels.

The weekly RSI is 64.27; it remains neutral and does not show any divergence against the price. The weekly MACD is bullish; however, it sits on the verge of a negative crossover as evidenced by the sharply narrowing Histogram.

The pattern analysis shows that the breakout that NIFTY staged following its move above 18900-19000 levels stays valid despite the recent corrective retracement. However, if the level of 19250 is violated, it may lead to Nifty retesting the breakout point again leading to a full throwback.

In the previous technical note, it was mentioned that defensive pockets like IT, and low beta space like PSE stocks may do well. The previous week did see these pockets doing well and this trend is likely to get carried forward over the coming week as well. The markets are having their primary uptrend intact; however, at present, they remain under a secondary corrective phase. This may lead to oscillations on either side. It is recommended to avoid excessive exposures and remain light on leveraged exposures while maintaining a selective and stock-specific outlook for the coming week.

Sector Analysis for the coming week

In our look at Relative Rotation Graphs®, we compared various sectors against CNX500 (NIFTY 500 Index), which represents over 95% of the free float market cap of all the stocks listed.

Relative Rotation Graphs (RRG) analysis shows Nifty PSE Index has rolled inside the leading quadrant. Besides this, the Media, Metal, PSU Bank, Pharma, Energy, and Midcap indices are also inside the leading quadrant. These groups may show relative outperformance against the broader markets.

The Nifty Infrastructure index has rolled inside the weakening quadrant. Nifty Realty, Auto, and Consumption indices are also inside the weakening quadrant.

Nifty FMCG, Financial Services, Banknifty, and Services Sector index languish inside the lagging quadrant. This may lead to these groups relatively underperforming the broader NIFTY 500 index.

The Nifty commodities index, which is inside the improving quadrant is seen improving on its relative momentum again. The IT Index also remains firmly placed inside the improving quadrant.

Important Note: RRG™ charts show the relative strength and momentum of a group of stocks. In the above Chart, they show relative performance against NIFTY500 Index (Broader Markets) and should not be used directly as buy or sell signals.  

Milan Vaishnav, CMT, MSTA

Consulting Technical Analyst

www.EquityResearch.asia | www.ChartWizard.ae

I love the seasonality information that StockCharts.com provides. It’s important to keep in mind that seasonal tendencies are secondary indicators. I don’t buy and sell based on them, because the price/volume combination will always be my primary indicator. But if technical indications point to higher prices and seasonality supports this technical thought process, then my confidence in a strategy or individual trade soars. I want to first take a trip down memory lane. I always shake my head when the “Go Away in May” crowd begins to chant in late April. In case you weren’t watching, the S&P 500 gained ground in 2023 AFTER these chants as follows:

May 2023: +0.25%June 2023: +6.47%July 2023: +3.11%

It’s only 10% return roughly (sarcasm). History, if you actually study it, suggests the true “go away” period to be July 17th through September 26th.

The 2023 gains on the NASDAQ have been even more impressive:

May 2023: +5.80%June 2023: +6.59%July 2023: +4.05%

That’s over a 16% return in just 3 months! “Go away in May” at your own risk.

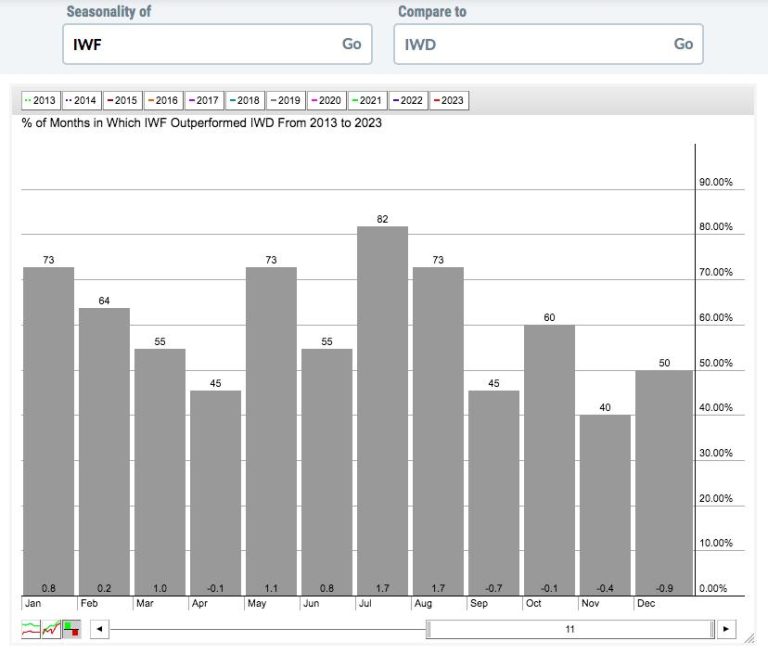
One important piece of history I shared with EarningsBeats.com members several months ago was the relative strength in growth stocks (IWF) vs. value stocks (IWD) from May through August. The “Go away in May” crowd totally misses the BEST four consecutive months of relative outperformance of growth stocks, which I find sad. Check out this relative seasonal chart of the IWF vs. the IWD since this secular bull market started in 2013:

It takes just a moment to break those average monthly returns into three periods as follows:

January through April: +1.9%May through August: +5.3%September through December: -2.1%

Growth stocks PUMMEL value stocks from May through August (paying attention “Go away in May” folks?), after outperforming during the first 4 months of the year. But September 1 is when seasonal winds tend to blow from the other direction. Those final 4 months tend to result in underperformance of growth stocks.

Here’s the last year’s chart, which shows that this IWF:IWD relationship has followed the historical pattern to a “T”:

While growth stocks have experienced a significant absolute and relative run to the upside in 2023, it makes sense to at least consider the possibility that winds will soon be blowing from a different direction.

There’s one value stock in particular that would absolutely LOVE this shift in wind direction as it’s ready to advance from a technical perspective and it LOVES the end of the year historically. In fact, it’s averaged gaining 10.5% in Q4 alone since the secular bull market began in 2013! I’ll feature it in our FREE EB Digest newsletter on Tuesday morning before the market opens. If you’d like to receive it and you aren’t already an EB Digest subscriber, simply CLICK HERE and sign up by entering your name and email address. That’s all it takes! There’s no credit card required and you can unsubscribe at any time.

Happy trading!

Tom

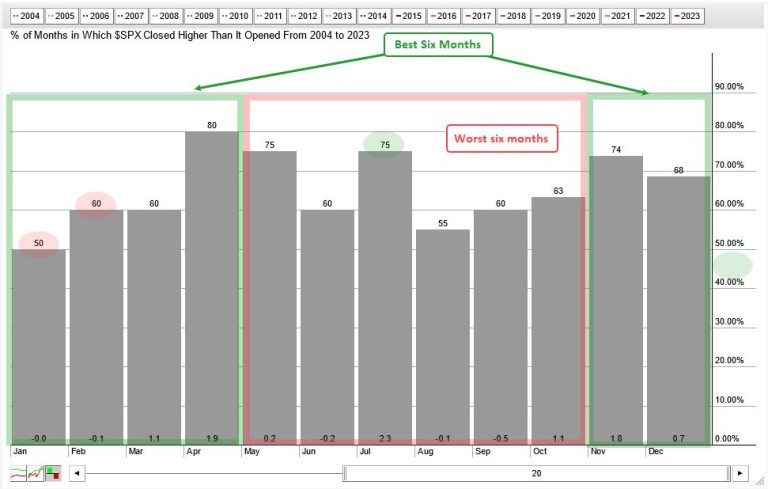
According to the Stock Trader’s Almanac, the best six-month period runs from November to April. The worst six-month period runs from May to October. This is where the phrase “sell in May and go away” comes from. There is some validity to the best six months strategy, but investors would probably be better off with a simple timing tool. We will first investigate the best and worst six months, and then show the timing tool.

The chart below shows historic seasonal performance for the S&P 500 since 2004 (20 years). The red shading shows the worst six months, and the green shading highlights the best six months. There are some pretty good months within the worst six month period (May, July). There are also some so-so months within the best six month period (January, February).

I would like to show a different perspective on this seasonal pattern using an equity curve. The strategy buys the S&P 500 on the first day of November and sells on the first day of May. It is long the S&P 500 during the best six months and in cash the other six months. The chart below shows the equity curve for this strategy (green line) and the equity curve for the S&P 500 (blue line). There is a pretty strong positive correlation with S&P 500 performance as both curves rising and fall together. Avoiding the worst six months did not provide immunity to broad market swings and the Maximum Drawdown was 47.5%. The red shading shows the best six months outperforming in 2001 and 2002 because it missed some big declines in September. Avoiding drawdowns is an important part of our strategies at TrendInvestorPro (here).

Now let’s turn the tables. We will now buy the S&P 500 on the first trading day of May and sell on the first trading day of November. These are the worst six months. Being long during the worst six months did not keep up with buy-and-hold. However, we can see a positive correlation with buy-and-hold (blue line). The green and red arrow lines show the equity curve rising and falling along with the market. The red shading shows the equity curve falling as the market rose in 2010, 2011 and 2012. 

 Even though the best six months strategy performed admirably, it did not preserve capital as it experienced a 47.55% drawdown in February 2009. Seasonal patterns are interesting and sometimes work, but they are not that great for timing and avoiding drawdowns. The next chart shows the equity curve for a strategy that buys and sells the S&P 500 based on the 5/200 day SMA cross. Buy when the 5-day SMA for the S&P 500 crosses above the 200-day SMA and sell when the 5-day crosses below. The Maximum Drawdown was limited to 20.53% because the 5/200 cross triggered timely sell signals in 2000 and 2007. Also notice that the drawdowns in 2020 and 2022 were shallower.

This 5/200 cross is part of the Composite Breadth Model (CBM), which is used for broad market timing at TrendInvestorPro. The CBM has been bullish since March 31st (2023) and this means stock strategies are active. We are currently running momentum-rotation strategies that trade Nasdaq 100 and S&P 500 stocks on a weekly basis. In testing, these quantified strategies handily outperformed buy-and-hold and did so with much lower drawdowns. Click here to learn more.  

—————————————

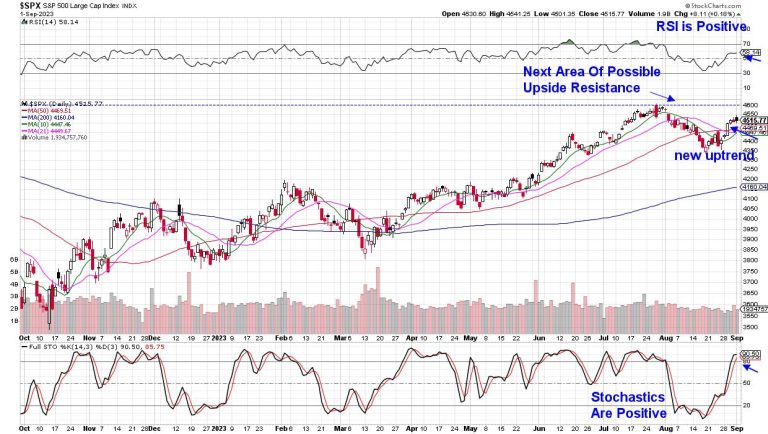
Last week, the broader markets regained their uptrend, with the S&P 500 and Nasdaq Indexes both closing above their key 50-day moving averages on Tuesday. In addition, the RSI and Stochastics turned positive as well. This price action indicates that the 3-week pullback which began in late July has been reversed.

The biggest winners last week were growth stocks, which had tumbled the most amid a rising interest rate environment that began in late July. Rising rates are negative for growth stocks, as they reduce the value of future earnings.

DAILY CHART OF S&P 500 INDEX

Rates pushed lower last week as investors regained optimism that the Federal Reserve will continue to pause their rate hike campaign. The shift occurred due to weaker-than-expected economic and inflation data. Technology stocks were the biggest winners, with recently weak Semiconductor and Software stocks rallying an average of 5% last week. A rally in heavyweight stock Apple (AAPL) also gave the Indices a boost. Last week’s rally in AAPL occurred amid investors’ optimism surrounding the company’s iPhone 15 release, which is expected on the 12th of this month. While the chart is in a bullish position from which to trade higher, September tends to be a poor month for Apple, with shares falling more than half of the time following a bullish run up into their product releases.

DAILY CHART OF APPLE (AAPL)

A better option might be to take advantage of the move back into Homebuilding stocks, which regained their uptrend after declining rates pushed mortgages lower. Sales of new U.S. single-family homes rose in July, as an acute shortage of existing homes drove buyers to new units. This shortage of properties offset the impact of high mortgage rates in July that had dampened demand in prior months. Below is a chart of the S&P Homebuilders ETF (XHB), which points to further near-term upside for this group.

DAILY CHART OF S&P HOMEBUILDERS ETF (XHB)

Last week’s impactful economic data provided plenty of fuel for the markets, as weak reports were viewed as a positive amid receding fears of further rate hikes. Next week, the economic calendar is very light, which may leave room for a reinterpretation of the Fed’s possible action at their next meeting later this month. In the chart of the S&P 500 above, we’ve highlighted key areas of near-term support and resistance.

For those who’d like to be kept up to date on market sentiment as well as be alerted to new stock candidates as they’re added to my twice-weekly MEM Edge Report, use this link here to receive immediate access to recent reports, as well as this Monday’s new report. Subscribers were alerted to the market’s new uptrend on Tuesday, where we added two new stocks to the Suggested Holdings List.  These high-quality growth stocks were in the Software and Semiconductor groups, which have also just recently regained their uptrend.

Enjoy the long weekend!

Mary Ellen McGonagle, MEM Investment Research

Novice investors usually go on a “Holy Grail quest” early on, reading books and watching videos and searching for that elusive one indicator to rule them all. After 23 years of analyzing the markets using technical analysis, I will tell you one thing for sure…

There is no Holy Grail.

What I will also tell you is that there are a number of technical indicators that do a very good job of helping the astute investor to analyze trends, quantify investor sentiment, and anticipate inflection points in price.

One of my favorite indicators to do all of the above is the Relative Strength Index, or RSI. Created by Welles Wilder and promoted in his classic text New Concepts in Technical Trading Systems (featured in our Recommended Reading List!), the RSI has become my go-to oscillator to better understand price dynamics.

Today, I’ll show three ways that I use the RSI to identify short-term price swings, determine trend phases, and anticipate market turns.

Overbought vs. Oversold

When I was first introduced to technical indicators, I was kindly asked (that is, forced) to prove out the calculations to about 20 indicators in Excel. The idea was that, by understanding the math behind each indicator, I could better understand how it was using inputs of price and/or volume and how the output could be used to anticipate turning points.

Wilder originally designed RSI for the commodity markets, and for him it was all about mean reversion. In other words, the goal was to buy low and sell high, and RSI was a tool to try and optimize those entry and exit points.

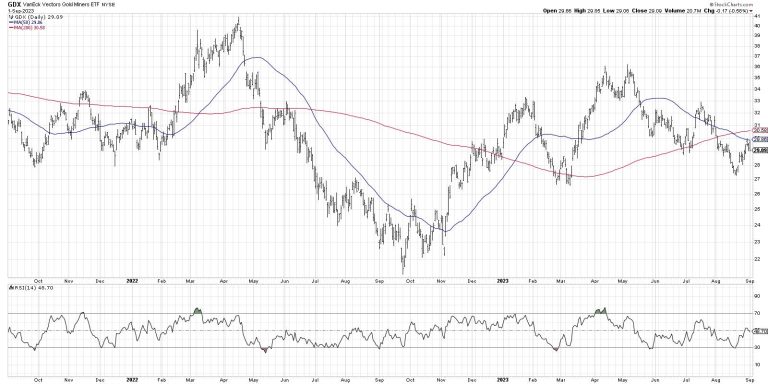
The chart of gold miners has plenty of examples of where overbought conditions were followed by short-term drops, and oversold conditions usually happen right before a bounce higher. To be clear, the real signal is not when the indicator enters the overbought/oversold region, but rather where it exits that extreme condition.

Buy signals in February, May, and August 2023 all worked quite well, as gold stocks bounced higher in each instance. Sell signals in January and April 2023 also worked out, with price pulling back in both cases.

Sometimes, those extreme readings become a little more complex, and we need to add divergences to our technical analysis arsenal.

The Dreaded Bearish Divergence

It makes sense that, when a stock is an uptrend, the RSI will tend to get to the overbought region. Price is going higher, driven by stronger upside momentum, so an overbought condition should be expected. So when the price continues higher not on stronger momentum, but weaker momentum, that’s when we may need to take action.

Notice how Apple made higher highs every month from January to July? Now focus on the highs in late June and mid-July. The price of AAPL continued to grind higher, but the RSI actually sloped lower. This pattern of higher prices and lower momentum is called a bearish momentum divergence and usually indicates a bullish phase that is “running out of gas”. In other words, the end of the trend is near!

We noticed bearish divergences on key growth stocks back in July, which meant the subsequent drop in August was a likely next step for the markets. But how can we relate short-term RSI signals to long-term trends? This is where Connie Brown’s work completely changed how I use the Relative Strength Index.

Using RSI to Determine Trend Phases

The above example using gold stocks provided a decent illustration of overbought and oversold conditions. But sometimes the RSI never gets to an extreme reading. Does that mean the indicator is broken? No, it means the price is trending.

In Connie Brown’s groundbreaking book, Technical Analysis for the Trading Professional (another book featured in our Recommended Reading List!), she explains how the range shown by the RSI over time can tell you about the overall trend structure.

When a chart is in a confirmed downtrend of lower highs and lower lows, the RSI often becomes oversold on the downswings. But the countertrend moves back to the upside usually stall out with an RSI around 60. You’ll see the opposite in an uptrend, where the RSI often becomes overbought on a move higher, but rarely breaks below 40 on pullbacks.

Here’s that same chart of GOOGL but with the phases indicated with a shaded RSI.

Through the end of 2022, Alphabet was in a clear downtrend phase. The fact the RSI never really broke above 60 on upswings tells us that, while we are seeing some countertrend bounces, the overall trend remains bearish. Note how the pattern changes in January 2023, with the RSI pushing up to 70 on a rally. This was an early indication that something had changed and that the overall downtrend phase was evolving into a new uptrend phase.

As long as GOOGL becomes overbought on upswings, and the RSI remains above 40 on pullbacks, the RSI is telling us that the overall trend remains bullish.

I’ve found the Relative Strength Index to be an effective way of anticipating turning points, recognizing trend shifts, and confirming market phases. By applying indicators like RSI in a consistent and disciplined manner, an astute investor can use price momentum to better identify entry and exit points in any market environment.

RR#6,

Dave

P.S. Ready to upgrade your investment process? Check out my free behavioral investing course!

David Keller, CMT

Chief Market Strategist

StockCharts.com

Disclaimer: This blog is for educational purposes only and should not be construed as financial advice. The ideas and strategies should never be used without first assessing your own personal and financial situation, or without consulting a financial professional.

The author does not have a position in mentioned securities at the time of publication. Any opinions expressed herein are solely those of the author and do not in any way represent the views or opinions of any other person or entity.