Archive

2023

Browsing

FIRST ON FOX: A senior ethics attorney for President Biden donated to the campaign of a Virginia Democrat facing heat after livestreaming sex acts with her husband online, Fox News Digital has discovered.

According to a Fox News Digital review of state campaign finance records, Jeanne Duross, senior ethics counsel in the White House’s Presidential Personnel Office, donated $1,000 to Democrat Susanna Gibson’s campaign on Oct. 30, 2022. 

The Presidential Personnel Office helps ‘President Biden recruit, vet, and nominate thousands of highly qualified appointees who work to advance the Biden-Harris agenda in federal agencies across the U.S. government,’ the White House’s website states.

Gibson, a 40-year-old nurse practitioner and mother of two, has been in the middle of the firestorm after The Washington Post revealed Monday that she used a platform called Chaturbate to stream the sex acts with her husband and solicited ‘tips’ from viewers for performing specific actions that would go to a ‘good cause.’ 

The embattled Democrat posted over a dozen videos in September 2022 after officially entering the race in suburban Richmond for the House of Delegates in the 57th district.

Liberal advocacy groups such as Emily’s List, which pushes for Democratic female candidates, defended Gibson following the exposé. 

‘Susanna originally ran for office because of the overturning of Roe and she’s been very outspoken on standing up for reproductive rights,’ Emily’s List spokesperson Lauren Chou told The Associated Press. ‘People are coming out in support of Susanna because they know that Republicans are coming after her because she was standing up for them.’

Gibson has also said reports of her publicly streamed online activities were ‘an illegal invasion of my privacy designed to humiliate me.’

‘My political opponents and their Republican allies have proven they’re willing to commit a sex crime to attack me and my family because there’s no line they won’t cross to silence women when they speak up,’ she told CNN in a statement on Tuesday.

The White House did not immediately respond to a request for comment on Duross’ donation to Gibson’s campaign.  

Fox News Digital’s Peter Hasson and Andrew Mark Miller contributed to this report.

This post appeared first on FOX NEWS

This past week had all the potential to see a revival of the great bull market of 2023. The September inflation data, Apple’s latest product announcements, and Arm’s IPO all seemed had the possibility to reignite the fire of bullishness for investors.

By Friday’s close, however, the S&P 500 appeared to be limping into the weekend. Growth stocks struggled and defensive sectors thrived as the market took on a very risk-off feel to wrap the week.

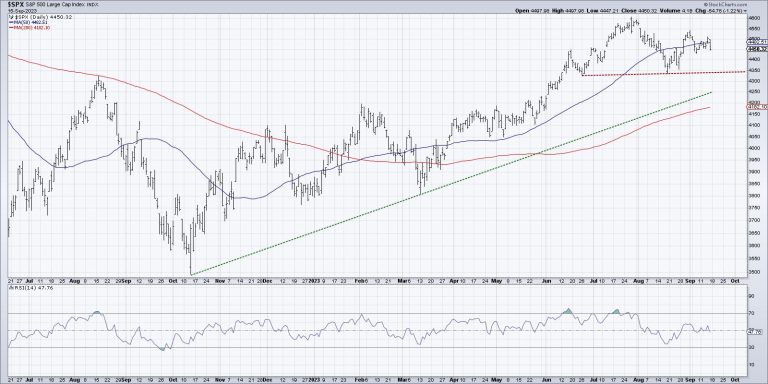
With this week’s pullback, the S&P 500 chart appears to be forming a potential head-and-shoulders pattern.

Note the peak in late July around 4600, surrounded by lower highs in June and August. If and when the SPX can break below the “neckline” formed by the interim lows in June and August, that would suggest further deterioration to at least the 200-day moving average.

Let’s look at three key ETFs, all showing signs of distribution, all with further downside potential, and all with implications for further deterioration in risk assets.

Semiconductors (SMH)

Semiconductor stocks have done quite well since the October 2022 low, with the strong relative strength demonstrating consistent outperformance over the S&P 500 index. This ETF beautifully illustrates the dominance of large-cap growth stocks over other cap tiers in 2023.

In July, we noted a bearish momentum divergence, where price moved higher while the RSI trended lower. This pattern often indicates an exhaustion point during bull phases, and suggests limited upside due to weakened positive momentum.

After testing resistance around $160 twice in July, the SMH registered a lower high in late August. If the price would push below $142, that would mean a new lower low as well. Given the weakened relative strength profile and negative momentum swing, there appears to be very real potential for further downside in this bellwether industry group.

Homebuilders (ITB)

For most of 2023, homebuilders were firing on all cylinders with consistent new highs and a steady uptrend for relative strength. Momentum characteristics, as measured by the RSI indicator, were similar to previous bullish market phases.

Note the high prices in July and August, where the ITB tested the same resistance level around $89 many times over a four-week period. Then, around the Labor Day holiday, we see a new lower high around $88. Similar to semiconductors, this leading group began to show signs of deterioration, as the uptrend had stalled out.

The relative strength line, which had been trending higher since November 2022, has now turned lower. This indicates that the industry group is underperforming the S&P 500, and also suggests that institutional investors are rotating their assets to other opportunities, like Energy stocks.

We can identify price support around $81 from lows in July and August. This level was reached once again this week, with Friday’s drop once again pushing price down to potential support. If we see a break below $80, that would complete a breakdown pattern, with the height of the pattern indicating a minimum downside objective around $73.

Bonds (AGG)

This last chart is different than the others, in that it has been in a confirmed downtrend for some time now. The iShares Core U.S. Aggregate Bond ETF (AGG) is based off a popular bond market index and combines Treasury bonds and corporate bonds into one ETF.

While the Nasdaq 100 and S&P 500 indexes broke above their February 2023 highs in April and May, respectively, AGG never was able to accomplish this breakout. A trendline using the highs since May show a fairly steady downtrend in bond prices, leading to a key support level around $94.50.

Note how the RSI has remained below 60 during this period as well. In bearish market phases, the entire range of a momentum indicator often moves lower. As long as the RSI remains below 60 on price bounces, it would suggest that this downtrend in bond prices is very much intact.

Why would lower bond prices suggest further downside for equities? A quick look at the Ten-Year Treasury Yield shows how higher rates are often not an ideal environment for growth stocks.

Lower bond prices mean higher bond yields. And higher interest rates are a headwind for growth stocks, as the value proposition for growth stocks is the potential for future earnings growth. If interest rates are going higher, that means that the future earnings of growth companies are worth less today.

As the panel just below the Ten-Year Yield shows, growth stocks have been holding steady with value stocks despite this rising rate environment. But if bond yields keep trending higher, this would put more and more pressure on growth stocks. which in turns means more potential downside for our growth-oriented benchmarks like the Nasdaq 100 and the S&P 500.

The S&P 500 has not yet confirmed a head-and-shoulders topping pattern. But given the weak trends in these three key ETFs, it appears that a breakdown for the S&P is much more likely than investors may expect!

RR#6,

Dave

P.S. Ready to upgrade your investment process? Check out my free behavioral investing course!

David Keller, CMT

Chief Market Strategist

StockCharts.com

Disclaimer: This blog is for educational purposes only and should not be construed as financial advice. The ideas and strategies should never be used without first assessing your own personal and financial situation, or without consulting a financial professional.

The author does not have a position in mentioned securities at the time of publication. Any opinions expressed herein are solely those of the author and do not in any way represent the views or opinions of any other person or entity.

In this episode of StockCharts TV’s Sector Spotlight, I chat with guest Ralph Acampora in the StockCharts.com studio in Redmond, WA. We discuss the birth of ARGoN, a special way of looking at markets from both a price and a relative perspective.

Once upon a time, Ralph was used to talking to institutional investors who were all about relative performance; they needed to beat the benchmark. This all changed when he started presenting to private clients, who confronted him with their totally different way of looking and perceiving market performance. As Ralph explains, he need to blend both price and relative performance led to the development of, what is now known as, ARGoN – Acampora’s Relative Grid of Nine.

This video was originally broadcast on September 15, 2023. Click anywhere on the Sector Spotlight logo above to view on our dedicated Sector Spotlight page, or click this link to watch on YouTube.

Past episodes of Sector Spotlight can be found here.

#StaySafe, -Julius

In this edition of StockCharts TV‘s The Final Bar, Dave drops a special all-mailbag episode, including viewer questions on using Average True Range for stop losses, stocks vs. bonds, India’s test of all-time highs, and best practices for price volatility.

This video originally premiered on September 15, 2023. Watch on our dedicated Final Bar page on StockCharts TV, or click this link to watch on YouTube.

New episodes of The Final Bar premiere every weekday afternoon LIVE at 4pm ET. You can view all previously recorded episodes at this link.

The Ichimoku Kinko Hyo (or Ichimoku for short) is like a Swiss army knife of an indicator, designed for everything from projecting support and resistance to identifying trade signals. It has five key components that should be combined to analyze current price action while setting up future trades.

What makes the Ichimoku unique among indicators is its 26-day look-forward and look-back feature. It’s sort of like driving: you can’t just move based on what’s in front of you, you have to scan your sides to see what’s happening now, as well as look behind you to see what it means for your planned maneuvers.

This article examines the 26-period look-back: the Chikou Span, or the “Lagging” Span.

Two Reasons to Look Back 26 Days

If you can see what’s happening now and have a potential setup for the future, why look back? It seems a bit awkward, but there must be some rationale beyond the Chikou Span’s function.

Well, there are two:

First, to measure (more like “confirm”) market sentiment.Second, to signal potential trend reversals, sometimes early on.

In this way, you can look at current and future setups with the confidence of seeing some form of confirmation based on past price action. Let’s consider the first reason: measuring market sentiment.

Measuring Market Sentiment with the Chikou Span

Take a look at the daily chart of Apple, Inc (AAPL) below:

CHART 1. APPLE INC (AAPL) AND ICHIMOKU INDICATOR WITH ALL COMPONENTS BUT THE CHIKOU SPAN DULLED OUT. This chart shows that the Chikou Span is 26 days (or periods) behind current prices.Chart source: StockChartsACP. For educational purposes.

The Chikou Span is displayed in blue.The arrow labeled A is the candle of focus.The arrow labeled B marks where the Chikou Span was 26 days prior.

Now, note that in B, the Chikou Span was well below the price 26 days prior. This indicates that sellers (or the proverbial “bears”) controlled the market. And, of course, you know this because prices have fallen from where they stood 26 days ago.

So what’s the value in showing and confirming what you already know? The value of the Chikou Span is in the moment of its crossover and can be used to identify trend reversals.

Using the Chikou Span to Identify Potential Trend Reversals

Let’s look at the same chart, but go back several periods.

CHART 2. AAPL, CHIKOU SPAN, AND THE CLOUD (OR “KUMO”). The Chikou Span gave a bearish signal when it fell below past prices, but you have to look at other Ichimoku components to get a more accurate read on current and potential future price movements.Chart source: StockChartsACP. For educational purposes.

Note the two green circles labeled A and B. When price gapped lower at A, it coincided with the Chikou Span crossing below prices 26 days prior, as shown at B.

When the Chikou Span crossed below price and the Tenkan-sen (conversion line) and Kijun-sen (base line), it’s considered a bearish indication. As you can see, prices continued to fall. However, price also falls into the Cloud (aka Kumo), generally viewed as potential support.

So there are two conflicting signals: a potential trend reversal signaled by the crossovers, but potentially bullish support in the cloud. Which one is it going to be, bullish or bearish? This is where the nuances set in, and it depends on the kind of trader you are and how you use the rest of the Ichimoku components.

An aggressive trader might have used the negative Chikou Span crossovers as a signal to go short.A less aggressive trader would have waited for the Chikou Span to cross below the Cloud itself (which hasn’t yet happened).

Note the outcome: Prices eventually fell through the cloud, but found support. However, upon re-entering the cloud, support became resistance, and the cloud eventually turned a bearish red. What happens next is anyone’s guess. While the aggressive approach happened upon a good outcome, it wasn’t the “safest” trade to take. So, it depends on your risk tolerance and approach to the markets.

So, what might have been a better trade based on a Chikou Span crossover? Let’s go back to March 2023.

CHART 3. AAPL AND CHIKOU SPAN. The Chikou Span turned bullish before most other indicators did.Chart source: StockChartsACP. For educational purposes.

At the beginning of February 2023, the stock price (point A) was still recovering from an ugly combination of decline and consolidation. There were a few layers of resistance overhead, and there weren’t many strong indications that prices were about to make a break for the upside, save for one bullish signal: the Chikou Span (point B) crossed above price, the conversion and base lines, and the cloud itself.

What followed was an uninterrupted seven-month uptrend, and the Chikou Span crossover was one of the earliest indications that prices were getting revved up to soar.

The Bottom Line

The Ichimoku Kinko Hyo can be an effective trading tool that offers a holistic market view through its five components. Among these, the Chikou Span’s 26-day look-back feature is particularly unique, as it provides retroactive insights that can, ironically, be used to forecast future price action. While this “Lagging Span” operates with a 26-day delay, this doesn’t diminish its anticipatory value. Instead, it underscores the importance of retrospective analysis, proving that sometimes a look back can offer the clearest view forward.

Latest on the UAW strike

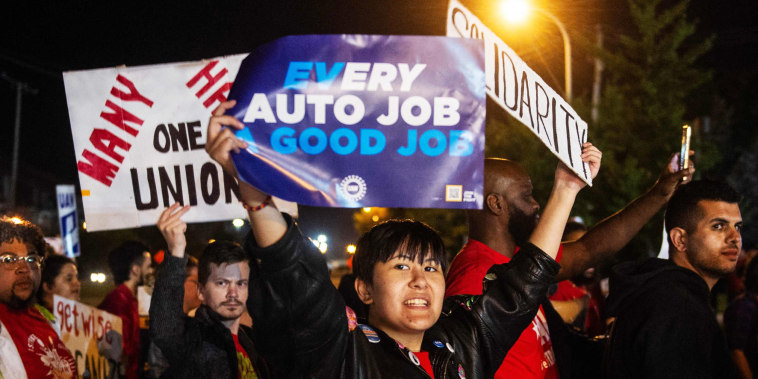
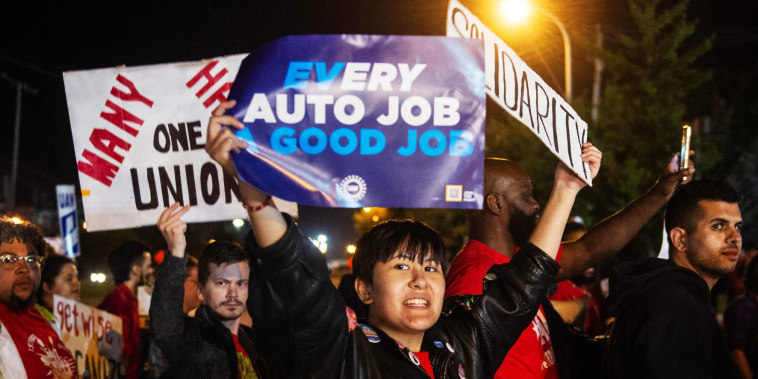
At midnight, the United Auto Workers union officially went on strike against the Big Three automakers. Members walked out at three plants: a GM site in Wentzville, Missouri; a Stellantis center in Toledo, Ohio; and a Ford assembly location in Wayne, Michigan. How Detroit’s Big Three automakers are fighting to dominate the next generation of the car industryWhy the United Auto Workers want big raisesWhat’s at stake in the UAW strike

This post appeared first on NBC NEWS

FIRST ON FOX: A group of 30 House Republicans is demanding to know what the Department of Justice (DOJ) is doing to combat the emergence of AI-generated child pornography on the internet.

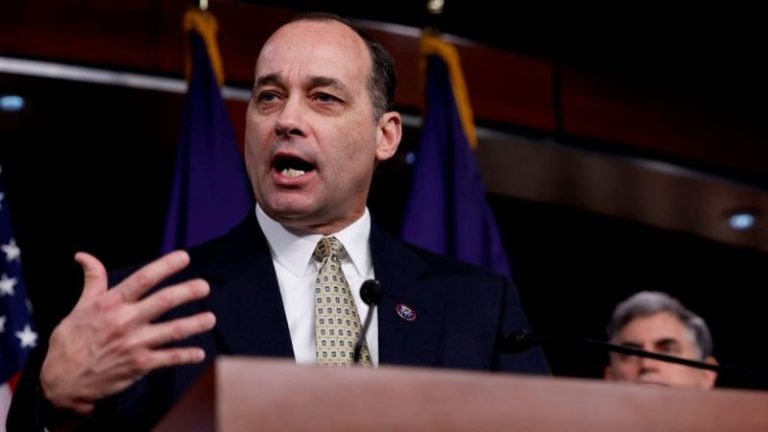
‘We write to you with grave concern regarding increasing reports of artificial intelligence (AI) being used to generate child sexual abuse materials (CSAM) which are shared across the internet,’ Rep. Bob Good, R-Va., wrote in a letter to Attorney General Merrick Garland. 

‘While recognizing the benefits of appropriate uses of AI, including medical research, cybersecurity defense, streamlining public transit, and may other applications, we believe action must be taken to prevent individuals from using AI to generate CSAM.’

They’re asking Garland about whether his department has ‘the necessary authority’ to crack down on the growing issue and whether ‘gaps in the current criminal code’ make it harder for law enforcement officials to pursue those who create and possess AI-generated CSAM. The lawmakers are also asking the DOJ to launch an internal inquiry into the troubling material.

‘The first reports of AI being used to exploit children for the purpose of generating CSAM surfaced in 2019, when it was revealed that AI could generate obscene, personalized images of minors under the age of 18,’ they said.

The lawmakers cited an October 2020 report by the MIT Technology Review that warned of an AI app that was being used to digitally ‘undress’ images of women, predominantly underaged girls.

But AI technology has only grown more widespread and sophisticated since then, with diffusion model apps like Midjourney and DALL-E making it easy for most online users to generate fake images or alter existing ones. Midjourney has banned words related to human anatomy from prompts in an effort to prevent creation of AI-generated pornography.

The Washington Post reported in June that using the AI technology to create CSAM of children who do not exist still violated child pornography laws, according to DOJ officials, but did not mention specific incidents of someone being charged for possession of such items.

‘This report is deeply concerning, and we seek to understand what steps can be taken to address this perverted application of AI,’ the lawmakers’ letter said.

In addition to Good, the letter is also signed by Reps. Ken Buck, R-Colo.; Ben Cline, R-Va.; Anna Paulina Luna, R-Fla.; and Ralph Norman, R-S.C., among others.

Earlier this year, the attorneys general of all 50 states wrote to Congress urging it to expand current rules on child pornography to cover AI and set up ‘an expert commission to study the means and methods of AI that can be used to exploit children specifically.’

Fox News Digital reached out to the DOJ for comment.

This post appeared first on FOX NEWS

FIRST ON FOX: House Democrats appear to be behind another Biden-Harris ticket, even as President Biden is being discouraged against running by some on the left.

Fox News Digital asked Democratic House lawmakers on Capitol Hill Thursday if they think Biden should continue his quest for a second term following Washington Post columnist David Ignatius’ latest piece calling on the president to drop out of the race.

Ignatius cited the president’s age as a major factor in his opinion on another Biden candidacy.

Most of the House Democrats — save Rep. Dean Phillips of Minnesota — emphatically told Fox News Digital they were behind Biden for president.

Rep. Mary Gay Scanlon, D-Penn., told Fox News Digital she ‘absolutely’ believes Biden should run again and that the president ‘has done a great job.’

‘Go Joe Biden and Joe should run for re-election,’ said freshman Democrat Rep. Jonathan Jackson of Illinois.

Massachusetts Democrat Rep. Seth Moulton said Biden ‘is running’ and has ‘an incredible record.’

When asked if Biden’s age could be an issue in the next election, Moulton said that ‘is up for the American people to decide.’

Democrat Florida Rep. Debbie Wasserman Schultz also told Fox News Digital that she was behind the Biden-Harris ticket.

Phillips — who has been outspoken on new blue blood entering the 2024 race — told Fox News Digital that what Ignatius wrote in his column ‘is on the minds of many.’

‘I think what it says about the Democratic Party is that there’s space and place for different opinions, there’s space and place to debate and deliberate what’s in both our party’s best interest and the country’s best interest,’ Phillips said.

The Minnesota Democrat said that he’s ‘never said anything about the president other than he’s a man of compassion’ and ‘a man of competence.’

Phillips said that he believes Biden ‘has done a darn good job’ in his first term in office and added that ‘competition is always healthy in politics.’

Some Democrats did not answer the question, including Reps. Jamie Raskin of Maryland, Greg Casar of Texas, and Don Davis of North Carolina.

The lawmaker’s comments come as Democrats from across the political spectrum are expressing hesitancy toward accepting that Biden and Vice President Kamala Harris represent the best chance for a Democratic presidential ticket to win in 2024.

This week, former House Speaker Nancy Pelosi, D-Calif., refused to say she believes Harris is Biden’s best running mate in 2024. 

‘He [Biden] thinks so,’ Pelosi said. ‘And that’s what matters.’ 

Pelosi added her name to a growing list of politicians and pundits on the left who have publicly expressed concerns over Biden’s age, his many gaffes, and Harris’ cratered favorability rating.

‘I don’t think Biden and Vice President Harris should run for re-election,’ Washington Post columnist David Ignatius, a favorite scribe of the liberal establishment, wrote on Tuesday, pointing to the fact that Biden would be 82 at the start of a second term. 

‘It’s painful to say that, given my admiration for much of what they have accomplished. But if he and Harris campaign together in 2024, I think Biden risks undoing his greatest achievement — which was stopping [former President] Trump.’ 

Fox News Digital’s Andrew Mark Miller contributed reporting.

This post appeared first on FOX NEWS

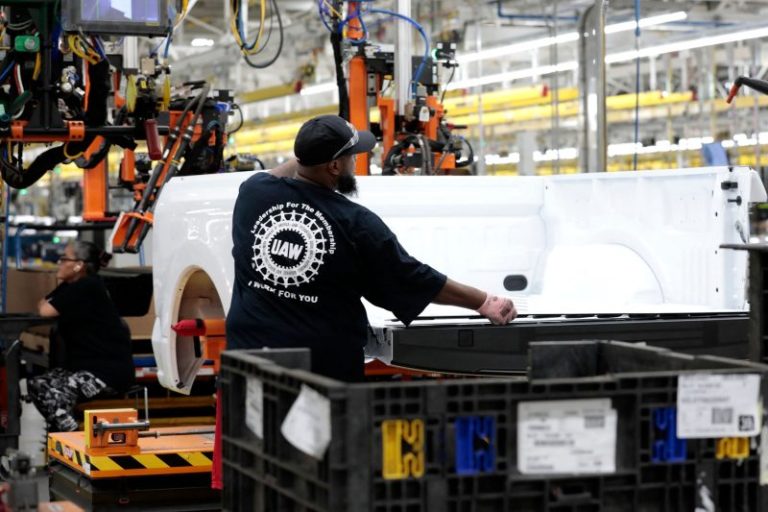
The United Auto Workers’ standoff with the “Big Three” U.S. automakers — General Motors, Ford and Chrysler maker Stellantis — isn’t all about money, but much of it is.

With up to 146,000 workers threatening to strike as soon as Friday if contract agreements can’t be reached, late-stage negotiations have revolved heavily around compensation and benefits.

The union has sought a wage increase of up to 40% (amounting to 46% compounded) over the length of the next four-year contracts, along with full pay for 32-hour workweeks, better retirement pensions and improved health care.

“I know that our demands are ambitious, but I’ve told the companies repeatedly I’m not the reason that members’ expectations are so high,” UAW President Shawn Fain said last week. “What’s driving members’ expectations are the Big Three’s profits.”

Annual gross profits have risen by 34% at Ford and 50% at GM since 2019, the last time the UAW and the Big Three entered contract negotiations. Stellantis, which formed when Fiat Chrysler merged with Peugeot in 2021, grew its annual gross profit by 19% from 2021 to 2022.

The Big Three have already agreed to raise workers’ wages but say they need to save enough money to invest in the globally competitive shift toward electric vehicles.

Another key reason the UAW is pushing hard for steep wage increases is to make up for historically high inflation since it secured its current contracts in October and December 2019.

Since then, hourly U.S. wages among motor vehicle and parts manufacturers (including union and nonunion workers) grew by 14.8%, to an average of $27.99 as of August. Across all industries, average hourly earnings grew by 19% over that period, to $33.82.

High inflation has eroded a lot of those gains, with the Consumer Price Index showing costs rising by 17.7% over that time. Under previous UAW contracts dating back decades, many Detroit autoworkers had received cost-of-living raises to keep pace with inflation, but those provisions were jettisoned after the 2008 financial crisis upended the car industry.

Pay among Big Three workers can vary by tier — a practice the UAW has called to eliminate. (UPS workers secured a contract last month that curtailed a similar structure.) For now, the tiers include part-time employees making the lowest hourly wages, “in-progression” full-time employees with earnings around the middle of the pay scale and full-time employees making up to the maximum wage.

Maximum average hourly wages are $31.77 at Stellantis, $32 at Ford and $32.32 at GM.

This money should be spread around. Not evenly per se, but show us the same gratitude you’re showing the CEO.

Ford Truck plant worker Troy dale, Louisville, ky.

Workers say they haven’t been rewarded as handsomely as the executives running their companies during a period of high profits.

The CEOs of the Big Three have each had salary increases of 30% to 40% in recent years. GM chief Mary Barra’s compensation grew by 32.5% from 2018 to 2022. During the same period, the median GM employee’s pay grew by just 2.8%, public filings show.

Ford appointed a new CEO, Jim Farley, in 2020, and pay for that role jumped by 18% from 2018 to 2022, while the median Ford employee’s pay rose by 16.1%.

Data for Stellantis is unavailable because the company was formed only in 2021 and is now headquartered in Amsterdam, where pay disclosure rules differ from those in the U.S. But disclosures show the company’s CEO, Carlos Tavares, making 365 times as much as its median employee.

That ratio is 362-to-1 at GM and 281-to-1 at Ford, putting all three automakers above the average S&P 500 company’s ratio of 272-to-1, according to the AFL-CIO, a major coalition of unions.

“I feel like this money should be spread around,” said Troy Dale, a UAW Local 862 member at Ford’s truck plant in Louisville, Kentucky. “Not evenly per se, but show us the same gratitude you’re showing the CEO.”

Dale said that after more than seven years of service, he makes $29.63 an hour, still short of the company’s top rate.

Most workers at the plant live paycheck to paycheck, he said. His own family’s finances are deeply tied to the facility, where his son also works and where his daughter started just this week.

“This 40% would help a whole lot of people,” Dale said.

The automakers’ counteroffers have fallen well short of the UAW’s 40% target. Stellantis proposed late last week to boost wages by 14.5%, which Fain rejected the same day as “deeply inadequate.” The highest percentage increase publicly on offer is Ford’s, at 20%, which the UAW said “barely makes up for minimal past raises combined with high inflation.”

The companies say they need to balance their labor costs with investments in EV infrastructure, especially given growing competition from the likes of Tesla, Volkswagen and Hyundai, which all employ typically much cheaper nonunion workers in the U.S.

“As we look ahead to that electrified future, we need to maintain our profitability while remaining competitive,” Stellantis said in a statement. “At 40% greater cost than conventional technology, passing the additional cost of electrification on to consumers is not an option as it puts EV affordability at risk for middle-class buyers.”

A lengthy strike could reduce production and delay plans at GM, Ford and Stellantis during a “crucial period” in that industrywide shift, Wedbush Securities EV analyst Dan Ives wrote in a note Monday.

During a strike, the UAW would support its picket lines by paying its members $500 a week. A Goldman Sachs Equity Research estimate this month anticipates the union’s $850 million strike fund lasting up to roughly 11 weeks.

At the same time, the automakers would take on a few billion dollars in revenue losses each week their plants are shut down. Goldman researchers expect GM and Ford to lose about $2.5 billion and $3 billion, respectively, for every week of a strike.

Over the last couple of contracts, we haven’t really hit what we’ve been asking for, and we feel like this is the time.

Ford assembly plant Worker Jonathan Ellis, Louisville, Ky.

The firm also modeled the cost of the UAW’s proposed 40% wage increase, projecting $4 billion to $6 billion in added costs over four years for GM and Ford each. (It didn’t provide estimates for Stellantis.) For comparison, the automakers made a combined $25.9 billion in net income last year alone.

In Louisville, workers have already participated in practice pickets and signed up for strike shifts that would begin at midnight Friday. Dale and his kids are signed up, as is Jonathan Ellis, who also works for Ford’s Louisville operations at a nearby assembly plant.

“The strike part, it’s scary,” said Ellis, who worked his way up to earning $31.78 an hour after eight years at the company. “You don’t know how long it’s going to go for.”

But if there’s no agreement, he’ll be ready to walk out with his colleagues.

“Over the last couple of contracts, we haven’t really hit what we’ve been asking for,” Ellis said, “and we feel like this is the time.”

This post appeared first on NBC NEWS

Latest on the UAW strike

At midnight, the United Auto Workers union officially went on strike against the Big Three automakers. Members walked out at three plants: a GM site in Wentzville, Missouri; a Stellantis center in Toledo, Ohio; and a Ford assembly location in Wayne, Michigan. How Detroit’s Big Three automakers are fighting to dominate the next generation of the car industryWhy the United Auto Workers want big raisesWhat’s at stake in a possible UAW strike

This post appeared first on NBC NEWS