Archive

2023

Browsing

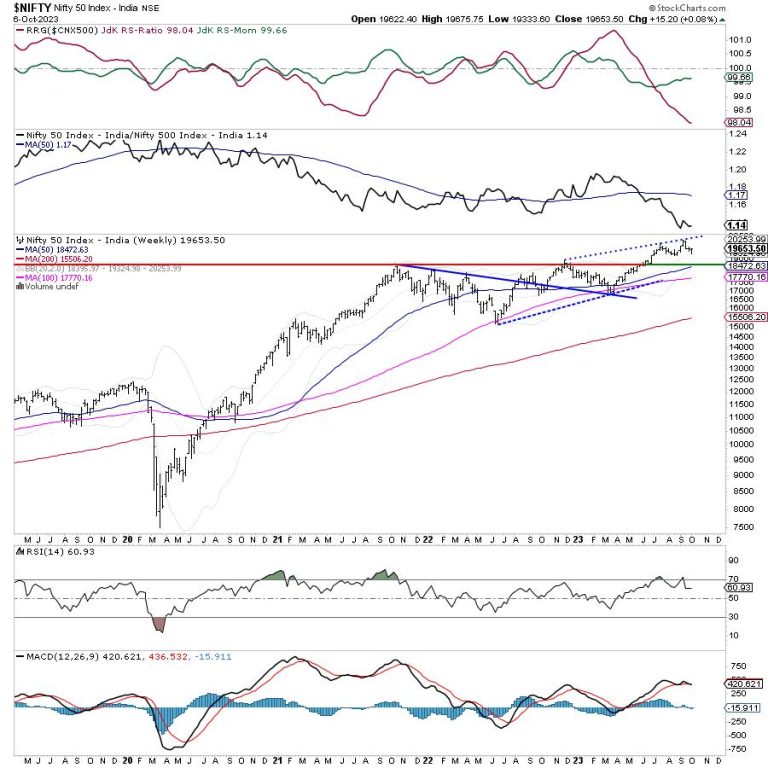
Despite the volatile moves during the past four sessions in the short week, it was the second week in a row that ended on a very flat note. The trading range remained slightly wider as compared to the previous week. Against the 274.55 points range in the week before this one, the index oscillated in the 342.15 points. The highlight of the week was the surging US 10-YR yields that put pressure on global equities and India was resilient, but no different. The markets went on to test key support levels on the weekly charts and experienced a technical rebound from there. Finally, the headline index closed with a net gain of 15.20 points (+0.08%) on a weekly basis.

The highlight of the week was yet another decline in INDIA VIX on a week-on-week basis. As of Friday’s close, INDIAVIX declined 10.06% to 10.30 and now it hovers near one of its lowest levels seen in its lifetime. Keeping everything else aside, the precariously low levels of VIX continue to keep the markets vulnerable to sharp moves even if the broader levels on the charts are not violated. Even if the technical pullback that was seen during the last two sessions extends itself, we will need to keep an eagle eye on VIX which has all the potential to not only infuse volatility on a large scale but also trigger violent profit-taking moves from higher levels. The NIFTY tested and rebounded from the 20-Week MA; this level, which is placed at 19324 is now an important support on a closing basis.

We are likely to see the coming week getting flagged off on a positive note with the levels of 19780 and 19900 acting as potential resistance points. The supports come in at 19500 and 19320 levels.

The weekly RSI is 60.93; it stays neutral and does not show any divergence against the price. The weekly MACD has shown a negative crossover; it is now bearish and stays below its signal line. A candle with a long lower shadow appeared; its occurrence near the support level of 20-week MA adds credibility to this support level at least for the short term. However, given the very small real body, this candle can also be called a spinning top which indicates the indecisive behavior of the market participants.

The pattern analysis shows that on the daily chart, the index has managed to cross above the 50-DMA which is placed at 19607. Therefore, looking from a very short-term perspective, keeping your head above this point will be important for Nifty to avoid weakness. On the weekly charts, the Index has rebounded off its 20-week MA which is at 19324. This level is expected to act as a major support on a closing basis; if violated, it will invite incremental weakness for the markets.

Overall, the markets may have rebounded from their weekly lows and also might extend their technical rebound at the beginning of the week, but the current technical picture suggests that we will need to stay extremely vigilant at higher levels. The low levels of VIX remain a concern, and there are all possibilities of volatility spiking over the coming days and weeks. It would be prudent to seek a safe approach and stay invested in low-beta stocks and also limit exposures to defensive pockets like PSEs, Pharma, IT, etc. In the event of the technical rebound extending itself, it will be of paramount importance to keep protecting profits at higher levels. While keeping overall leverage at modest levels, a cautious and selective approach is advised for the coming week.

Sector Analysis for the coming week

In our look at Relative Rotation Graphs®, we compared various sectors against CNX500 (NIFTY 500 Index), which represents over 95% of the free float market cap of all the stocks listed.

Relative Rotation Graphs (RRG) show that the IT index has rolled inside the leading quadrant. Besides this, the Nifty Media, PSUBank, PSE, Metal, Pharma, Energy, and Midcap indices are inside the leading quadrant. A few like Energy, Metal, Media, etc., are showing a deceleration in their relative momentum but these groups are likely to overall relatively outperform the broader markets.

The Nifty Realty and Auto indices are inside the weakening quadrant.

The Nifty Bank Index continues to languish inside the lagging quadrant along with the Financial Services index. These groups may relatively underperform the broader markets. The FMCG and Consumption indices are also inside the weakening quadrant but they are seen improving their relative momentum against the broader markets.

The Nifty Commodities and Services Sector indices are inside the improving quadrant.

Important Note: RRG™ charts show the relative strength and momentum of a group of stocks. In the above Chart, they show relative performance against NIFTY500 Index (Broader Markets) and should not be used directly as buy or sell signals.  

Milan Vaishnav, CMT, MSTA

Consulting Technical Analyst

www.EquityResearch.asia | www.ChartWizard.ae

One thing I have found in my time analyzing the markets is that investors love to overcomplicate things. We seem to think that a process that is more complicated is somehow more effective! Meanwhile, my own technical analysis checklist starts with a very simple question. I look at the chart and ask myself, “Is this chart going up, down, or sideways?”

You may laugh at the simplicity of this question, based on Charles Dow’s original work defining trends and identifying those patterns in stock prices. In 2023, as in 1923, and as I’m sure will be the case in 2123, prices move in trends. The reality is that when we skip this crucial first question, we can often get into trouble because we neglect this most basic of technical assessments.

Stan Weinstein (whose classic book is featured in the technical analysis section of our Recommended Reading List!) took this argument further with his “Stage Analysis” work, which classifies stocks based on their trend characteristics. My own approach groups charts into three general buckets, based on my assessment of the price trend. To be specific, any chart can be described as going up (the accumulation phase), going down (the distribution phase), or going sideways (the consolidation phase).

In this article, I’ll review the characteristics of each phase, what makes them unique from the other phases, and how a savvy investor can best trade stocks in each bucket.

The Accumulation Phase: GOOGL

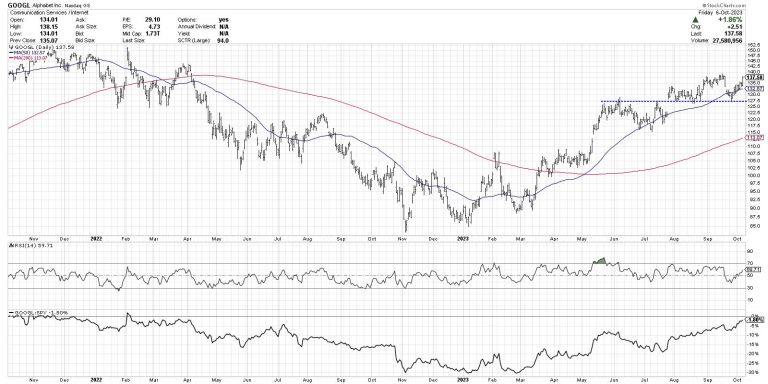
While our major benchmarks have shown clear signs of distribution, stocks like Alphabet Inc. (GOOGL) continue to show consistent signs of strength. This phase is marked by a clear uptrend of higher highs and higher lows, just as Charles Dow explained in his essays over a century ago.

A key aspect to this phase is that the swing lows keep getting higher. This suggests that investors are “buying the dips” and using short-term pullbacks as an opportunity to add to existing positions. Most recently, GOOGL found support around the $127.50 level, which lines up nicely with the August lows as well as the high from early June.

Note how the price is above two upward-sloping moving averages, which speaks to the well-established uptrend that continues to drive prices ever higher. The price momentum, as reflected by the RSI (second panel), is strong but not excessive. In a bullish phase, the RSI will usually come down to around 40 on a pullback, but rarely go any further down.

Finally, and perhaps most impressively, the relative strength (bottom panel) continues to drift higher. This tells us that the stock is outperforming the S&P 500, and, therefore, is truly helping our portfolio’s performance. It’s always a good idea to look for stocks with strong relative strength characteristics, and in a corrective market environment, it is absolutely vital to your portfolio’s well-being!

Ideally, we can identify charts that are just entering the accumulation phase. But for charts like GOOGL, already into an established uptrend, I find the best approach is to ride the uptrend until the chart tells you it’s over. As many traders have said over many years, “The trend is your friend.”

The Distribution Phase: SBUX

It’s not too hard to find stocks that are in a distribution phase, with the Consumer Staples and Communication Services sectors providing the most plentiful examples here in late 2023. Charts in this phase are experiencing lower highs and lower lows, as we see clearly displayed for Starbucks Corp. (SBUX).

As long as the chart continues to make lower lows and lower highs, the downtrend is considered intact. Trendlines can often provide a good visual representation of the pace of the decline and offer a good signal of a potential reversal. Note how the trendline using recent swing highs lines up well with the 50-day moving average, currently around $96.50.

While GOOGL was above two upward-sloping moving averages, here we find the price is below two downward-sloping moving averages. Even though there are brief countertrend bounces to the upside, the negative slope to the moving averages speaks to the consistent downtrend at play here.

Since the May peak, the RSI has fluctuated between the oversold level (below 30) on down moves and the 60 level on upswings. In a bearish trend, the range of the RSI usually moves down to this range, which confirms the overall negative momentum characteristics.

The relative strength line continues to slope downwards, telling us that SBUX is underperforming the benchmark. This means that not only are we losing money in absolute terms, but we’re also doing worse than owning a passive index fund.

Charts in the distribution phase are usually best avoided until there is some sign of accumulation. A higher low, a break above trendline resistance, a move above the 5-day moving average, an RSI reading above 60, and a reversal in the relative trend could all signal an exit from the dreaded distribution phase.

The Consolidation Phase: TSLA

Now we come to a group of stocks that are going neither higher nor lower but in a sideways direction. The market is telling us that the stock is fairly valued, and until some new catalyst comes into play, there is likely to be no real change in the picture.

Observe the pattern of lower highs and higher lows, often called a symmetrical triangle or “coil” pattern. The middle of this pattern is around $255 (which we call the “equilibrium price”), and basically the market is overshooting and undershooting this price level.

The two bottom panels show that the momentum is basically neutral, represented by an RSI reading right around 50. The relative strength line is flat, telling us that this stock is basically moving in line with the broader equity markets over the last three months. So we have an absence of strong momentum and as well as an absence of outperformance!

In some ways, this is the easiest phase to play, because at some point the coil pattern will be completed. If the price breaks above the upper boundary, that would indicate that buyers are taking control and are willing to pay more for the stock. If the price drops below the lower boundary, that would suggest that there is a lack of willing buyers or additional selling pressure. Usually, a stock breaking out the consolidation phase can soon be relabeled as an accumulation or distribution phase, based on the direction of the breakout.

If you’re considering a list of stocks or ETFs in your analysis, it may help to start by defining the phase of the charts. Gather the accumulation, distribution, and consolidation phases together, then drill down further into each bucket. By bringing this structure to our analytical approach, a mindful investor is able to focus in on the most actionable charts regardless of the broader market environment.

Want to digest this article in convenient video format? Head over to my YouTube Channel!

RR#6,

Dave

P.S. Ready to upgrade your investment process? Check out my free behavioral investing course!

David Keller, CMT

Chief Market Strategist

StockCharts.com

Disclaimer: This blog is for educational purposes only and should not be construed as financial advice. The ideas and strategies should never be used without first assessing your own personal and financial situation, or without consulting a financial professional.

The author does not have a position in mentioned securities at the time of publication. Any opinions expressed herein are solely those of the author and do not in any way represent the views or opinions of any other person or entity.

I spent all of last week, in the media and in print, going over the importance of 2 key indicators. (See the media clips below.)

Our risk gauges on Big View, all of which kept flashing risk-on regardless of the doom-and-gloom and initial selloff in bonds and SPY.The monthly charts on small caps and retail (IWM and XRT), both of which drew lines in the sand.

Although we have not changed our mind about the real possibility of stagflation as we head into 2024 (DBA and DBC 2 commodity ETFs continue to outperform the SPY), this clutch rally on Friday, in the face of a strong employment report, was not unexpected.

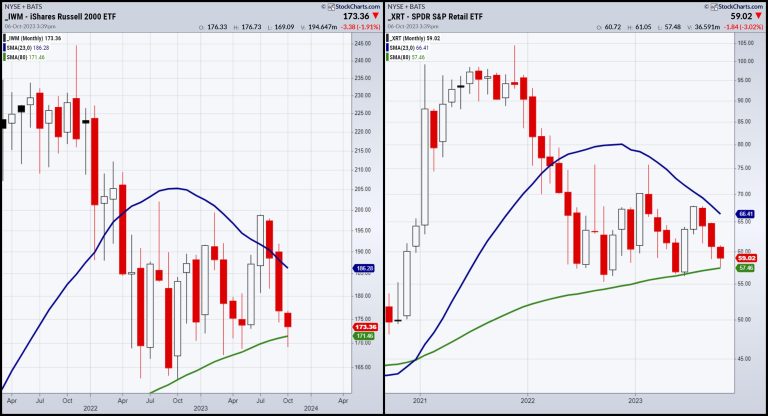
Last week, we wrote this: “Now, along with Retail XRT, both IWM and XRT-Granddad and Grandma of the Economic Modern Family-have a new story to tell. The 80-month moving average (green line) is a longer-term business cycle or about 6-7 years. Besides the blip during COVID, IWM has not broke that 80-month MA since 2010. XRT sits right above the 80-month.”

The day prior, on the risk gauges we wrote this: “If you are finding yourself fluctuating between bullishness and bearishness, then congratulations! Hopefully, that also means you are waiting for certain signals to help you commit to one way or another. Here are the signals we are waiting for before overly committing to a bias:

As we wrote over the weekend, how the junk bonds (high yield high debt bonds), do independently, and how they perform against the long bonds (TLT).How the retail and transportation sectors do (along with small caps) as they represent the “inside” of the US economy.How DBA (ags) and DBC (commodity index) do relative to the strong dollar and higher yields.”

If you combine the rally on Friday, with the notion that our risk gauges stayed positive, the bigger question now is… what’s next?

Recession, to us, will be represented by a break of the 80-month moving average in either IWM or XRT and stronger if in both. And, as much as we all love the save on Friday, the TLT closed down again, or bond yields rose. Small-caps (IWM) still closed down for the week as did Retail (XRT). SPY and NASDAQ QQQ, however, closed the week higher.

Can that help keep the small caps and retail from failing the 80-month moving average? Maybe. DBA closed unchanged. DBC closed much lower because of the drop in oil prices. Commodities remain elevated regardless.

So the big questions for this week are:

Can growth stocks boost the small caps, or will small caps drag everything down again?Can the risk gauges stay risk on, especially if bonds reverse at all and SPY begins to underperform? Can junk bonds continue to hold and outperform the long bonds?

We would like to see IWM get back over 177 and Retail get back over 61.00. Otherwise, the first question will most likely be answered by no, this rally cannot sustain.

It seems the market took the jobs report as a peak in employment for 2023. It also seems that the bond market did not take it that way.

We are still at a precipice. Bulls need to see the bond market steady and small caps improve. The bears need to see higher for longer and small caps fail the 6–7-year business cycle. Commodities traders need to see oil rebound, natural gas continue the rally, DBA grow some more green shoots, dollar to fail 106 and yields to at least, not go up any further from here.

This is for educational purposes only. Trading comes with risk.

For more detailed trading information about our blended models, tools and trader education courses, contact Rob Quinn, our Chief Strategy Consultant, to learn more.

If you find it difficult to execute the MarketGauge strategies or would like to explore how we can do it for you, please email Ben Scheibe at Benny@MGAMLLC.com.

“I grew my money tree and so can you!” – Mish Schneider

Get your copy of Plant Your Money Tree: A Guide to Growing Your Wealth and a special bonus here.

Follow Mish on Twitter @marketminute for stock picks and more. Follow Mish on Instagram (mishschneider) for daily morning videos. To see updated media clips, click here.

Mish in the Media

To quote Al Mendez, “The smartest woman in Business Analysis @marketminute [Mish] impresses Charles with her “deep dive” to interpret the present Market direction.” See Mish’s appearance on Fox Business’ Making Money with Charles Payne here!

Mish covers bonds, small caps, transports and commodities-dues for the next moves in this video from Yahoo! Finance.

In this video from Real Vision, Mish joins Maggie Lake to share what her framework suggests about junk bonds and investment-grade bonds, what she’s watching in commodity markets, and how to structure a portfolio to navigate both bull and bear markets.

Mish was interviewed by Kitco News for the article “This Could Be the Last Gasp of the Bond Market Selloff, Which Will be Bullish for Gold Prices”, available to read here.

Mish presents a warning in this appearance on BNN Bloomberg’s Opening Bell — before loading up seasonality trades or growth stocks, watch the “inside” sectors of the US economy.

Watch Mish and Nicole Petallides discuss how pros and cons working in tandem, plus why commodities are still a thing, in this video from Schwab.

Mish talks TSLA in this video from Business First AM.

See Mish argue investors could jump into mega-tech over value and explain why she is keeping an eye on WTI prices on BNN Bloomberg’s Opening Bell.

Even as markets crumble, there are yet market opportunities to be found, as Mish discusses on Business First AM here.

Mish explains how she’s preparing for the next move in Equities and Commodities in this video with Benzinga’s team.

Mish shares why the most important ETFs to watch are Retailers (XRT) and Small Caps (IWM) in this appearance on the Thursday, September 20 edition of StockCharts TV’s The Final Bar with David Keller, and also explains MarketGauge’s latest plugin on the StockCharts ACP platform. Mish’s interview begins at 19:53.

Mish talks Coinbase in this video from Business First AM!

Mish looks at some sectors from the economic family, oil, and risk in this appearance on Yahoo Finance!

As the stock market tries to shake off a slow summer, Mish joins Investing with IBD to explain how she avoids analysis paralysis using the six market phases and the economic modern family. This edition of the podcast takes a look at the warnings, the pockets of strength, and how to see the bigger picture.

Coming Up:

October 12: Dale Pinkert, F.A.C.E.

October 26: Schwab and Yahoo! Finance at the NYSE

October 27: Live in-studio with Charles Payne, Fox Business

October 29-31: The Money Show

Weekly: Business First AM, CMC Markets

ETF Summary

S&P 500 (SPY): There are multiple timeframe support levels round 420-415.Russell 2000 (IWM): 170 area huge.Dow (DIA): 334 pivotal.Nasdaq (QQQ): 330 possible if can’t hold above 365.Regional Banks (KRE): 39.80 the July calendar range low.Semiconductors (SMH): 133 the 200-DMA with 147 pivotal resistance.Transportation (IYT): 237 resistance, 225 support.Biotechnology (IBB): 120-125 range.Retail (XRT): 57 key support; if can climb over 61, get bullish.

Mish Schneider

MarketGauge.com

Director of Trading Research and Education

In this episode of StockCharts TV‘s The MEM Edge, Mary Ellen reviews the bullish bias that’s shaping up in the markets as high-growth areas begin to turn positive. She also provides insights into what’s driving this price action, as well as what to be on the lookout for going into next week.

This video originally premiered October 6, 2023. Click on the above image to watch on our dedicated MEM Edge page on StockCharts TV, or click this link to watch on YouTube.

New episodes of The MEM Edge premiere weekly on Fridays. You can view all previously recorded episodes at this link. You can also receive a 4-week free trial of her MEM Edge Report by clicking the image below.

In this special edition of StockCharts TV‘s The Final Bar, Dave breaks down the crucial charts shaping October 2023’s financial landscape.

This video originally premiered on October 6, 2023. Watch on our dedicated Final Bar page on StockCharts TV, or click this link to watch on YouTube.

New episodes of The Final Bar premiere every weekday afternoon LIVE at 4pm ET. You can view all previously recorded episodes at this link.

September’s strong labor market—336,000 jobs added—initially shocked investors. Treasury yields and the US Dollar Index ($USD) spiked higher, while equity futures dropped.

But a comeback attempt was in play. During the trading day, Treasury yields came off their highs, and the stock market came off its lows, closing positively. Investors weren’t panicked, as is evident in the CBOE Volatility Index ($VIX), which remained below 20.

Does a strong close in the major indexes mean the market has turned around? One day doesn’t make a trend, so we’re not out of the woods yet. But it’s an encouraging sign.

S&P 500 Close to Key Support

Keep an eye on the 4200 level in the S&P 500 index ($SPX). Before today, there was an obvious sideways movement going on just above the support of the 200-day moving average. The S&P 500 was also close to the first Fibonacci retracement level (from October 2022 lows to July 2023 highs).

CHART 1: S&P 500 INDEX BOUNCING OFF 200-DAY MOVING AVERAGE? One day doesn’t make a trend but the signs are encouraging. Chart source: StockCharts.com. For educational purposes.

Today’s price action was unexpected but shows how quickly the market can react. The S&P 500 moved away from its 200-day moving average and closed higher by over 1%. But that’s just a single day, and we still need to see higher highs and higher lows to be confident that the market has reversed. So, to protect your portfolio, it’s a good idea to analyze what could happen if the S&P 500 quickly moves lower in the next few trading days.

If the S&P 500 breaks below the 4200 level, it could fall much lower. That’s because, overall, the index is in a downtrend. Note the series of lower highs and lower lows. On the flip side, if the 4200 level holds and the index reverses and resumes its uptrend, there’s a chance it could hit its 50-day moving average and possibly hit the 4600 level it reached in July. But it’s still a way away from hitting that level. The index is much closer to its 4200 level support, and that’s where your focus should be. Since the overall trend is bearish, you’re better off being cautious.

Market Breadth: A More Accurate Barometer

Identifying market reversals can be tricky. When conditions are bearish, it’s best to adopt a wait-and-see approach. There are several indicators you can use to identify if the stock market has bottomed. One that can be effective is the Bullish Percent Index (BPI), which gives you some idea of the internal health of an index, sector, or industry group.

Starting with the S&P 500 BPI, you can see from the chart below that the indicator is below the 30 level, generally considered oversold. In the past year, there were two other times when the indicator dipped below 30—October 2022 and March 2023. Both these times, the S&P 500 fell to significant lows. Notice that the Bullish Percent Index turned relatively quickly, and when the indicator crossed above the 30 level, the S&P 500 went through a bullish rally.

S&P 500 BULLISH PERCENT INDEX IS STILL SHOWING A BEARISH SIGNAL. When the S&P 500 BPI turns and closes above the 30 level there’s a better chance that a reversal is in play. Chart source: StockCharts.com. For educational purposes.

It’s also worth looking at the BPI for some of the major indexes and sectors. Fortunately, StockCharts includes predefined CandleGlance charts, which can help you identify areas of the market that are gaining strength. Looking at the charts, Technology and Communication Services are the stronger sectors. And if you look at the Nasdaq BPI and the Nasdaq 100 BPI, you’ll see that they haven’t crossed below 30. So, assuming conditions don’t change drastically, these areas of the market are likely to lead the rally. That’s not surprising, given that’s been the narrative since the AI boom started.

A Surprising Sector Find

One point to keep in mind is the number of stocks that comprise the index or sector can impact how much the BPI moves. For example, the Dow Jones Industrial Average ($INDU) is made up of 30 stocks, while the S&P 500 has 500 stocks. So the DJIA BPI will visit oversold and overbought levels less frequently than the SPX BPI, and you might find some surprises.

For example, the action in the Financial BPI (see chart below) will make you take a second look. For a sector that got hit hard, it was surprising to find the indicator bouncing off its 50 level. It may be worth bringing up a chart of the Financial Select Sector SPDR Fund (XLF). The ETF is in a downtrend, is well below its 200-day moving average, and is underperforming the S&P 500. But there’s one encouraging sign: its StockCharts Technical Rank (SCTR) score is crossing 70.

CHART 3: S&P FINANCIAL SECTOR BULLISH PERCENT INDEX. The financial sector looks like it’s bouncing off its 50 level. Does this mean it’s a good time to load up on beaten-down financial stocks? One day’s spike isn’t convincing enough but keep an eye on this indicator. A follow-through to the upside could mean financial stocks may rally soon. Chart source: StockCharts.com. For educational purposes.

Final Thoughts

So, with a BPI bouncing off 50 and a SCTR score crossing 70, is it possible that something is brewing in the Financial sector? Well, the big banks kick off earnings season next week. And Q3 earnings reports could be the catalyst that brings life to the equity market.

Lots of things that could be critical are happening next week in the stock market. Don’t stray too far from what’s going on.

Stock Market Wrap-Up

US equity indexes up; volatility down

$SPX up 1.18% at 4308.50, $INDU up 0.87% at 33407.58; $COMPQ up 1.6% at 13431.34$VIX down 5.62% at 17.45Best performing sector for the week: TechnologyWorst performing sector for the week: EnergyTop 5 Large Cap SCTR stocks: Vertiv Holdings, LLC (VRT); Super Micro Computer, Inc. (SMCI); Applovin Corp. (APP); Palantir Technologies (PLTR); Splunk Inc. (SPLK)

On the Radar Next Week

Earnings Season kicks off with PepsiCo Inc. (PEP), Delta Airlines Inc. (DAL), Citigroup Inc. (C), and J.P. Morgan Chase & Co. (JPM), Wells Fargo & Co. (WFC)September PPI September CPIFed speeches

Disclaimer: This blog is for educational purposes only and should not be construed as financial advice. The ideas and strategies should never be used without first assessing your own personal and financial situation, or without consulting a financial professional.

From a bullish perspective, I was hoping to see the “goldilocks” jobs report, one which still showed job growth, but came in below consensus estimates. The thought there is that the Fed would see that its rate-hiking campaign was working and the economy was slowing. Instead, we saw a much-larger-than-expected jobs number, 336,000 vs. 160,000. Immediately, futures fell from positive to negative, and we’ll likely be experiencing price action today that tests, if not pierces, recent price lows across our major indices.

But were there any silver linings? Well, actually yes. The obvious is that our economy remains resilient, keeping alive the possibility of a soft landing. A big decrease in jobs and a negative number might have altered that potential outcome. Second, the unemployment rate was expected to drop from 3.8% to 3.7%, but instead remained at 3.8%. Also, average hourly earnings, which is watched by the Fed for further pressure from wage inflation, remained unchanged from the prior month at +0.2%, lower than the +0.3% rise that was forecast.

So while the headline jobs number may have spooked bond investors initially, it’ll be interesting to see the reaction as the rest of the day unfolds and, of course, next week. The September PPI and CPI will be released next Wednesday and Thursday, October 11th and 12th, respectively.

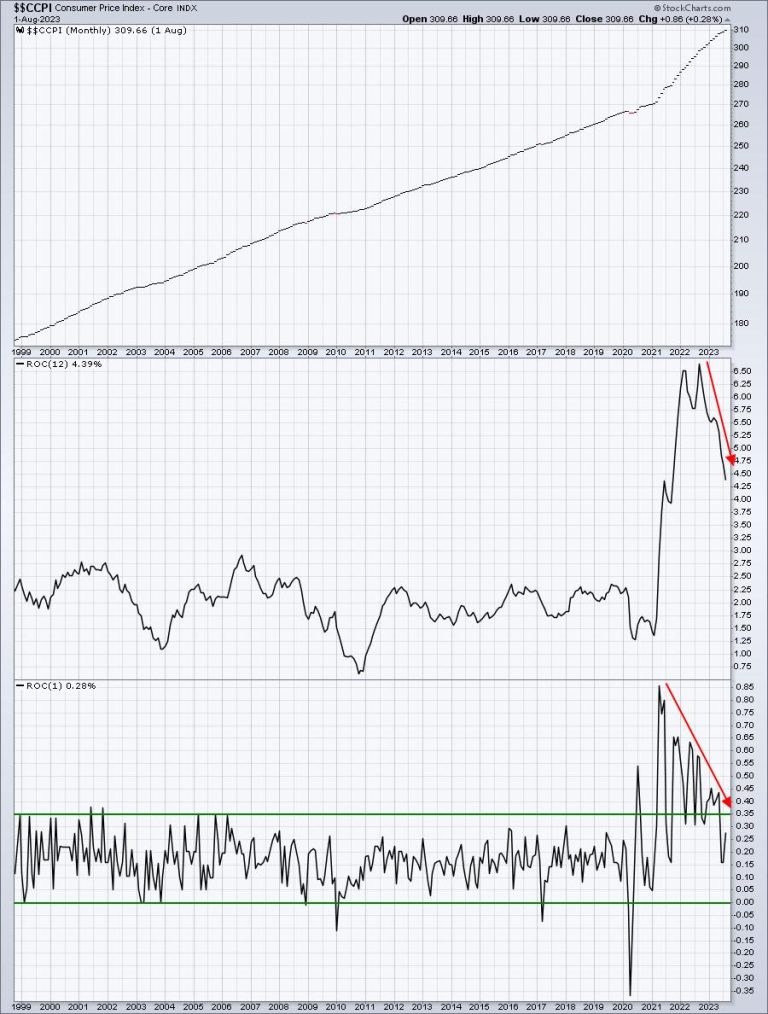
The monthly core CPI is what we should watch most closely and here’s a chart that shows the direction it’s been heading:

Remember, not too long ago, Fed Chief Powell said that the Fed wanted to see a consistent move lower towards its 2% target. Are you reading the above chart differently than me? Not only have we seen the annual core rate of inflation fall from 6.7% to 4.4% in one year, but we’ve also seen the monthly change fall all the way back into its 21st century “normal” range. I can’t help but believe that if next week’s September Core CPI reading comes in at or below 0.4%, we’ll see the start of a Q4 stock market rally, if it hasn’t already begun by then.

On Monday, in our FREE EB Digest newsletter, I’ll be highlighting a chart that says inflation is NOT a problem, despite what the Fed might suggest. If you’d like to see this chart and you’re not already an EB Digest free subscriber, simply CLICK HERE to enter your name and email address. There’s no credit card required and you may unsubscribe at any time.

Happy trading!

Tom

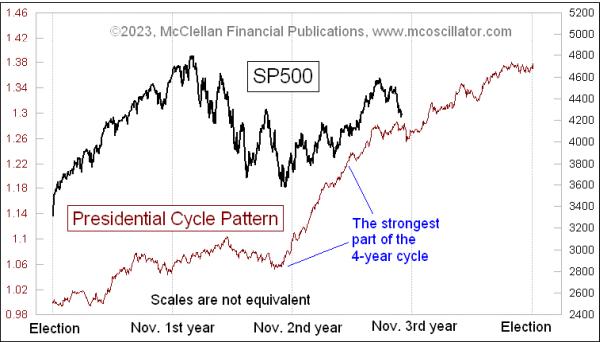
We are just about to wrap up the 3rd year of the current presidential term, and head into the 4th year, also known as election year. For the purposes of tabulating these years, I start them at the beginning of November instead of January, because the presidential and mid-term elections occur at the beginning of November, and their effect is felt immediately on the stock market rather than after inauguration.

The 3rd year has a long history of being an up year nearly every time. We have to go back to 1939, when the Wehrmacht was marching through Poland, to find an instance when that “rule” did not work. But even with the strong history of being an up year, the autumn of the 3rd year often sees stock prices stumble, or at least chop sideways. The current pullback in stock prices fits that model pretty nicely. 

Soon we will be in the 4th year, the election year, which is also an up year on average, although not nearly as strongly. And there is a lot more variability about whether election years are up years. 2008, for example, was a fairly ugly year for the stock market. 2000 was not much fun either, after the Internet Bubble collapse. 

Before we get to the bullish portion starting upward again, the Presidential Cycle Pattern (PCP) in this week’s chart says we still have a bit more sideways chopping to get through. But readers and chart analysts should not assume that the stock market will follow this pattern precisely, especially in October, because of one particular anomaly in the data.

October 1987 was in the 3rd year of President Reagan’s second term. That month saw an historic crash, when selling pressure overwhelmed the ability of the trading floor to handle orders, and of the quote system to provide accurate updates of what was happening. The quote system that fed the pricing on all of the new computerized quote systems was running as much as 90 minutes late. Because traders and investors did not know what was happening, many entered blind sell orders, adding further to the selloff.

That selloff still shows up in the data, even when we average together multiple prior 4-year terms to create the PCP. Here is a zoomed in chart:

The effects of the Oct. 19, 1987 crash serve to pull down the average, and depict a lower low in the PCP. This does not necessarily mean that prices will do that this time. After all, this is an average pattern, and roughly half of the prior periods were better than this, half worse. 

It is worth noting that in this current presidential term, the bullish portion of the 3rd year was a lot less robust than what the PCP shows. It was still up, though, so that particular message of the PCP worked great. But with the Fed hiking rates and pulling back all of the QE that was thrown at the banking system due to COVID, and hiking short-term rates, it is understandable that the magnitude of the market’s 3rd year performance has not quite been the same as other 4-year periods.

This does not take away at all from the usefulness of the PCP. It is, after all, just a depiction of what “average” is. When we use it, we should all understand that there will be variations from it. It is still a useful guide even with that limitation. And just ahead, it says that there should be a big swoop up in Q4 of 2023.

Elected in 1993 as a ‘mom in tennis shoes,’ Senate President Pro Tempore Patty Murray, D-Wash., has risen to be second in line for the presidency amid the House’s speaker battle.

After Kevin McCarthy, R-Calif., was ousted from the speakership on Tuesday, the job passed temporarily to House Speaker Pro Tempore Patrick McHenry, R-N.C.

Typically, the presidential line of succession goes from the vice president to the speaker of the House, then passes to the president pro tempore of the Senate before going down the list of Cabinet officials.

However, as the interim speaker, McHenry is not counted in the presidential line of succession – meaning the list moves up a spot for everyone on it.

Murray, as president pro tempore of the Senate, is currently second in line to take the presidential oath of office, if President Biden and Vice President Kamala Harris were unable to perform their duties.

Fox News Digital reached out to Murray’s office but did not receive a response.

‘Patty first got involved in politics to fight back against politicians who were trying to cut a preschool program that her kids counted on,’ the senator’s campaign website reads.

‘When one legislator told her that she couldn’t make a difference because she was ‘just a mom in tennis shoes,’ she realized that if she wanted change, she was going to have to lace up those tennis shoes and fight back,’ her website continues.

‘So she called other moms and dads, she organized rallies and phone banks, she fought, and she won,’ it reads.

Murray was chosen last year to be the Senate president pro tempore by Senate Majority Leader Chuck Schumer, D-N.Y., who skipped over Sen. Dianne Feinstein, D-Calif., for the role. 

The president pro tempore is a position laid out by the Constitution to chair the Senate when the vice president is not present. It’s a largely powerless office as Senate party leaders control legislative traffic on the floor.

The Presidential Succession Act, however, makes the president pro tempore third in the line of succession, following the vice president and House speaker.

Traditionally, the president pro tempore job goes to the most senior senator in the majority party.

On Tuesday, McCarthy was ousted as speaker with every Democrat in the chamber at the time, along with several Republicans led by Rep. Matt Gaetz of Florida. voting to remove.

Fox News Digital’s Caroline McKee and Tyler Olson contributed reporting.

This post appeared first on FOX NEWS

A group of Senate Republicans vowed to block non-spending-related bills in a letter sent to Sen. Majority leader Chuck Schumer, D-N.Y., on Wednesday, as the upper chamber breaks for a Columbus Day recess until next week. 

The upper chamber has until November 17 until the current Continuing Resolution (CR) expires, and Congress will need to come together again to agree on a government spending package for the next fiscal year. 

The senators fear that if the spending legislation gets put on the back burner behind other bills, Democrats in the upper chamber will try to jam through another omnibus spending package. 

‘Today, despite being past the September 30th deadline, with the Senate Appropriations Committee having already passed each of the 12 bills for our chamber, we have the best opportunity in decades to complete our work,’ Sen. Rick Scott, R-Fla., said in the letter.

Senate Whip John Thune, R-S.D., Sen. John Cornyn, R-Texas, Senate Republican Conference Chairman John Barrasso of Wyoming, Sen. Joni Ernst, R-Iowa, GOP Conference Vice Chairwoman Shelley Moore-Capito of West Virginia, Sen. Ted Cruz, R-Texas, and Sen. Tommy Tuberville, R-Ala., also signed the letter, among others. 

‘We urge you to present a plan to the Republican Conference for how you intend to pass the remaining appropriations bills and conference them with the House in a manner that respects an open amendment process and which does not end in a December omnibus spending package,’ the letter read.

‘For this reason, we the undersigned senators pledge to withhold our support for any vote to proceed to items unrelated to appropriations bills.’

The fiscal year ends at midnight on October 1. Had the Senate rejected the bill to extend funding past midnight, nonessential government programs would have paused, and thousands of federal employees would have been furloughed. The funding includes $16 billion in disaster relief but does not include additional aid to Ukraine.

‘If we don’t get the appropriations process going here, we’re just not going to get any of these bills done before the end of the year, and we’re gonna end up in a terrible position at the end of the year,’ Thune said during Tuesday’s press conference following the GOP conference’s weekly luncheon. ‘So, I hope Senator Schumer will make this the number-one priority, he’s got other things he wants to do, we shouldn’t be doing anything else right now but dealing with appropriations bills.’

This post appeared first on FOX NEWS