Archive

2023

Browsing

The markets started the week on a strong note with a rally, which was boosted by the release of dovish remarks from the Federal Reserve’s last meeting. A stronger-than-expected CPI report sparked an increase in interest rates, however, which pushed the markets lower. The selling picked up on Friday, with the Nasdaq losing 1.2% in a move that reversed its recent uptrend.

Large-cap growth stocks were hit the hardest, while small-cap stocks also took a step back with a pullback that puts these stocks back to their lows for the year. Seasonality is expected to improve next week; however, earnings season is due to pick up as well. If last week’s earnings reports among big banks are any indication, we may be in for a tough ride.

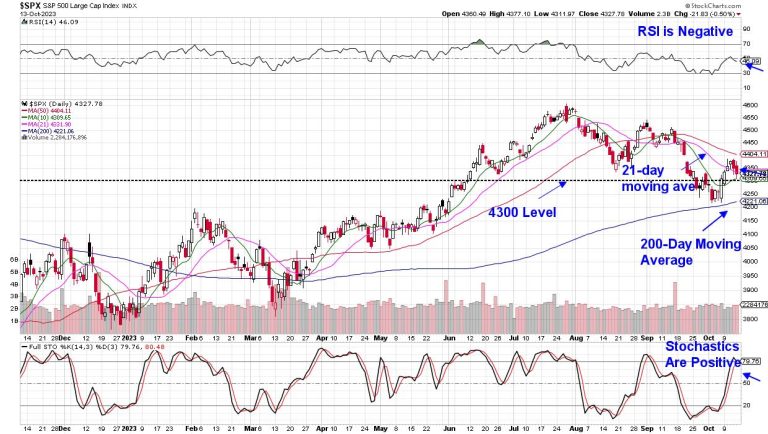
DAILY CHART OF S&P 500 INDEX

The Technology sector remains in an uptrend, however, as do most of the Magnificent Seven stocks, which led the markets higher earlier this year. At this time, the S&P 500 and Nasdaq need to regain their 50-day moving averages amid a period of improving breadth in order for investor confidence to resume. In the meantime, you’ll want to put together a watchlist so that you’ll be prepared for the new uptrend. Be sure and focus on stocks that are holding up well, as these relative outperformers will often go on to lead once market pressures lift.

Should we see further deterioration, you’ll want to pay attention to key areas of support, such as the 4300 level on the S&P 500 chart above. A break below this level will put the 200-day moving average into focus and a close below this key moving average would be quite negative for the markets. Investors will also want to pay close attention to other metrics, such as interest rates, as well as investors response to earnings reports. Both items are highly impactful to price action in the markets.

At this time, we’re in a wait-and-see period for the markets, which now have a negative bias. If you’d like to be alerted to any shifts in my market outlook, be sure and take advantage of my 4-week trial at a nominal fee. My twice-weekly MEM Edge Report has been helping investors navigate these tricky periods this year, and you’ll want to make sure you’re in the correct stocks once these markets turn. Be sure and use this link here!

Warmly,

Mary Ellen McGonagle

Editor, MEM Edge Report

Prices at the pump remain on track to keep falling in the United States despite the Israel-Hamas war, according to energy industry analysts.

After Hamas’ surprise attack over the weekend, global crude oil jumped to more than $87 a barrel by Monday, from below $83 late last week — roughly a 5% increase. Prices have since retreated, clocking in at $83.62 Wednesday morning.

But Israel and its immediate neighbors aren’t major energy producers, so as long as the conflict doesn’t expand geographically, seasonal trends should continue much as they have for the last few weeks, said Tom Kloza, global head of energy analysis at the Oil Price Information Service.

“On balance, we’re looking at gasoline prices dropping in all 50 states,” he said.

A gallon of regular gas cost $3.66 on average in the U.S. as of Wednesday, according to AAA, down from $3.83 a month ago. Prices at gas stations are falling as Americans wrap up their summer travel and as refineries switch to their winter fuel blend, which is cheaper and easier to produce.

In a note Monday, GasBuddy analyst Patrick De Haan described the initial spike in crude oil prices as a temporary “knee-jerk reaction,” adding that he sees a “very very low risk” of U.S. gas prices rising.

However, Kloza warned, “If you wake up and the theater of war has been expanded to Iran, that changes the calculus.” Tehran has long funded the military wing of Hamas, and U.S. officials are currently investigating whether Hamas fighters received any advance training from Iran’s Islamic Revolutionary Guard Corps.

The winter fuel mix is rolling out at a pace that should allow gas prices to continue falling through the next few weeks, Kloza said, estimating that prices at the pump could drop by as much as 2 cents a gallon each day. That would leave a gallon of regular costing an average $3.25 by Halloween.

The conflict has already affected the operations of producers of other types of energy, including natural gas.

Israeli officials this week ordered the shutdown of the Tamar offshore gas platform, a major Chevron-operated facility off the coast of Gaza. But analysts so far don’t foresee broader disruptions in global supplies, and natural gas prices have been dropping as well.

Most U.S. households are set to spend less to heat their homes this winter, the Energy Information Administration said Wednesday in its latest seasonal forecast, in part because this winter is expected to be warmer than last. The EIA projected the biggest price drops in natural gas costs — with consumer bills for the fuel set to shrink by 21% on average.

Still, crude oil prices on international commodities markets have been volatile lately as traders weighed the violence in the Middle East. That’s partly due to potential uncertainty around shipping routes through which oil produced elsewhere in the region gets to markets around the world.

“A wider conflict including Iran may impact the oil trade through the Strait of Hormuz, a channel Iran has previously threatened to shut,” Deutsche Bank analysts wrote on Tuesday.

Five of the top 10 largest oil producers — Kuwait, Saudi Arabia, Iran, Iraq and the United Arab Emirates — use that waterway, which connects the Persian Gulf to the Arabian Sea, to move about a fifth of the world’s crude oil supply, according EIA data.

But even if Iran were to choke off exports through the strait, the U.S. would have the capacity to lean on its own domestic production, analysts said. U.S. crude oil exports reached a record high in the first half of 2023, extending America’s lead as the largest oil producer in the world, a title it claimed in 2018.

“Oil hates turmoil,” De Haan said in his note, “but if the violence does not spill over into other areas, it should not worsen.”

This post appeared first on NBC NEWS

Caroline Ellison, who led the digital currency hedge fund connected with Sam Bankman-Fried’s FTX, is continuing her testimony in his criminal trial Wednesday.

Ellison, who is also Bankman-Fried’s ex-girlfriend, is considered the star witness in the prosecution’s case. Bankman-Fried faces seven federal charges, including wire fraud, securities fraud and money laundering in connection with his oversight of the now-defunct FTX and Alameda Research, both of which filed for bankruptcy last year.

He has pleaded not guilty to all of the charges. His defense attorneys began cross-examining Ellison late Wednesday afternoon and will continue Thursday.

In less than a year, Bankman-Fried, 31, has gone from a crypto titan and a rising global player with a net worth estimated at $16 billion to a defendant whose closest associates are testifying against him in a case that could put him in prison for decades.

Ellison is at the center of that. On Tuesday, she testified that Bankman-Fried told her to steal some $10 billion from FTX’s customers and use it to repay firms that had lent money to Alameda Research, the crypto trading firm she was leading.

‘Sam directed me to commit these crimes,’ Ellison said in court Tuesday after she told prosecutors that she, Bankman-Fried and others had committed fraud.

She also said that Bankman-Fried set up the system that let her move the money.

Ellison started at Alameda as a trader in 2018. She testified that after the hedge fund suffered large losses that year, Bankman-Fried made getting more money a top priority. To that end, he told Alameda employees to get loans on any terms they could.

That was risky, because lenders could call those loans in at any time. Ellison said there were enough of them to bankrupt Alameda if the loans all became due and payable immediately.

She said Bankman-Fried also tried to strengthen the firms by creating the digital token FTT. She said Alameda owned 60-70% of the supply of the coin, which cost essentially nothing to make. When its market price rose from an initial 10 cents to $50 over time, Alameda gained billions on paper.

Ellison is testifying under a deal with the government after she pleaded guilty to a series of fraud charges and conspiracy to commit money laundering. FTX co-founder Gary Wang also testified against Bankman-Fried this week after pleading guilty to fraud charges. Both are hoping to get their eventual sentences reduced.

Former FTX technology head Nishad Singh also pleaded guilty to fraud charges related to the implosion of FTX and Alameda.

‘A constant state of dread’

In 2021, Ellison became Alameda’s co-CEO, and later became sole CEO. However, prosecutors say Bankman-Fried was calling the shots. Bankman-Fried’s lawyers have argued that Ellison was fully responsible and that she mismanaged the company, including by failing to make protective hedge trades that could have reduced the risk of big losses.

Ellison testified that Bankman-Fried told her to put the growing value of the FTT tokens on Alameda’s balance sheet so it could borrow money. She said she felt that was misleading, but that he persuaded her to proceed.

Alameda later did the same with other coins that gained a great deal of value because of Bankman-Fried’s involvement with them.

When her testimony continued Wednesday, Ellison told prosecutors about events in June 2022, when several crypto firms and exchanges failed and investors collectively pulled about $1 trillion out of the market.

Some of Alameda’s lenders were asking for their loans to be repaid, as she feared they would. Ellison testified that she knew the only way to repay them was to take money from FTX customers.

She said Bankman-Fried told her to do just that, and that he knew the money was secretly being taken from those customers.

Ellison told the court that when a major lender — financial services firm Genesis — asked to see an updated Alameda balance sheet, she, Bankman-Fried, Wang and Singh brainstormed ways to make the company’s financial position look stronger so that Genesis wouldn’t ask for more money back.

They prepared a variety of different balance sheets to show Genesis, she said, testifying that she ‘was in a constant state of dread’ at this time. Bankman-Fried chose a balance sheet that hid the fact that Alameda was taking some $10 billion from FTX’s users. 

By October, she said, Alameda had taken $14 billion to $15 billion from FTX’s users, and Bankman-Fried was trying to raise money to fill that hole.

Things fell apart in early November, after one of the doctored balance sheets was leaked to CoinDesk. Even though the document made Alameda’s situation look better than it really was, it worried investors, who saw that much of the firm’s balance sheet was made up of the FTT token.

The rival exchange Binance soon announced it would dump its FTT holdings, which caused the price to crash and made Alameda’s situation much worse.

The firm managed to briefly prop it up with more customer assets, but that soon failed.

Ellison told the court that Bankman-Fried warned her and others to be wary about how they communicate with one another and to set their private chats to auto-delete, but she turned off that feature a few days after the news broke.

The government showed the jury messages in which she told Bankman-Fried that she was relieved.

‘I think I just had an increasing dread of this day that was weighing on me for a long time and now that it’s actually happening it just feels great to get it over with one way or another,’ she wrote.

Ellison cried after the messages were shared in court.

There was a brief reprieve when Binance agreed to buy FTX, but the deal fell apart. FTX and Alameda sought bankruptcy protection two days after that.

Criminal charges were filed against Bankman-Fried, Ellison, Wang and Singh a few weeks later.

Bankman-Fried faces a separate trial in March over additional charges, including accusations of bribing foreign officials. Ellison testified that Alameda paid a large bribe to Chinese officials to get them to unfreeze about $1 billion on Chinese cryptocurrency exchanges.

Bankman-Fried has also pleaded not guilty to those charges.

This post appeared first on NBC NEWS

On this week’s edition of StockCharts TV‘s StockCharts in Focus, Grayson explores the Seasonality tool and shares how these unique charts can help you gain a deeper, more data-driven perspective on the market’s latest moves. By charting historical price moves for each month of the year over a time period of your choosing, Seasonality Charts bring more historical context to your analysis. Use them for indexes, sectors, industry groups, or individual stocks and ETFs – if you can chart it, you can see the seasonality for it!

This video originally premiered on October 13, 2023. Click on the above image to watch on our dedicated StockCharts in Focus page on StockCharts TV, or click this link to watch on YouTube.

You can view all previously recorded episodes of StockCharts in Focus at this link.

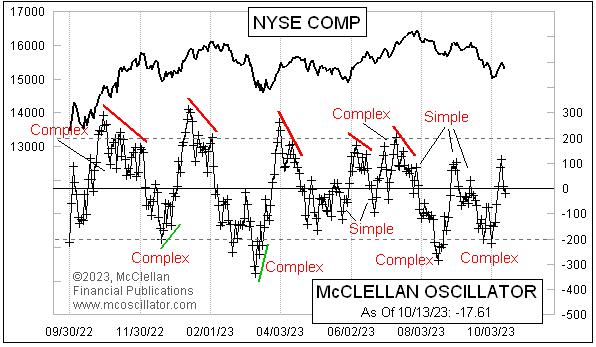
As we are looking for when the normal seasonal low is going to arrive, what we want to see is either a juicy oversold condition that one can buy into or a confirmation of a new uptrend getting started. Or both. We did not get as juicy of an oversold condition as I would have liked, but the stock market started up anyway, and even took the NYSE’s McClellan A-D Oscillator up above its zero neutral level.

Now, however, the Oscillator has fallen back down through zero as of Friday, Oct. 13, 2023, and the manner of this brief trip above zero has additional information for us to learn from.

At an elementary level, the Oscillator is bullish when it is above zero and bearish when below zero. And it can get to overbought and oversold extremes. At the next level of learning, we find that there is additional information available from the patterns that the Oscillator forms. And the simplest of these is to evaluate whether there is a “simple” or “complex” structure.

A complex structure is one that involves chopping up and down on one side of the zero line without crossing that line. Complex structures convey a message of strength for the side of zero on which they form. This can be bullish strength if above zero, or bearish strength if below. That message of strength remains in effect until either there is a divergence relative to prices or it gets refuted by a subsequent structure.

A simple structure sees the Oscillator move across zero and then back again, without building any complexity. A simple structure says that side is weak. Sometimes you can see alternating simple structures on both sides of zero, saying that neither side is in charge.

This latest trip above zero can now be declared to be a simple structure, now that the Oscillator has dropped back below the zero line. The message is that the initial attempt to start a bullish seasonal up move was perhaps started too early, before all the troops were in formation and ready to march. Seeing the structure above zero as a simple one does not necessarily mean that the bears are in control; it just means that the bulls are not, and the bears have a chance now to try their hand.

If we see the Oscillator jump back up above zero again soon, that would mean this dip below zero is a simple one, which cancels the message of the prior complex structure below zero. And that would be a moment to say that the bulls have a chance once again to see if they can get something started.

You can see a chart of the NYSE’s McClellan A-D Oscillator every day on our web site’s Market Breadth Data page. And if you want to learn more about what the Oscillator’s patterns can tell us, check out Sherman and Marian McClellan’s original book, Patterns For Profit, available in electronic form here.

In this episode of StockCharts TV‘s The MEM Edge, Mary Ellen shares where the market stands, after last week’s price action had select areas far outpacing the markets while others were weak. She also reviews the start of earnings season following reports from several high profile companies.

This video originally premiered October 13, 2023. Click on the above image to watch on our dedicated MEM Edge page on StockCharts TV, or click this link to watch on YouTube.

New episodes of The MEM Edge premiere weekly on Fridays. You can view all previously recorded episodes at this link. You can also receive a 4-week free trial of her MEM Edge Report by clicking the image below.

I have found that novice investors think of technical analysis as fairly homogeneous. At the end of the day, technical indicators are just basically analyzing price patterns, right?

Technical analysis is actually comprised of a fairly diverse set of tools to help investors understand investor sentiment by analyzing price and volume trends. While the common thread for technical analysis is a focus on the markets themselves (through price and volume) as opposed to factors that often influence market activity (for example, fundamental or macroeconomic analysis), it turns out that there are many different ways to quantify investor sentiment through charts.

In this article, we’ll talk about two main categories of technical indicators, how leading and lagging indicators represent different approaches to price analysis, and how we can apply these concepts to the current chart of Apple Inc. (AAPL).

Leading vs. Lagging Indicators

I like to classify technical indicators into general buckets: leading indicators, which are designed to anticipate a change in trend, and lagging indicators, which are more confirmational and tell you when a trend has actually reversed.

These two categories remind me of the broader labels of growth vs. value investing.  Growth investors tend to buy strong companies in the hope that they will continue to grow earnings over time. Value investors, on the other hand, tend to invest in companies trading for less than what they are worth based on some valuation assessment.

There isn’t necessarily a “right” or “wrong” way to invest, but there are different periods where growth or value approaches will tend to be more successful. The same can be said for the different types of technical indicators, and, for many investors, a balance of leading and lagging investors is probably the best approach.

I tend to favor lagging indicators in my own technical work, although I do employ some leading indicators as well. One indicator in particular, the Relative Strength Index (RSI), combines both leading and lagging capabilities to help define the trend and recognize trend shifts.

RSI as a Leading and Lagging Indicator

Toward the end of a bullish phase, the price will often continue higher, while a momentum indicator like RSI actually rotates lower. This indicates a lack of upside momentum and indicates that the uptrend may be nearing its end. This is where RSI can help anticipate potential turning points, as the signal occurs while the current trend is still in place.

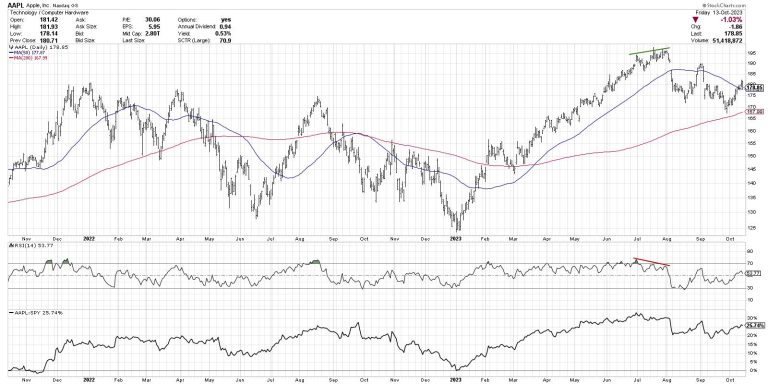
Let’s review the chart of Apple going into its July high.

Note the consistent uptrend that began in January, providing a sudden reversal from a bearish Q4 2022. When AAPL made another new high in late June, the RSI spiked up to almost 80. During subsequent price highs in mid- and late-July, the RSI peaked around 70 and 65, respectively.

This “bearish momentum divergence” suggested that while the price of Apple was still going higher, the bullish momentum propelling the price action was beginning to dissipate. Sure enough, AAPL gapped down below its 50-day moving average soon after, beginning a bearish phase that may still be in place today.

RSI can also be used as a lagging or trend-following indicator, designed more to validate a potential price reversal you’ve already observed. Notice how, during the first half of 2023, the RSI remained in the 40 to 80 range? This range is more characteristic of a bullish trend than a bearish trend.

Now look at how the entire range of the RSI pushed lower starting in August, with the RSI now rotating between 20 and 60. This shift to a more bearish range could have helped a savvy investor rotate to more defensive positioning.

Outlook for AAPL

Since the July peak, Apple has now entered a downtrend comprised of lower highs and lower lows. The RSI became oversold during the August low, but was not oversold at the September low. Now we are observing a bullish momentum divergence, providing a leading indicator of a potential change in trend.

Considering the weight of the evidence, I’m seeing the price in a clearly defined downtrend channel. The low in September came at a confluence of support, just above the 200-day moving average and right around the 38.2% Fibonacci level. Now the stock is giving a second attempt at pushing above the 50-day moving average, after an unsuccessful attempt in late August.

While the RSI divergence tells me to be ready for a reversal, the clearly defined downtrend in price on weak momentum compels me to remain on the sidelines. A break below that confluence of support around $168-170 would validate the bearish thesis and suggest further downside into year-end 2023. 

As a trend-follower, I have always felt that my main goals are threefold:

Define the trendFollow that trendAnticipate when the trend is exhausted

By combining both leading and lagging technical indicators into your toolkit, you will be best prepared for changing market environments and trend reversals!

RR#6,

Dave

P.S. Ready to upgrade your investment process? Check out my free behavioral investing course!

David Keller, CMT

Chief Market Strategist

StockCharts.com

Disclaimer: This blog is for educational purposes only and should not be construed as financial advice. The ideas and strategies should never be used without first assessing your own personal and financial situation, or without consulting a financial professional.

The author does not have a position in mentioned securities at the time of publication. Any opinions expressed herein are solely those of the author and do not in any way represent the views or opinions of any other person or entity.

It’s been a challenging week—geopolitical worries, no Speaker in the House of Representatives, hotter-than-expected inflation data—which means the stock market will likely continue its choppy movement. Now, the focus turns to earnings, with JP Morgan Chase (JPM), Citigroup (C), and Wells Fargo (WFC) all reporting better-than-expected figures.

Earnings season could keep the stock market smooth over the next few weeks, but it may end up being more distracting than anything else. Given the larger picture of global events, it’s best to tread carefully.

Broader Market Holds Support

When September, a seasonally weak period, came to an end, investors felt a sense of relief, since the worst month was over. It was a dismal month, but, despite the pullback, the broader indices are showing some signs of recovery. The S&P 500 ($SPX) held its 200-day moving average (MA) support. The Dow Jones Industrial Average ($INDU) fell below its 200-day MA and is battling to break above it. The Nasdaq Composite ($COMPQ) held up well above its 200-day MA. The chart below shows how the Nasdaq Composite bounced off its 38.2% Fibonacci retracement level and is now facing resistance from its 50-day MA.

CHART 1: THE 38.2% FIBONACCI RETRACEMENT IS THE SUPPORT LEVEL TO WATCH. The overall trend is still down but if the Nasdaq Composite bounces back and breaks above the downward-sloping trendline (red dashed line), it could be positive for stocks.Chart source: StockCharts.com. For educational purposes.

The series of lower highs and lower lows is still in play, indicating that the market is in a consolidation phase. That must change to higher highs and higher lows to confirm an uptrend. And given that the mega-cap tech stocks hold the line in the Nasdaq Composite, keeping a close watch on the index for any change in investor sentiment is a good idea.

Investors Aren’t Panicking Yet

Speaking of investor sentiment, given the rise in uncertainty, it’s not surprising to see the CBOE Volatility Index ($VIX) rising. The VIX, considered the market’s “fear gauge,” has been moving between 12 and 21 for the last few months, within a relatively normal range. Friday’s high got pretty close to the high of the range, but pulled back to close at 19.32. It’s nowhere close to its massive over-80 spike that occurred when the pandemic hit.

CHART 2: THE CBOE VOLATILITY INDEX ($VIX) IS STILL MEEK, RELATIVELY SPEAKING. Even though the VIX rose in today’s trading, it’s still not indicating panic among investors.Chart source: StockCharts.com. For educational purposes.

At the onset of the Ukraine-Russia conflict, VIX spiked to around 36, which is high, but relative to 80, it’s pretty tame. But that doesn’t mean all is complacent. If you see the VIX spike, it’s an indication that investors are starting to panic. Have a backup plan in case the stock market goes awry.

How Should You Prepare?

If the VIX shows signs of fear, look at how the “risk-off” sectors, such as Utilities, Consumer Staples, and Real Estate, perform. The type of stocks most exposed to geopolitical winds tends to do worse when volatility ticks up. These can include Industrials, Materials, Technology, and Financials.

When volatility spikes, investors also flee from stocks and into fixed income, gold, the US dollar, and cash. Gold futures rose above $1,900 per ounce on Friday (see chart below), but gold is still underperforming the S&P 500. Investors may gravitate toward gold ahead of the weekend in case tensions escalate. If this were to happen, it wouldn’t be surprising to see investors pile into the “risk off” areas.

CHART 3: GOLD PRICES SURGE. Investors likely fled to gold ahead of the weekend, in the event of escalation of geopolitical tensions. Chart source: StockCharts.com. For educational purposes.

That doesn’t mean you should rush to the “risk-off” type of investments immediately unless you’re a short-term trader who gets in and out of assets based on short-term price action. You’re better off letting the dust settle and seeing where things end up. So far, despite the selloff, the broader indexes are still holding on to support levels. There’s no need to panic just yet.

End-of-Week Wrap-Up

US equity indexes mixed; volatility up

$SPX down 0.5% at 4327.78, $INDU up 0.12% at 33670.29; $COMPQ down 1.23% at 13407.23$VIX up 15.76% at 19.32Best performing sector for the week: EnergyWorst performing sector for the week: Consumer DiscretionaryTop 5 Large Cap SCTR stocks: Vertiv Holdings, LLC (VRT); Super Micro Computer (SMCI); Applovin Corp. (APP); Plantir Technologies, Inc. (PLTR); Jabil, Inc. (JBL)

On the Radar Next Week

Earnings from Bank of America (BAC), Goldman Sachs Group, Inc. (GS), Johnson & Johnson (JNJ), Lockheed Martin Corp. (LMT), United Airlines (UAL), Netflix, Inc. (NFLX), Tesla, Inc. (TSLA), American Airlines Group (AAL), and many more.September retail salesFed speechesSeptember housing starts

The market followed the Moxie rules perfectly this week. The setup was there for our traders, and so we took advantage of the choppy down move over the last three days which were spurred on by some economic reports and worldly events. In this week’s edition of Moxie Indicator Minutes, TG notes that while he’s leaning to the upside next week, the market has to prove itself; he shows you what he wants to see.

This video was originally broadcast on October 13, 2023. Click this link to watch on YouTube.

New episodes of Moxie Indicator Minutes premiere weekly on Fridays. Archived episodes of the show are available at this link.

In this edition of StockCharts TV‘s The Final Bar, Dave tracks the rapid decline in growth sectors including Technology and Communication Services as defensive plays like utilities and gold post a strong finish to the week. Dave answers questions from The Final Bar Mailbag on the McClellan Summation Index and the best indicators to use for price reversals.

This video originally premiered on October 13, 2023. Watch on our dedicated Final Bar page on StockCharts TV, or click this link to watch on YouTube.

New episodes of The Final Bar premiere every weekday afternoon LIVE at 4pm ET. You can view all previously recorded episodes at this link.