Archive

2023

Browsing

EXCLUSIVE: The person arrested for trespassing on Robert F. Kennedy, Jr.’s property twice this week was listed in a Secret Service risk assessment as part of the candidate’s request for protection in June, Fox News Digital has learned.

Jonathan Macht was arrested Wednesday morning for trespassing on Kennedy’s property. Police transported Macht from Kennedy’s property, but he returned later in the day after he was released from custody and again attempted to enter the property. He was re-arrested.

Kennedy requested Secret Service protection twice, but has been rejected by the Department of Homeland Security (DHS) despite the Secret Service determining in June that he was at elevated ‘risk for adverse attention.’

The Secret Service risk assessment, which was eventually referred to the DHS, contains a section titled ‘behaviors of interest.’ 

A source familiar with the investigation told Fox News Digital that a redacted name in a section referring to an individual who ‘sent inappropriate communications to Kennedy’ refers to Macht. 

The Secret Service did not immediately respond to Fox News Digital’s request for comment. 

Kennedy, in an exclusive interview with Fox News Digital on Friday, said the individual who trespassed on his property ‘has written me 435 emails in a three-month period, including one last week, which was about me getting a bullet in my brain.’ 

Kennedy did not name the individual, but told Fox News Digital the person was ‘on a watch list, but there was no one here to watch out for him.’

‘If you read the Secret Service report about me, it says I am at an elevated risk,’ Kennedy said.

In its report earlier this year, the Secret Service stated: ‘Kennedy’s family history, perceived controversial stance on vaccines, and his status as a challenger to President Biden for the Democratic presidential nomination elevates his risk for adverse attention.’

Kennedy’s father, former Sen. Robert F. Kennedy of New York, and his uncle, former President John F. Kennedy, were both assassinated while in office.

But the independent presidential candidate said that he feels the Biden administration’s move to reject Secret Service protection for him was ‘clearly a political decision.’ 

‘The thing I worry most about is the politicization of our law enforcement agencies,’ Kennedy said. ‘It is disturbing — the apparent weaponization of the Secret Service while Biden provides protection to his family members and political allies.’

‘And then he denies it to political rivals,’ Kennedy said of Biden. ‘It is not good optics for the world of exemplary democracy.’

Kennedy told Fox News Digital that upon requesting Secret Service protection earlier this year, he felt ‘very encouraged.’

‘The Secret Service said yes, this is a no-brainer,’ Kennedy said, adding that Secret Service officials told him ‘it would move very quickly and our first interview would be in 14 days.’ 

‘But it went 88 days, and then we got a rejection letter from [DHS Secretary Alejandro] Mayorkas,’ he said.

Kennedy then described a separate situation in the weeks following that rejection of a gunman masquerading as a U.S. marshal trying to approach him in a green room. He told Fox News Digital that his team noticed that the individual’s badge was ‘shinier, and it tipped them off that it may not be right.’

Kennedy said his team discovered the individual was carrying ‘two shoulder holsters with loaded pistols and a backpack with additional magazines and a knife and a number of other weapons.’ 

After that incident, Kennedy’s team requested Secret Service protection a second time, but told Fox News Digital ‘they immediately denied it.’

The Secret Service does not determine who qualifies for protection. The agency is also not empowered to independently initiate candidate protection.

The process is initiated by a candidate running a national campaign. Once the request is made, the Secret Service does an internal risk assessment. In this case, the assessment concluded that Kennedy’s situation ‘elevates his risk for adverse attention.’

The report is then referred to the secretary of Homeland Security, who consults with a congressional advisory committee. That committee consists of the speaker of the House, House minority leader, Senate majority leader, Senate minority leader and an additional member of Congress selected by the others.

A source familiar with the process told Fox News Digital that the congressional advisory committee is briefed by the DHS and typically ‘defers to their judgment’ in an effort to ‘not get involved in security decisions.’

The final decision is made by the secretary of Homeland Security.

The DHS did not immediately respond to Fox News Digital’s request for comment.

The White House declined to comment on Kennedy’s claims that the president has weaponized law enforcement agencies.

According to the Secret Service’s website, protection under the guidelines ‘should only be granted within one year prior to the general election.’

‘Protection more than one year prior to the general election should only be granted in extraordinary, case by case circumstances in consultation with the committee, based on threat assessment and other factors,’ the guidelines state.

Meanwhile, Kennedy told Fox News Digital that death threats against him are ‘pretty regular.’

‘I worry about my family and their peace of mind,’ he said.

Get the latest updates from the 2024 campaign trail, exclusive interviews and more at our Fox News Digital election hub.

This post appeared first on FOX NEWS

If you’ve been fighting the mounting bearish evidence up until this week, then perhaps the distribution we’ve witnessed here in late October has been enough to convince you otherwise. It was easy for some to write off the negative rotation in key leadership groups, and maybe you flat-out ignored the head-and-shoulders top on the S&P 500 chart, but at this point, the weight of the evidence appears to have rotated clearly to the bearish side.

In a bullish phase, I like to think of the market as “innocent until proven guilty”. You assume that the uptrend of higher highs and higher lows will continue until some catalyst causes a change of character on the chart. In a bearish phase, stocks become “guilty until proven innocent”, and investing involves less of a “do I think the market will go lower” question and more of a “what would I need to see to turn bullish” discussion.

So what’s next for the S&P 500 now that we all agree that the market is guilty until proven innocent? Today, we’ll identify three potential downside targets for the S&P 500 chart using price patterns, Fibonacci retracements, and traditional support and resistance levels.

What is your downside objective for the S&P 500? Watch this, and then let me know!

Downside Target #1: SPX 4050

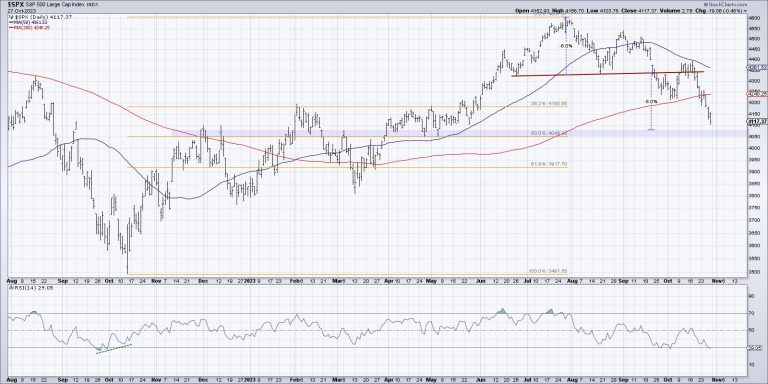
Now that the S&P 500 has broken below its 200-day moving average, what’s the next most obvious area for potential support? Let’s point out that when the SPX broke down through the 200-day, it also pushed below the first Fibonacci retracement level around 4180. This level represented a 38.2% drop from the July 2023 high down to the October 2022 low, and now it’s firmly in the rearview mirror.

Following this Fibonacci methodology, the 50% level would be next. That suggests 4050 as a reasonable downside target, which happens to be only about 70 points below Friday’s close!

Remember the head-and-shoulders top we mentioned earlier? The minimum downside objective for that classic price pattern would come in right around 4080, which means we have a “confluence of support” where multiple technical approaches all coalesce around the same level.

Downside Target #2: SPX 3920

What if the 4050 level doesn’t hold? In that case, we can follow this same Fibonacci progression and look further down to the 61.8% retracement level. This comes just below 3920 and would represent about a 15% drop in absolute terms from the July 2023 high.

The 61.8% retracement level often represents a “point of new return” level, as a break below would suggest a full retracement of the original move. That would mean a further drop to the October 2022 low around 3500. But given the fact that there is no other real support level around 3920, I’m inclined to consider this a secondary level for now.

Downside Target #3: SPX 3800

This brings up the most severe scenario, at least as severe as we’re able to consider at this particular juncture. What if 4050 and 3920 come and go, and the market is still in a decline? That’s when 3800 will become the new area of interest.

Given what I’ve seen so far from stocks, including bearish Dow Theory confirmation, breadth deterioration, and just plain old price declines, I’m fairly confident that 3800 is a reasonable downside objective. This would take us down almost 18% down from the July 2023 high, and about 21% off of all-time highs in January 2022.

You’ll see how 3800 lines up pretty well with the major lows in March 2023 and December 2022, but you may also notice the purple dashed line around 3815. This line shows a 38.2% retracement from the January 2022 high back down to the COVID low in March 2020. That’s why SPX 3800 has been on our radar for quite some time, and why we feel a remarkable symmetry would come to pass with an S&P 500 drop back to this same 3800 level.

Mindful investors know that improving your situational awareness involves a consistent process of analyzing both leading and lagging indicators to anticipate, identify, and confirm turning points. By focusing in on the downside targets we’ve discussed here, you may just find that the equity markets are starting to actually make sense here in late 2023!

RR#6,

Dave

P.S. Ready to upgrade your investment process? Check out my free behavioral investing course!

David Keller, CMT

Chief Market Strategist

StockCharts.com

Disclaimer: This blog is for educational purposes only and should not be construed as financial advice. The ideas and strategies should never be used without first assessing your own personal and financial situation, or without consulting a financial professional.

The author does not have a position in mentioned securities at the time of publication. Any opinions expressed herein are solely those of the author and do not in any way represent the views or opinions of any other person or entity.

In this episode of StockCharts TV‘s The MEM Edge, Mary Ellen reviews last week’s negative price action in the markets while sharing key areas of possible support for the Nasdaq and S&P 500. She also highlights the relative strength in defensive areas of the market and whether these stocks can be bought.

This video originally premiered October 27, 2023. Click on the above image to watch on our dedicated MEM Edge page on StockCharts TV, or click this link to watch on YouTube.

New episodes of The MEM Edge premiere weekly on Fridays. You can view all previously recorded episodes at this link. You can also receive a 4-week free trial of her MEM Edge Report by clicking the image below.

In this edition of the GoNoGo Charts show, with US Equities delivering a streak of daily gains this week, Alex takes a top down approach to see what the GoNoGo Charts are saying about markets. With U.S. domestic equities in a “NoGo” trend, the charts warn that there is further risk to the downside. This week, we see a new lower low, and momentum has turned strongly negative. Looking at the macro factors that could cause further trouble, treasury rates and the dollar are both in strong “Go” trends.

This video originally premiered on October 27, 2023. Click this link to watch on YouTube.

Learn more about the GoNoGo ACP plug-in with the FREE starter plug-in or the full featured plug-in pack.

In this edition of StockCharts TV‘s The Final Bar, host Dave wraps a bearish week with a discussion on downtrend conditions, trendline resistance, deteriorating breadth, and finding opportunities in a bearish landscape. He answers viewer questions on inverted yield curves, recessionary periods, and leading vs. lagging technical indicators.

This video originally premiered on October 27, 2023. Watch on our dedicated Final Bar page on StockCharts TV, or click this link to watch on YouTube.

New episodes of The Final Bar premiere every weekday afternoon LIVE at 4pm ET. You can view all previously recorded episodes at this link.

On this week’s edition of StockCharts TV‘s StockCharts in Focus, Grayson gives viewers 29 of the most important charts straight out of his own personal account. He’ll review his weekly “Market Evaluation” ChartList and discuss all of the advanced charts within. This entire list can be installed directly into your StockCharts account using the link below, and you can bring Grayson’s favorite ChartList right into your own process.

This video originally premiered on October 27, 2023. Click on the above image to watch on our dedicated StockCharts in Focus page on StockCharts TV, or click this link to watch on YouTube.

You can view all previously recorded episodes of StockCharts in Focus at this link.

SPY:IEF completes top formation

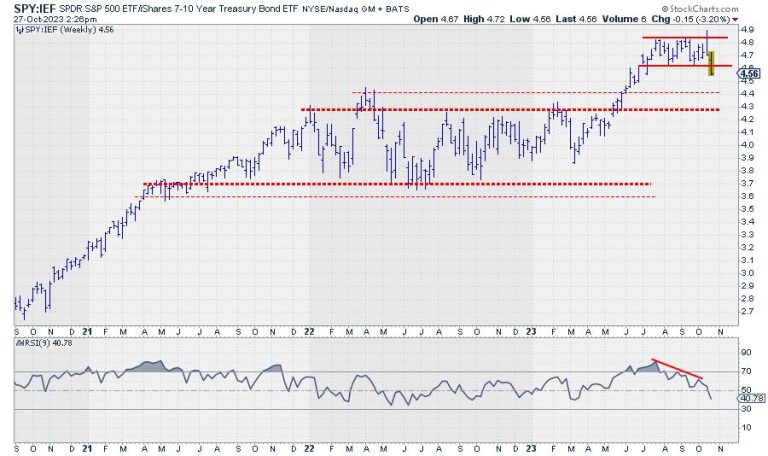
One of the metrics I keep a close eye on is the ratio between stocks and bonds. Most of the time, I use SPY:IEF. (SPY, obviously, is the ETF that tracks the S&P 500 stock index, while IEF is the ETF that tracks the prices of US Government bonds with a maturity between 7-10 years.) In Sector Spotlight, I address that ratio on a regular basis when we talk about rotations in asset classes. When the ratio moves up, stocks are outperforming bonds, and vice versa. When the ratio moves down, bonds are outperforming stocks.

Looking at the chart above, the uptrend starting in March took the ratio from below 4 to the area between 4.8 and 4.9. This level was reached for the first time in July, after which SPY:IEF started to trade in a sideways range, between 4.85 at the top and 4.6 at the lower end.

Last week, the market took out the lower boundary of that range, completing a top formation. This means that the powers of supply and demand have now shifted in favor of Bonds. Just like the analysis of a regular price chart, we can apply essential technical analysis tools to these ratio charts.

As a first potential target, the area between 4.3 and 4.4 shows up. The level of major peaks formed in 2022. The upside is now expected to be kept at the breakout level, i.e., 4.6. So, the upside potential is now much less than the downside risk.

Weekly RRG

On the weekly RRG, SPY is rotating through the weakening quadrant and heading towards lagging, while IEF is inside the improving quadrant and heading towards leading.

Daily RRG

The interesting thing is that a similar rotation is showing on the daily version of the chart. This means that the family and the weekly rotations are now in sync and reinforcing each other.

As a result, the outlook for the next few weeks remains (firmly) in favor of bonds over stocks.

What’s Happening in NYFANG+

Some of the major stocks are grouped together in the NYFANG index. Plotting this group on a Relative Rotation Graph and using the $NYFANG index as the benchmark (thus making it a closed universe) shows some interesting rotations.

Just once more to make sure; this is on a relative basis, and stocks showing strong or positive rotation and are inside or heading toward the leading quadrant do not necessarily also show uptrends in price.

The two tails that have my attention on this graph are MSFT and NVDA. NVDA has rotated into weakening from a long stint through leading. At the same time, MSFT has pretty much traced out an opposite rotation. This can be seen very well on the Relative Rotation Graph, in combination with the other stocks in the universe. But the best way to see the interaction between these two stocks is in a direct confrontation.

A Direct Confrontation Between MSFT and NVDA

The chart above shows the PERFORMANCE of MSFT (blue) and NVDA (red) in the main panel. The panels below are the RS lines vs. NYFANG index for both stocks.

This is an excellent example of how two stocks can go up in price but have completely different relative strength profiles. At the beginning of this year, both stocks were at similar levels. But the NVDA took off, reaching triple-digit returns, while MSFT massively lagged, reaching “only” a 60% return. This difference is translated in an RS line for NVDA, which trended higher in a very regular rhythm. And MSFT moved lower in RS terms.

These trends are now changing. On the RRG, this shows up as tails rotating in opposite directions. On the RS charts above, you can see how NVDA is rolling over while MSFT is curling back up.

This is a strong indication of a change in the relationship, this time in favor of MSFT over NVDA.

NVDA Completing H&S Top Formation

Last week, NVDA completed an H&S top formation by breaking below the neckline, which connects the three lows that define the bottom of the formation. Based on this formation, a price target for NVDA can be achieved by measuring the height of the formation from the neckline, roughly near 410, to the highest point near 500. This difference of $90 may be projected below the breakpoint near 410, resulting in a price target of around $320, which would mean NVDA closing the gap that occurred in May.

Such a move will definitely support the rotation in favor of MSFT over NVDA.

#StayAlert and have a great weekend. –Julius

When uncertainty prevails, investors become indecisive, which leads to erratic movements from one day to the next. This is what’s happening in the market right now. One day, you think the worst is behind you; the next day, the market sings a different tune.

Q3 2023 GDP increased 4.9%, which sent equities lower. A strong labor market didn’t ease investor sentiment either. But then, on Friday, the personal consumption expenditures price index (PCD) came in at 3.7%, indicating inflation slowed slightly in September. Investors were more optimistic, especially in the big tech space. Strong earnings from Amazon.com (AMZN) and Intel (INTC) helped reignite investor interest in the technology stocks for most of the trading day, but that fizzled towards the close.

Where Should Investors Turn?

The Nasdaq Composite ($COMPQ) had a rough week, falling below its 200-day moving average. Although the Nasdaq Composite closed higher on Friday, it bounced off its 200-day SMA and closed lower (see chart below). It also broke below its downward-sloping channel (red dashed line).

CHART 1: NASDAQ COMPOSITE DAILY CHART. The Nasdaq fell below its 200-day moving average and below a downward-sloping channel. The next support level could be the March lows. Chart source: StockCharts.com. For educational purposes.When the stock market is jittery, it makes it even more difficult for individual investors and traders to make decisions. This increases the probability of making errors, which can be frustrating. So what’s an investor to do? Well, it might be a good time to sit back and observe. The last thing you want to happen is to get caught up in the daily up-and-down movement. You want to see a definite trend, and right now, that trend is still pointing down. 

If a significant portion of your portfolio comprises tech stocks, you must monitor US Treasury yields. Rising Treasury yields weigh heavily on growth stocks. The daily chart of the 10-year US Treasury Yield Index ($TNX) below shows that yields have risen, although they’re looking like they may be close to the top. If we see stability in the bond market, there’s a chance of a rally in equity markets.

CHART 2: DAILY CHART OF 10-YEAR US TREASURY YIELD INDEX ($TNX). After rising to levels not seen since 2007, 10-year yields are taking a breather. Their direction rides a lot on whether the Fed is still hawkish. Chart source: StockCharts.com. For educational purposes.

Interest rate levels have influenced investor sentiment, especially regarding high-growth stocks. If rates start coming down, it’ll be interesting to see how quickly the equity market will react. Remember, investors have sold off a lot of their big tech holdings. Will they jump back into them quickly when rates fall?

But what if yields remain high for longer than expected? Which investments should you be considering? This week, Bitcoin ($BTCUSD) rallied to the upside, rising to its highest level in 2023. The rally was news-driven, and Bitcoin broke from the trading range it has been in since August. But that doesn’t necessarily mean Bitcoin should be considered a “safe-haven” investment. It’s still a volatile instrument driven mostly by speculation.

What About Gold?

Gold is another speculative investment. Although the general thinking is that gold is a safe haven, there’s no obvious correlation between equities and gold. It may be good to move to gold but don’t plan to hold it for the long term.

Each day presents a different story; the best you can do is wait for things to turn with momentum. It’s likely there won’t be much decisive action until after the Fed’s interest rate decision on Wednesday.

End-of-Week Wrap-Up

$SPX down 0.48% at 4117.37, $INDU down 1.12% at 32417.59; $COMPQ up 0.38% at 12643.01$VIX up 2.85% at 21.27Best performing sector for the week: UtilitiesWorst performing sector for the week: EnergyTop 5 Large Cap SCTR stocks: Vertiv Holdings, LLC (VRT); Super Micro Computer (SMCI); Applovin Corp. (APP); Splunk Inc. (SPLK); PDD Holdings Inc. (PDD)

On the Radar Next Week

Earnings from Caterpillar, Inc. (CAT), Pfizer, Inc. (PFE), Advanced Micro Devices (AMD), Apple, Inc. (AAPL), DoorDash (DASH), Marathon Oil (MRO) and many more.August home pricesOctober PMISeptember JOLTs Job OpeningsFed Interest Rate DecisionOctober Employment Data

Disclaimer: This blog is for educational purposes only and should not be construed as financial advice. The ideas and strategies should never be used without first assessing your own personal and financial situation, or without consulting a financial professional.

On this week’s edition of StockCharts TV‘s Halftime, Pete explains how his TLT call from 10/10 was spot-on! But that could all change based on the unemployment rate. Pete believes that rates will fall if the unemployment rate spikes higher, likely to the 4.25-4.5% level. Until then, it’s higher for rates.

Pete also explains that it’s important to mind the gap in the NDX. If the 200-day is broken, that is not important. It is the gap below that that counts. Ignore the headlines and mind the gap. The SPX will fill its gap as well, Pete believes, and both indexes would only be off 13-14% from their July highs if that were to occur. Pete then reviews the widely held names like AAPL, MSFT, NFLX, and more, plus looks at some breakdowns.

This video originally premiered on October 27, 2023. You can watch on our dedicated Halftime by Chaikin Analytics page on StockCharts TV, or click this link to watch on YouTube.

You can view all previously recorded episodes of Halftime by Chaikin Analytics with Pete Carmasino at this link.

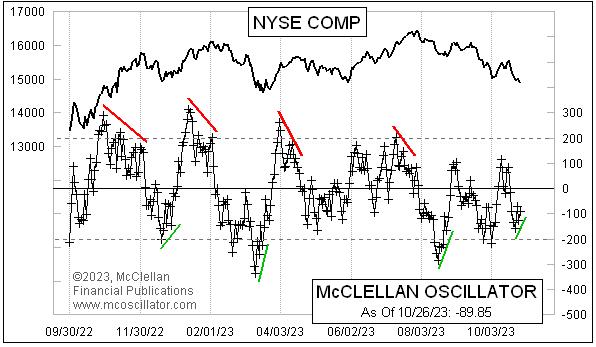
Two weeks ago, I wrote here about the McClellan Oscillator leaving a “simple” structure above zero, which said that the bulls were not (yet) in charge. The major averages since then have pushed to a lower low, even as seasonality says that the uptrend is supposed to be starting again now. But as prices have made lower lows, the NYSE’s McClellan A-D Oscillator is making a bullish divergence, which says that the energy is going out of the decline.

The McClellan Oscillator can be thought of as an accelerometer for the A-D Line. In mathematical terms, it could be said to be like the second derivative of the A-D Line, and its companion tool the McClellan Summation Index is like a first derivative. So when the Oscillator is negative, it says that the trend is down, and when it is really negative, it says that the trend has been accelerating downward at a rapid pace.

When the Oscillator makes a divergent higher low, by which I mean a less negative one, it says that the once steep downward acceleration is moderating, which can be a prelude to an upturn. It is easier for the bulls to take over once the bears start getting tired.

One problem with a divergence, either a bullish or a bearish one, is that it is only a “condition” and not a “signal”. Nothing says when such a condition has to matter, although old technical analysts will tell you that a condition will finally matter right after the moment when you give up expecting it to matter.

Stock prices do not have to start turning upward just because of a bullish divergence in the McClellan Oscillator. But it sure helps. We can even see a bullish divergence in a McClellan Oscillator calculated on the A-D data for the stocks in the Nasdaq 100 Index:

Not only is it a “local” divergence, with the latest reading being just slightly higher than that of 4 days prior, but it is also a divergence in a larger sense, as each of the successive down waves since the July 2023 price top has seen waning downward energy. The divergent higher low in late September 2023 did not matter enough to halt the overall decline, and there is no mandate that this now second higher Oscillator low has to lead to a price advance. But it does constitute more evidence in support of one. And historically, a double divergence like this, with a third bottom higher than the prior two, hints at a stronger move to come.